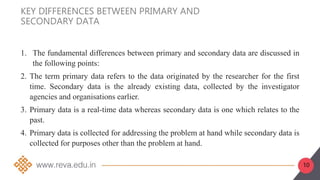
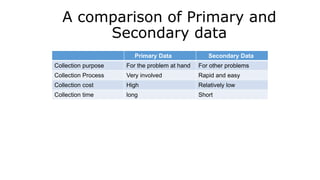
Established as per the Section 2(f) of the UGC Act, 1956
Approved by AICTE, COA and BCI, New Delhi
Business Research Methods
S c h o o l o f M a n a g e m e n t S t u d i e s
2
DATA
DATA
Data can be defined as a systematic record of a particular quantity. It is the
different values of that quantity represented together in a set. It is a collection
of facts and figures to be used for a specific purpose such as a survey or
analysis. When arranged in an organized form, can be called information.
3
CONCEPT OF DATA COLLECTION
Data collection is the process of gathering and measuring information on
variables of interest, in an established systematic fashion that enables one to
answer stated research questions, test hypotheses, and evaluate outcomes.
The data collection component of research is common to all fields of study
including physical and social sciences, humanities, business, etc. While
methods vary by discipline, the emphasis on ensuring accurate and honest
collection remains the same. The goal for all data collection is to capture
quality evidence that then translates to rich data analysis and allows the
building of a convincing and credible answer to questions that have been
posed.
4
Regardless of the field of study or preference for defining data (quantitative,
qualitative), accurate data collection is essential to maintaining the integrity of
research. Both the selection of appropriate data collection instruments
(existing, modified, or newly developed) and clearly delineated instructions for
their correct use reduce the likelihood of errors occurring
What is Data?
 Data is a existing information
/knowledge represented or coded in some
form suitable for better usage
or processing.
Data is a set of values of qualitative
or quantitative variables.
Quantitative Vs Qualitative Data
• Quantitative data are anything that can be
expressed as a number, or quantified. These data
may be represented by ordinal, interval or ratio
scales and lend themselves to most statistical
manipulation.
• Qualitative data is a categorical measurement
expressed not in terms of numbers, but rather by
means of a natural language description. In
statistics, it is often used interchangeably with
"categorical" data.
For example: favorite color = "blue"
Quantitative Vs Qualitative Data
• Quantitative and Qualitative data can be gathered
from the same data unit depending on whether the
variable of interest is numerical or categorical. For
example:
Data unit Numeric variable = Quantitative
data
Categorical
variable
= Qualitative data
A person "How
many children do
you have?"
2 children "In which
country were your
children born?"
India
"How much do
you earn?"
Rs.60,000 p.m. "What is your
occupation?"
Teacher
"How many hours
do you work?"
40 hours per
week
"Do you work full-
time or part-
time?"
Full-time
Primary and Secondary Data
• The task of data collection begins after a research problem
has been defined and research design/plan chalked out.
• While deciding about the method of data collection to be
used for the study, the researcher should keep in mind two
types of data viz., primary and secondary.
Primary and Secondary Data
• Primary Data are collected by the researcher.
• Secondary data collected by someone else and have already been
passed through the statistical process.
• A researcher as per requirement of study may decide on use of
primary data or secondary data or both.
• Both primary and secondary data have their own pros and cons.
10
KEY DIFFERENCES BETWEEN PRIMARY AND
SECONDARY DATA
1. The fundamental differences between primary and secondary data are discussed in
the following points:
2. The term primary data refers to the data originated by the researcher for the first
time. Secondary data is the already existing data, collected by the investigator
agencies and organisations earlier.
3. Primary data is a real-time data whereas secondary data is one which relates to the
past.
4. Primary data is collected for addressing the problem at hand while secondary data is
collected for purposes other than the problem at hand.
11
1. Primary data collection is a very involved process. On the other hand, secondary
data collection process is rapid and easy.
2. Primary data collection sources include surveys, observations, experiments,
questionnaire, personal interview, etc. On the contrary, secondary data collection
sources are government publications, websites, books, journal articles, internal
records etc.
3. Primary data collection requires a large amount of resources like time, cost and
manpower. Conversely, secondary data is relatively inexpensive and quickly
available.
4. Primary data is always specific to the researcher’s needs, and he controls the quality
of research. In contrast, secondary data is neither specific to the researcher’s need,
nor he has control over the data quality.
Methods of Collecting Data
• The methods of collecting data mainly refers to collecting
primary data.
• As secondary data are already available, we have to
carefully choose the sources , relevancy of data and
reliability.
Collecting Secondary Data
• Sources of secondary data are existing literature, Reports of
professional agencies, Departments, Archives, Internet, etc.
• While collecting secondary data one has to follow legal
procedures required and maintain the academic ethics.
Methods of Collecting
Primary Data
There are several methods of collecting primary data,
particularly in surveys and descriptive research. Important
ones are-
• Observation
• Interview
• Questionnaire
• Schedule
• Other Methods
Observation
See what is happening
• traffic patterns
• land use patterns
• layout of city and rural areas
• quality of housing
• condition of roads
• conditions of buildings
• who goes to a health clinic
Filtering Observations
Observation is Helpful when:
• Need direct information
• Trying to understand ongoing behavior
• There is physical evidence, products, or outputs than can be
observed
• Need to provide alternative when other data collection is
infeasible or inappropriate
Types of Observation
• Structured and Unstructured
• Participant or Non Participant or Disguised
• Natural or Contrived
• Controlled and Uncontrolled
Advantages/Disadvantages of
Observation
Advantages:
 Subjective bias eliminated
 Researcher gets current information
 Independent of Respondents
 Disadvantages:
 Expensive, Time consuming
 Limited information
 Unforeseen factors may influence
observation
Interview
• The interview method of collecting data
involves presentation of oral-verbal stimuli
and reply in terms of oral-verbal responses.
• This method can be used through personal
interviews or telephone interviews.
• Structured, Semi-Structured or Unstructured
Interview.
Interview Types
• Personal Interviews: Interviewer asking questions
generally in a face-to-face contact to the other person
or persons. Direct personal investigation or Indirect
oral investigation.
• Focused Interview is meant to focus attention on the
given experience of the respondent and its effects.
• Clinical Interview is concerned with broad underlying
feelings or motivations or with the course of individual’s
life experience.
• Non-directive Interview is that where the interviewer’s
function is simply to encourage the respondent to talk
about the given topic with a bare minimum of direct
questioning.
Skill of Interviewer
The main game in interviewing is to facilitate an interviewee’s ability
to answer. This involves:
• easing respondents into the interview
• asking strategic questions
• prompting and probing appropriately
• keeping it moving
• winding it down when the time is right
Merits/Demerits of Interview
Merits:
• More and in depth information obtained
• Personal Information
• Greater Flexibility
• Adaptation as per the respondent
Demerits:
• Bias of Interviewer
• Expensive/Time Consuming
• Need expertise
Questionnaire Method
• A questionnaire is sent (usually by post) to
persons concerned with a request to answer the
questions and return the questionnaire.
• A questionnaire consists of a number of
questions printed in a definite order.
• The respondents have to answer the questions
on their own.
Steps in questionnaire construction
• Preparation
• Constructing the first draft
• Self-evaluation
• External evaluation
• Revision
• Pre-test or Pilot study
• Revision
• Second pre-testing
• Preparing final draft
Essentials of a Good
Questionnaire
• Questionnaire should be short and simple
• Question arranged in from simple to difficult.
• Personal and intimate questions should be left
to the end.
• Technical term and vague expression should
be avoided.
• Questions should be answered in yes or no ;
multiple choice.
• Control question to cross check the information
of the responded.
Advantages of Questionnaire
The merits claimed on behalf of this method are as follows:
• 1. There is low cost even when the universe is large and is
widely spread geographically.
• 2. It is free from the bias of the interviewer; answers are in
respondents’ own words.
• 3. Respondents have adequate time to give well thought out
answers.
• 4. Respondents, who are not easily approachable, can also be
reached conveniently.
• 5. Large samples can be made use of and thus the results can be
made more dependable and reliable.
Disadvantages of questionnaire
The main demerits of this system can also be listed here:
• 1. Low rate of return of the duly filled in questionnaires; bias due
to no-response is often indeterminate.
• 2. It can be used only when respondents are educated and
cooperating.
• 3. The control over questionnaire may be lost once it is sent.
• 4. There is inbuilt inflexibility because of the difficulty of
amending the approach once questionnaires have been despatched.
• 5. There is also the possibility of ambiguous replies or omission
of replies altogether to certain questions; interpretation of omissions
is difficult.
• 6. It is difficult to know whether willing respondents are truly
representative.
• 7. This method is likely to be the slowest of all.
29
1. Main aspects of a questionnaire: Quite often questionnaire is considered as the
heart of a survey operation. Hence it should be very carefully constructed. If it is
not properly set up, then the survey is bound to fail. This fact requires us to study
the main aspects of a questionnaire viz., the general form, question sequence and
question formulation and wording. Researcher should note the following with
regard to these three main aspects of a questionnaire:
30
1. General form: So far as the general form of a questionnaire is concerned, it
can either be structured or unstructured questionnaire. Structured
questionnaires are those questionnaires in which there are definite, concrete
and pre-determined questions. The questions are presented with exactly the
same wording and in the same order to all respondents.
Resort is taken to this sort of standardisation to ensure that all respondents
reply to the same set of questions. The form of the question may be either
closed (i.e., of the type ‘yes’ or ‘no’) or open (i.e., inviting free response) but
should be stated in advance and not constructed during questioning.
31
2. Question sequence: In order to make the questionnaire effective and to ensure
quality to the replies received, a researcher should pay attention to the question-
sequence in preparing the questionnaire.
A proper sequence of questions reduces considerably the chances of individual
questions being misunderstood. The question-sequence must be clear and smoothly-
moving, meaning thereby that the relation of one question to another should be readily
apparent to the respondent, with questions that are easiest to answer being put in the
beginning.
32
1. The following type of questions should generally be avoided as opening questions
in a questionnaire:
2. questions that put too great a strain on the memory or intellect of the respondent;
3. questions of a personal character;
4. questions related to personal wealth, etc.
Descriptive Research Design :
Survey and Observation
• In structured data collection, a formal questionnaire
is prepared and the questions are asked in a
prearranged order.
• The structured direct survey, the most popular data-
collection method, involves administrating a
questionnaire, most questionnaire are fixed
alternative questions that require the respondent to
select from a predetermined set of responses.
• Example: shopping in department stores is fun.1 2 3
4 5
Advantages of Survey Methods
1. Questionnaire is simple to administer.
2. The data obtained are reliable because the
responses are limited to the alternatives stated.
3. The use of fixed response questions reduce the
variability in the results that may be caused by
differences in interviewers.
4. Coding, analysis, and interpretation of data are
relatively simple.
Disadvantages of Survey Methods
• Respondents may be unable or unwilling to provide
the desired information.
For example: Motivational factors
• Respondents may be unwilling to respond if the
information requested is sensitive or personal.
• Structured questions and fixed response alternatives
may result in loss of validity for certain types of data
such as beliefs and feelings.
Wording questions properly is not easy.
A classification of Survey Methods
Survey questionnaires may be administrated in four
modes.
1. Telephone interviews
2. Personal interviews
3. Mail interviews
4. Electronic interviewing
Telephone Methods
1. Traditional Telephone Interviews
It involve phoning a sample of respondents and asking
them a series of questions. The interviewer uses a paper
questionnaire and records the response with pencil.
2. Computer-Assisted Telephone Interviewing
CATI from a central location is now more popular than
traditional telephone method. It involves a computerized
questionnaire administrated to respondents over the
telephone. A computerized questionnaire may be generated
using a mainframe computer, a minicomputer, or a personal
computer. The interviewer sits in front of a computer
terminal and wears a miniheadset.
Personal Methods
• Personal interviewing methods may be categorized as
follows.
1. In-home interviews
2. Mall intercept interviews
3. Computer assisted interviewing
Personal In-home Interviews:
The respondents are interviewed face-to-face in their
homes. The interviewer’s task is to contact the
respondents, ask questions, and record the responses. In
recent years, the use of personal interviews declined due
to its high cost.
Mall Intercept Personal Interviews:
In this method respondents are interpreted while they are
shopping in malls and brought to test facilities in the
malls. The interviewer administrated a questionnaire as
in the home personal survey.
Computer-Assisted Personal Interviewing
(CAPI):
The respondents sits in front of a computer terminal
and answer a questionnaire on the computer screen
by using a key board or a mouse. There are several
user friendly electronic packages that design
questions that are easy for respondent to
understand. Help screens and courteous error
message are also provided.
Electronic Methods
E-mail interviews:
To conduct a e-mail survey, a list of e-mail address is
obtained. The survey is written within the body of e-mail
message. The e-mails are sent over the internet. E-mail
surveys are pure text to represent questionnaires and
can be received and responded to by anyone with an e-
mail address.
E-mail surveys have several limitations. Given the
technical limitations of most e-mail systems,
questionnaires cannot utilize programmed skip patterns,
logic checks, or randomization.
Collection of Data Through Schedule
• Schedules like questionnaires contain a set
of questions.
• Researcher /Enumerators appointed collect
data through schedules.
• Enumerators go to the field, put questions to
the respondents and fill the schedules.
• Enumerators need to be trained.
45
CASE STUDY
1. Nielsen BuzzMetrics’ (www.nielsenbuzzmetrics.com) BrandPulse suite of
products—BrandPulse and BrandPulse Insight—measure consumer-
generated media to help companies understand consumer needs,
reactions, and issues.
2. BrandPulse helps answer basic and fundamental questions about the
volume, spread, and influence of word-of-mouth practices and consumer-
to-consumer recommendations on a company or brand.
3. BrandPulse Insight provides the latest information on hot consumer trends,
up-to-the-minute data about growing consumer concerns, safety/quality
issues, or sudden shifts in consumer opinions. It generates verifiable data
about the online consumers who are best suited to influence and shape
word-of-mouth behavior.
46
1. Tide (www.tide.com), one of the most popular consumer brands in the
world from P&G, wanted to boost its consumer image for a variety of
reasons.
2. Tide’s feedback system needed to spread information and brand data more
quickly to receive complete data and identify niche markets.
3. Tide chose BrandPulse suite to redesign its feedback system. Tide is now
capturing and assimilating on one platform consumer feedback from all
incoming sources, including word of mouth. Tide’s Web site has a whole
new look and feel, with consumers receiving instant self-service answers to
many of their queries about Tide products and issues. Those requiring
follow-up are automatically routed to the appropriate consumer relations
representative.
47
1. Consumers with stain questions are linked to Tide’s “Stain Detective,” and
when appropriate, other consumers are offered surveys, study
opportunities, coupons, or special promotions. All functions are powered
by Nielsen BuzzMetrics’ tools but maintain the look and feel of Tide’s Web
site. Such proactive gathering of information helps in the development of
new products as well.
48
1. This is reflected in the number of product Selection of Survey Methods.
Depending upon such factors as information requirements, budgetary
constraints (time and money), and respondent characteristics, none, one,
two, or even all methods may be appropriate. Remember that the various
data-collection modes are not mutually exclusive. Rather, they can be
employed in a complementary fashion to build on each other’s strengths
and compensate for each other’s weaknesses. The researcher can employ
these methods in combination and develop creative methods.
49
1. To illustrate, in a classic project, interviewers distributed the product, self-
administered questionnaires, and returned envelopes to respondents.
2. Traditional telephone interviews were used for follow-up. Combining the
data-collection modes resulted in telephone cooperation from 97 percent
of the respondents. Furthermore, 82 percent of the questionnaires were
returned by mail.
3. In the chapter introduction, we illustrated how election polling successfully
used telephone and Internet interviewing. However, caution should be
exercised when using different methods in the same domestic marketing
research project (also called the use of mixed-mode surveys). The method
used may affect the responses obtained and hence the responses obtained
by different methods may not be comparable. The results of studies
examining the effect of survey methods on respondents are not very
consistent.
50
1. The following department store project example illustrates the selection of
a survey mode, whereas the P&G example illustrates the use of a
combination of survey methods. unstructured observation Observation that
involves a researcher monitoring all relevant phenomena without
specifying the details in advance. natural observation Observing behavior
as it takes place in the environment. contrived observation The behavior is
observed in an artificial environment. improvements Tide has made.
2. P&G had modified this product 22 times in its 21 years of existence. It also
makes modifications to cater to market segments such as geographies. For
example, a Tide bar was introduced in the Indian market after considering
the opinion of its Indian users.33 ■
Questionnaire Vs. Schedule
Questionnaire
• Mailed, filled by
Respondent
• Economical
• Non-Response high
• Time Consuming
• Literate, co-operative
respondents
• Success depends on
quality of questionnaire
Schedule
• Direct contact , filled by
Researcher or Enumerator
• Expensive
• Non-Response low
• Time bound
• No such pre condition
• Success depends on
quality of enumerator
Some Other Methods
• Warranty Cards Post card size cards sent to
customers and feedback collected through asking
questions.
• Distributor or Store Audits are performed by
manufacturer/distributor through salesmen.
Information so obtained are used to estimate market
size, market share, seasonal sales pattern, etc.
• Pantry Audits From the observation of pantry of
customer to know purchase habit of people ( of
which product, what brand, etc.). Questions may be
asked at the time of audit.
Some Other Methods
• Consumer Panels Pantry audit approach on a
regular basis is known as ‘consumer panel’, where a
set of consumers are arranged to come to an
understanding to maintain detailed daily records of
their consumption and the same is made available to
investigator on demands.
• Projective techniques developed by psychologists
to use projections of respondents for inferring about
underlying motives, urges, or intentions which are
such that the respondent either resists to reveal
them or is unable to figure out himself.
Some Other Methods
• Use of Mechanical Devices Eye Camera is used to
record the focus of eyes of a respondent on a
specific portion of a sketch or diagram or written
material. Psychogalvanometer is used for measuring
the extent of body excitement as a result of the
visual stimulus. Motion picture camera is used to
record movement of consumer at time of purchase.
Audiometer is used to know the preferences to TV
channels, programmes.
Some Other Methods
• Depth interviews are those interviews that are
designed to discover underlying motives and desires
and are often used in motivational research. Indirect
question or projective technique are used to know
the behaviour of respondents.
• Content Analysis Analyzing the contents of
documentary materials such as books, magazines,
newspapers and the contents of all other verbal
materials which can be either spoken or printed.
56
PILOT STUDY
PILOTING THE QUESTIONNAIRE
The questionnaire before being finalized should be cross checked with peers,
managers etc. Thereafter questionnaire must be piloted i.e. it should be tested
to see if it is obtaining the results as per objectives or not.
This is done by asking people to read it through and see if there are any
ambiguities which you have not noticed.
They should also be asked to comment about the length, structure and
wording of the questionnaire. Alter the questions accordingly.
57
You can determine the feasibility of your research design, with a pilot study
before you start. This is a preliminary, small-scale “rehearsal” in which you test
the methods you plan to use for your research project.
You will use the results to guide the methodology of your large-scale
investigation. Pilot studies should be performed for both qualitative and
quantitative studies. Here, we discuss the importance of the pilot study and
how it will save you time, frustration and resources.
58
Components of a Pilot Study
Whether your research is a survey in the form of a questionnaire or interview,
you want your study to be informative and add value to your research field.
Things to consider in your pilot study include:
• Sample size and selection. Your data needs to be representative of the
target study population. You should use statistical methods to estimate the
feasibility of your sample size.
• Determine the criteria for a successful pilot study based on the
objectives of your study. How will your pilot study address these criteria?
• When recruiting subjects or collecting samples ensure that the process
is practical and manageable.
•
59
Always test the measurement instrument. This could be a questionnaire,
equipment, or methods used. Is it realistic and workable? How can it be
improved?
• Data entry and analysis. Run the trial data through your proposed
statistical analysis to see whether your proposed analysis is appropriate for
your data set.
• Create a flow chart of the process.
60
IMPORTANCE OF PILOT STUDY IN RESEARCH
• Pilot studies should be routinely incorporated into research designs
because they:
• Help define the research question
• Test the proposed study design and process. This could alert you to
issues which may negatively affect your project.
• Educate yourself on different techniques related to your study.
• Determine the feasibility of your study, so you don’t waste resources
and time.
• Provide preliminary data that you can use to improve your chances for
funding and convince stakeholders that you have the necessary skills and
expertise to successfully carry out the research.
Selection of Appropriate Method of
Data Collection
 Nature, Scope and Object of enquiry
 Availability of Fund
 Availability of Time
 Degree of Precision Required
62
SECONDARY DATA
Secondary data means data that are already available i.e., they refer to the
data which have already been collected and analysed by someone else.
When the researcher utilises secondary data, then he has to look into various
sources from where he can obtain them.
In this case he is certainly not confronted with the problems that are usually
associated with the collection of original data.
Secondary data may either be published data or unpublished data.
63
Sources of Secondary Data
While primary data can be collected through questionnaires, depth interview,
focus group interviews, case studies, experimentation and observation; The
secondary data can be obtained through
1. Internal Sources - These are within the organization
2. External Sources - These are outside the organization
64
Internal Sources of Data
If available, internal secondary data may be obtained with less time, effort and
money than the external secondary data. In addition, they may also be more
pertinent to the situation at hand since they are from within the organization.
The internal sources include
1. Accounting resources- This gives so much information which can be
used by the marketing researcher. They give information about internal
factors.
2. Sales Force Report- It gives information about the sale of a product. The
information provided is of outside the organization.
3. Internal Experts- These are people who are heading the various
departments. They can give an idea of how a particular thing is working
4. Miscellaneous Reports- These are what information you are getting
from operational reports.
If the data available within the organization are unsuitable or inadequate, the
65
External Sources of Data
External Sources are sources which are outside the company in a larger
environment. Collection of external data is more difficult because the data
have much greater variety and the sources are much more numerous.
External data can be divided into following classes.
a. Government Publications- Government sources provide an extremely
rich pool of data for the researchers. In addition, many of these data are
available free of cost on internet websites. There are number of government
agencies generating data. These are:
1. Registrar General of India- It is an office which generate demographic
data. It includes details of gender, age, occupation etc.
66
2. Central Statistical Organization- This organization publishes the national
accounts statistics. It contains estimates of national income for several years,
growth rate, and rate of major economic activities. Annual survey of Industries
is also published by the CSO. It gives information about the total number of
workers employed, production units, material used and value added by the
manufacturer.
3. Director General of Commercial Intelligence- This office operates from
Kolkata. It gives information about foreign trade i.e. import and export. These
figures are provided region-wise and country-wise.
4. Ministry of Commerce and Industries- This ministry through the office of
economic advisor provides information on wholesale price index. These indices
may be related to a number of sectors like food, fuel, power, food grains etc. It
also generates All India Consumer Price Index numbers for industrial workers,
urban, non manual employees and cultural labourers.
67
5. Planning Commission- It provides the basic statistics of Indian
Economy.
6. Reserve Bank of India- This provides information on Banking Savings
and investment. RBI also prepares currency and finance reports.
7. Labour Bureau- It provides information on skilled, unskilled, white
collared jobs etc.
8. National Sample Survey- This is done by the Ministry of Planning and it
provides social, economic, demographic, industrial and agricultural statistics.
9. Department of Economic Affairs- It conducts economic survey and it
also generates information on income, consumption, expenditure, investment,
savings and foreign trade.
68
10. State Statistical Abstract- This gives information on various types of
activities related to the state like - commercial activities, education, occupation
etc.
b. Non Government Publications- These includes publications of various
industrial and trade associations, such as
1. The Indian Cotton Mill Association
2. Various chambers of commerce
3. The Bombay Stock Exchange (it publishes a directory containing
financial accounts, key profitability and other relevant matter)
4. Various Associations of Press Media.
69
5. Export Promotion Council.
6. Confederation of Indian Industries ( CII )
7. Small Industries Development Board of India
8. Different Mills like - Woolen mills, Textile mills etc
The only disadvantage of the above sources is that the data may be biased.
They are likely to colour their negative points.
70
c. Syndicate Services- These services are provided by certain organizations
which collect and tabulate the marketing information on a regular basis for a
number of clients who are the subscribers to these services. So the services are
designed in such a way that the information suits the subscriber. These
services are useful in television viewing, movement of consumer goods etc.
These syndicate services provide information data from both household as
well as institution.
In collecting data from household they use three approaches
1. Survey- They conduct surveys regarding - lifestyle, sociographic,
general topics.
2. Mail Diary Panel- It may be related to 2 fields - Purchase and Media.
3. Electronic Scanner Services- These are used to generate data on
volume.
They collect data for Institutions from
71
4. Whole sellers
5. Retailers, and
6. Industrial Firms
Various syndicate services are Operations Research Group (ORG) and The
Indian Marketing Research Bureau (IMRB).
Importance of Syndicate Services
Syndicate services are becoming popular since the constraints of decision
making are changing and we need more of specific decision-making in the
light of changing environment. Also Syndicate services are able to provide
information to the industries at a low unit cost.
72
Disadvantages of Syndicate Services
The information provided is not exclusive. A number of research agencies
provide customized services which suits the requirement of each individual
organization.
d. International Organization- These includes
1. The International Labour Organization (ILO)- It publishes data on the
total and active population, employment, unemployment, wages and consumer
prices
2. The Organization for Economic Co-operation and development (OECD)-
It publishes data on foreign trade, industry, food, transport, and science and
technology.
3. The International Monetary Fund (IMA)- It publishes reports on national
and international foreign exchange regulations.
73
SECONDARY DATA, MUST SEE THAT THEY POSSESS
FOLLOWING CHARACTERISTICS:
1. Reliability of data: The reliability can be tested by finding out such things
about the said data: (a) Who collected the data? (b) What were the sources of
data? (c) Were they collected by using proper methods (d) At what time were
they collected?(e) Was there any bias of the compiler? (t) What level of
accuracy was desired? Was it achieved ?
2. Suitability of data: The data that are suitable for one enquiry may not
necessarily be found suitable in another enquiry. Hence, if the available data
are found to be unsuitable, they should not be used by the researcher.
74
In this context, the researcher must very carefully scrutinise the definition of
various terms and units of collection used at the time of collecting the data
from the primary source originally.
Similarly, the object, scope and nature of the original enquiry must also be
studied. If the researcher finds differences in these, the data will remain
unsuitable for the present enquiry and should not be used.
75
3. Adequacy of data: If the level of accuracy achieved in data is found
inadequate for the purpose of the present enquiry, they will be considered as
inadequate and should not be used by the researcher. The data will also be
considered inadequate, if they are related to an area which may be either
narrower or wider than the area of the present enquiry.
76
From all this we can say that it is very risky to use the already available data.
The already available data should be used by the researcher only when he
finds them reliable, suitable and adequate.
But he should not blindly discard the use of such data if they are readily
available from authentic sources and are also suitable and adequate for in that
case it will not be economical to spend time and energy in field surveys for
collecting information.
At times, there may be wealth of usable information in the already available
data which must be used by an intelligent researcher but with due precaution.
Precautions in Data Collection
• The data must be relevant to the research
problem.
• It should be collected through formal or
standardized research tools.
• The data should be such as these can be
subjected to statistical treatment easily.
• The data should have minimum
measurement error.
78
PROCESSING OF DATA
Processing and analyzing data involves a number of closely related operations
which are performed with the purpose of summarizing the collected data and
organizing these in a manner that they answer the research questions
(objectives).
It includes
1.Editing
2.Coding
3.Tabulation
79
EDITING OF DATA
It is a process of examining the collected raw data to detect errors and
omissions and to correct these when possible. It is also defined as the process
relating to the review and adjustment of collected survey data with an aim to
control the quality of the collected data. Data editing can be performed
manually, with the assistance of a computer or using a combination of both
the methods.
Data editing is crucial as it helps in take full advantage of the available data to
be converted into useful data, ensuring that the errors arising during
collection, entry, assimilation are omitted or minimized. It also assures that the
consistency is coherent and consistent, since such characteristics have a
constructive impact on the final analysis and outcomes.
1. 1.
80
1. Editing: Editing of data is a process of examining the collected raw data
(specially in surveys) to detect errors and omissions and to correct these
when possible.
2. As a matter of fact, editing involves a careful scrutiny of the completed
questionnaires and/or schedules.
3. Editing is done to assure that the data are accurate, consistent with other
facts gathered, uniformly entered, as completed as possible and have been
well arranged to facilitate coding and tabulation.
81
With regard to points or stages at which editing should be done, one can talk
of field editing and central editing.
1.Field editing consists in the review of the reporting forms by the investigator
for completing (translating or rewriting) what the latter has written in
abbreviated and/or in illegible form 1 at the time of recording the
respondents’ responses.
This type of editing is necessary in view of the fact that individual writing styles
often can be difficult for others to decipher. This sort of editing should be
done as soon as possible after the interview, preferably on the very day or on
the next day. While doing field editing, the investigator must restrain himself
and must not correct errors of omission by simply guessing what the
informant would have said if the question had been asked.
1.
82
1. Central editing should take place when all forms or schedules have been
completed and returned to the office. This type of editing implies that all
forms should get a thorough editing by a single editor in a small study and
by a team of editors in case of a large inquiry.
2. Editor(s) may correct the obvious errors such as an entry in the wrong
place, entry recorded in months when it should have been recorded in
weeks, and the like. In case of inappropriate on missing replies, the editor
can sometimes determine the proper answer by reviewing the other
information in the schedule.
83
1. At times, the respondent can be contacted for clarification. The editor must
strike out the answer if the same is inappropriate and he has no basis for
determining the correct answer or the response. In such a case an editing
entry of ‘no answer’ is called for.
2. All the wrong replies, which are quite obvious, must be dropped from the
final results, especially in the context of mail surveys.
84
CODING OF DATA
1. The purpose of data coding is to bring out the essence and meaning of the
data that has been collected from the respondents. In order to make sense
of the data, it must be analyzed.
2. Analysis begins with the labeling of data as to its source, how it was
collected, the information it contains, etc. When we have received
hundreds of questionnaires, forma and formats containing the data it
seems impossible to figure out any outcomes just by looking at the
quantum.
3. E.g. if the Hotel guest‘s feedback is received in letter forms with no specific
format it would be nearly impossible to assess the satisfaction levels, major
complaint areas or just finding out who has been recommended by most
of the guests as the best employee at the hotel.
85
1. Coding facilitates the researcher to reduce the bulk od information and
data to a form that is easily understandable and can be interpreted soon
either manually or through software programming.
2. For example, the injury rate at different levels of intensive physical labor
demanding operations in various hotels in the city may not be sorted
under name but each of the hotels can be assigned a numeric or
alphabetical code. The content analysis computer programs help
researchers to code textual data for qualitative or quantitative analysis.
86
CLASSIFICATION AND TABULATION
1. It is the process of arranging data in groups or classes on the basis of
common characteristics such as descriptive or numerical. Most research
studies result in a large volume of raw data which must be reduced into
homogeneous groups if we are to get meaningful relationships. This fact
necessitates classification of data which happens to be the process of
arranging data in groups or classes on the basis of common characteristics.
2. Data having a common characteristic are placed in one class and in this
way the entire data get divided into a number of groups or classes.
Classification can be one of the following two types, depending upon the
nature of the phenomenon involved:
87
1. (a) Classification according to attributes: As stated above, data are classified
on the basis of common characteristics which can either be descriptive
(such as literacy, sex, honesty, etc.) or numerical (such as weight, height,
income, etc.). Descriptive characteristics refer to qualitative phenomenon
which cannot be measured quantitatively; only their presence or absence in
an individual item can be noticed.
2. Data obtained this way on the basis of certain attributes are known as
statistics of attributes and their classification is said to be classification
according to attributes. Such classification can be simple classification or
manifold classification.
3. In simple classification we consider only one attribute and divide the
universe into two classes—one class consisting of items possessing the
given attribute and the other class consisting of items which do not
possess the given attribute.
88
1. But in manifold classification we consider two or more attributes
simultaneously, and divide that data into a number of classes (total number
of classes of final order is given by 2n, where n = number of attributes
considered).* Whenever data are classified according to attributes, the
researcher must see that the attributes are defined in such a manner that
there is least possibility of any doubt/ambiguity concerning the said
attributes.
89
(b) Classification according to class-intervals: Unlike descriptive characteristics,
the numerical characteristics refer to quantitative phenomenon which can be
measured through some statistical units. Data relating to income, production,
age, weight, etc. come under this category. Such data are known as statistics of
variables and are classified on the basis of class intervals.
90
1. CLASSIFICATION ACCORDING TO THE CLASS INTERVAL USUALLY
INVOLVES THE FOLLOWING THREE MAIN PROBLEMS:
2. 1. Number of Classes. 2. How to select class limits. 3. How to determine the
frequency of each class
91
1. TABULATION
2. It is the process of summarizing raw data and displaying the same in
compact form for further analysis. It is an orderly arrangement of data in
columns and rows.The mass of data collected has to be arranged in some
kind of concise and logical order. Tabulation summarizes the raw data and
displays data in form of some statistical tables. Tabulation is an orderly
arrangement of data in rows and columns.
92
OBJECTIVE OF TABULATION:
1. Conserves space & minimizes explanation and descriptive statements.
2. Facilitates process of comparison and summarization.
3. Facilitates detection of errors and omissions.
4. Establish the basis of various statistical computations.
93
BASIC PRINCIPLES OF TABULATION:
1. Tables should be clear, concise & adequately titled.
2. Every table should be distinctly numbered for easy reference.
3. Column headings & row headings of the table should be clear & brief.
4. Units of measurement should be specified at appropriate places.
5. Explanatory footnotes concerning the table should be placed at appropriate
places.
6. Source of information of data should be clearly indicated.
7. The columns & rows should be clearly separated with dark lines
94
8. Demarcation should also be made between data of one class and that of
another. 9. Comparable data should be put side by side.
10. The figures in percentage should be approximated before tabulation.
11. The alignment of the figures, symbols etc. should be properly aligned and
adequately spaced to enhance the readability of the same.
12. Abbreviations should be avoided.
Tabulation is essential because:
• It conserves space and reduces explanatory and descriptive statement
to a minimum.
•
95
1. It facilitates the process of comparison.
2. • It facilitates the summation of items and the detection of errors and
omissions.
3. • It provides the basis for various statistical computations.
96
1. Tabulation may also be classified as simple and complex tabulation. Simple
tabulation generally results in one-way tables which supply answers to
questions about one characteristic of data only. Complex tabulation usually
results on two-way tables that give information about two interrelated
characteristics of data, three –way tables or still higher order tables known
as manifold tables. Components of Data Tables
2. The components of data tables are as under:
3. Table Number: Each table should have a specific table number for ease of
access and locating. This number can be readily mentioned anywhere
which serves as a reference and leads us directly to the data mentioned in
that particular table.
97
1. Title: A table must contain a title that clearly tells the readers about the
data it contains, time period of study, place of study and the nature of
classification of data.
2. Head notes: A headnote further aids in the purpose of a title and displays
more information about the table. Generally, headnotes present the units
of data in brackets at the end of a table title.
3. Stubs: These are titles of the rows in a table. Thus a stub display
information about the data contained in a particular row.
4. Caption: A caption is the title of a column in the data table. In fact, it is a
counterpart if a stub and indicates the information contained in a column.
5. Body or field: The body of a table is the content of a table in its entirety.
Each item in a body is known as a ‗cell‘.
98
1. Scorecard
2. • Scatter Charts
3. • Bullet Charts
4. • Area Chart
5. • Text & Images
6. Presenting and Analyzing data:
7. 1. Frame the objectives of the study and make a list of data to be collected
and its format.
8. 2. Collect/obtain data from primary or secondary sources.
9. 3. Change the format of data, i.e., table, maps, graphs, etc. in the desired
format
99
1. PRESENTATION OF DATA
2. The various types of data that can be presented are: • Textual presentation
• Data tables • Diagrammatic presentation
3. • Time Series Data
4. • Bar Charts
5. • Combo Charts
6. • Pie Charts
7. • Tables
8. • Geo Map
9. •
Precautions in Data Collection
• The data must be tenable for the
verification of the hypotheses.
• The data should be collected through
objective procedure.
• The data should be accurate and precise.
• The data should be reliable and valid
• The data should be complete in itself and
also comprehensive in nature.
RESEARCH DESIGN
Research Design
• A research design is a framework or blueprint for conducting
the business research project. It details procedures are
necessary for obtaining the information needed to structure
and/or solve research problems. Although a broad approach
to the problem has already been developed, the research
design specifies the details – the nuts and bolts of
implementing the project.
Research Design
• A research design involves the following components, or
tasks:
1. Define the information needed
2. Design the exploratory, descriptive, and/or causal phases
of research
3. Specify the measurement and scaling procedures
4. Construct and pretest a questionnaire
5. Specify the sampling process and sample size
6. Develop a plan of data analysis
Research design: classification
• Research designs may be broadly classified into exploratory and
conclusive.
• The primary objective of exploratory research is to provide
insights into, and an understanding of, the problem confronting
the researcher. Exploratory research is used in cases when you
must define the problem more precisely, identify the relevant
courses of action, or gain additional insights before an approach
can be developed. The information needed is loosely defined at
this stage, and the research process that is adopted is flexible
and unstructured.
• Exploratory research should be regarded as tentative or as input
to further research. Typically, such research is followed by further
exploratory or conclusive research.
Research design: classification
• The insight gained from exploratory research might be
verified or quantified by conclusive research. The objective of
conclusive research is to test specific hypothesis and
examine specific relationships. This requires that researcher
clearly specify the information needed. Conclusive research
is typically more formal and structured than exploratory
research. It is based on large, representative samples, and
the data obtained are subjected to quantitative analysis. The
findings from this research are considered to be conclusive
in nature in that they are used as input into managerial
decision making.
RESEARCH DESIGN
Exploratory
research
design
Conclusive
research
design
Multiple-
cross
sectional
design
Single cross
sectional
design
Longitudinal
research
Cross-
sectional
research
Causal
research
Descriptive
research
Exploratory Research
• The objective of exploratory research is to express or search
through a problem or situation to provide insights and
understanding. Exploratory research could be used for any of the
following purposes.
1. Formulate a problem or define a problem more precisely.
2. Identify alternative course of action.
3. Develop hypothesis.
4. Isolate key variables and relationship for further examination.
5. Gain insights for developing an approach to the problem.
6. Establish priorities for further research.
Exploratory Research
• The use of exploratory research to identify the social causes.
As a result, the following causes were identified as salient:
childcare, drug abuse, public education, hunger, crime,
environment, medical research, poverty. In general, it is
meaningful in any situation where the researcher does not
have enough understanding to proceed with the research
project.
Exploratory Research
• Exploratory research is characterized by flexibility and versatility with respects to methods
because formal research protocols and procedures are not employed. It rarely involves
structured questionnaires, large samples, and probability sampling plans.
• Exploratory research can greatly benefit from use of following methods.
1. Survey of exports
2. Pilot surveys
3. Secondary data analyzed in a qualitative way
4. Qualitative research
Example: the department store project, which employed the following types of studies.
• To identify the relevant demographic and psychographic factors
• Interviews with retailing experts to determine trends
• A comparative analysis
• Focus groups.
Exploratory Descriptive Causal
objective
Discover
ideas and
insights
Describe market
characteristics
Determine cause
and effect
relationships.
Characteristi
cs
Flexible
Versatile
Often the front
end of total
research
design
Marked by the prior
formulation of
specific hypothesis
Preplanned and
structured design
Manipulation of
one or more
independent
variables
Control of other
mediating
variables
Methods Expert
surveys
Pilot surveys
Secondary
data
Qualitative
research
Secondary data
Surveys
Panels
Observational and
other data
Experiments
A COMPARISION OF BASIC RESEARCH DESIGNS
Descriptive Research
• A type of conclusive research that has its major objective the
describing of something – usually market characteristics or
functions.
• Descriptive research is conducted for the following reasons.
1. To describe the characteristics of relevant groups
2. To estimate the percentage of units in a specified population
exhibiting a certain behavior.
3. To determine the perception of product characteristics
4. To determine the degree to which marketing variables are
associated
5. To make specific predictions
• A descriptive design requires a clear specification of the who, what, when, where, why, and way of research.
• Examples of descriptive studies:
o Market studies
o Market share studies
o Sale analysis studies
o Image studies
o Product usage studies
o Distribution studies
o Pricing studies
o Advertising studies
Secondary data analyzed in a quantitative methods are
• Surveys
• Panels
• Observational and other data
Causal Research
Causal research is used to obtain evidence of cause- and-effect
relationships. Researchers continually make decisions based on
assumed causal relationships. These assumptions may not be
justifiable and the validity of causal relationship should be examined
via formal research. For example, the common assumption that a
decrease in price will lead to increased sales and market shares
does not hold in certain competitive environments.
Causal research is appropriate for the following purposes:
1. To understand which variables are the cause
( independent variables) and which variables are the effect
(dependent variables) of a phenomenon.
2. To determine the nature of the relationship between the causal
variables and the effect to be predicted.
Causal Research
• Like descriptive research, causal research requires a
planned and structured design. Although descriptive
research can determine the degree of association
between variables, it is not appropriate for examining
causal relationships. Such an examination requires causal
design. In which the causal, or independent, variables
are manipulated in a relatively controlled environment. A
relatively controlled environment is one in which the
other variables that may affect the dependent variable
are controlled or checked as much as possible. The effect
of this manipulation on one or more dependent variables
is then measured to infer causality. The main method of
causal research is experimentation.
Relationships among Exploratory,
Descriptive, and Causal research
The following general guidelines for choosing research designs.
1. When little is known about the problem situation, it is desirable to begin
with exploratory research. Exploratory research is appropriate when the
problems needs to be defined more precisely, alternative course of
action identified, research hypothesis developed, and key variables are
isolated and classified as dependent or independent.
2. Exploratory research is the initial step in the overall research design
framework. It should, in most instances, be followed by descriptive or
causal research.
3. It is not necessary to begin every research design with exploratory
research. It depends upon the precision with which the problem has
been defined and the researcher’s degree of certainty about the
approach to the problem.
4. Although exploratory research is the initial step, it need not be
exploratory research may follow descriptive or causal research.
Exploratory Research Design:
Secondary Data
Primary versus Secondary data:
Primary data are originated by a researcher for the
specific purpose of addressing the problem at hand.
Obtaining primary data can be expensive and time
consuming.
Secondary data are data that have already been
collected for purposes other than the problem at the
hand. These data can be located quickly and
inexpensively.
A comparison of Primary and
Secondary data
Primary Data Secondary Data
Collection purpose For the problem at hand For other problems
Collection Process Very involved Rapid and easy
Collection cost High Relatively low
Collection time long Short
Advantages and Uses of
Secondary Data
• Secondary data offer several advantages over primary
data. Secondary data are easily accessible, relatively
inexpensive and quickly obtained.
• Secondary data can help to:
1. Identify the problem
2. Better define the problem
3. Develop an approach to the problem
4. Formulate an appropriate research design
5. Answer certain research questions and test some
hypothesis
6. Interpret primary data more insightfully
Disadvantages of Secondary Data
• Secondary data usefulness to the current problem
may be limited in several important ways:
1. Relevance and accuracy
2. The objectives, nature, and method used to collect
the secondary data may not be appropriate the
present situation
3. Secondary data may be lacking in accuracy, or they
may not be completely current or dependent.
4. Important to evaluation
Criteria for Evaluating Secondary
Data
• The quality of secondary data should be routinely
evaluated, using the following criteria.
1. Specifications/Methodology
2. Error/Accuracy
3. Currency
4. Objective
5. Nature
6. dependability
Classification of Secondary Data
Secondary Data
External
Internal
Computerize
d databases
Published
materials
Requires
further
processing
Ready to
use
Syndicated
services
Internal Data and External Data
• Internal data are those generated within the organization
for which the research being conducted. The information
may be available in ready to use format, such as
information routinely supplied by the management
decision support system. These data may exist within the
organization but may require considerable processing
before they are useful to manager.
• External data's are those generated by sources outside
the organization. These data may exist in the form of
published material, online databases, or information
made available by syndicate services.
Internal Secondary Data
• Internal sources should be the starting point in the
search for secondary data. Because most organizations
have a wealth of in-house information, some data may
be readily available and provide useful insights.
• Secondary internal data have two significant advantages.
They are easily available and inexpensive.
Database Marketing:
Database marketing involves the use of computers to
capture and track customer profile and purchase details.
This secondary information serves as the foundation of
internal source.
Internal Secondary Data
Type of individual/Household level data available from syndicate firms
I. Demographic Data
• Identification-name, address, telephone
• Sex
• Marital status
• Names of family members
• Age
• Income
• Occupation
• Number of children present
• Home ownership
• Length of residence
• Number and make of cars owned
II. Psychographic Lifestyle Data
• Interest in golf
• Interest in snow skiing
• Interest in book reading
• Interest in running
• Interest in bicycling
• Interest in electronics
Published External Secondary
Sources
Published
Secondary Data
Government
Sources
General
Business
Sources
Census Data
Statistical
Data
Indexes
Guides
Other
Government
publications
Directorie
s
Computerized Databases
• Computer databases consists of information that has
been made available in computer reliable form for
electronic distribution.
• Computerized databases may be classified as online,
internet, or offline.
Classification of Computerized
Databases
Computerized
Databases
Offline
Online
Directory
Databases
Full-Text
Databases
Numeric
Databases
Biographic
Databases
Special-
purpose
Databases
Internet
Syndicated Sources of Secondary
Data
• Syndicated sources, also referred to as syndicated
services, companies that collect and sell common
pools of data of known commercial value, designed
to serve information needs shared by a number of
clients. These data are not collected for the purpose
of business research problems specific to individual
clients, but the data and reports supplied to clients
companies can be personalized to fit for particular
needs.
A Classification of Syndicated
Services
Unit
of Measurement
Institutions
Households/
consumers
Exploratory Research Design:
Qualitative Research
Qualitative
Research
Procedures
Indirect
Direct
Projective
Techniques
Expressive
Techniques
Construction
Techniques
Completion
Techniques
Associative
Techniques
Exploratory Research Design:
Qualitative Research
Projective Techniques:
Both focus groups and depth interviews are direct
approaches in which the true purpose of the research is
disclosed to the respondents or is otherwise obvious to
them.
A projective technique is an unstructured and indirect
form of questioning encourages the respondents to
project their underlying motivations, beliefs, and
attitudes or feelings regarding the issues of concern. In
projective techniques, respondents are asked to interpret
the behavior of others rather than describe their own
behavior.
• Association techniques:
In association techniques, an individual is presented with a stimulus and
asked to respond with the first thing that comes to mind.
Word association is the best known of these techniques. In word
association, respondents are presented with a list of words, one at a time,
and asked to respond to each with the first word that comes to mind. The
words of interest, called test words, are interspersed throughout the list.
For example, in the department store study, some of the test words might
be: location, parking, shopping, quality and price.
Responses are analyzed by calculating:
1. The frequency with which any word is given as a response.
2. The amount of time that elapses before a response given.
3. The number of respondents who do not respond at all to a test word
within a reasonable period of time.
Completion Techniques
• In completion techniques, the respondent is asked to
complete an incomplete stimulus situation. Common
completion techniques in research situation are sentence
completion and story completion.
Sentence Completion:
It is similar to word association. Respondents are given
incomplete sentences and asked to complete them.
A person who shops at lifestyle is ____________
When I think of shopping in a department store I______
Completion Techniques
Story Completion:
A projective technique in which the respondents are
provided with part of a story and required to give the
conclusion in their own words.
The respondents completion of this story will
reveal their underlying feelings and emotions.
Construction Techniques
Construction techniques are closely related to the
completion techniques. Construction techniques
require the respondent to construct a response in the
form of a story, dialogue, or description. In a
construction technique, the researcher provides less
initial structure to the respondent than in a
completion technique.
The two main construction techniques are
1. Picture Response
2. Cartoons
Construction Techniques
1. Picture Response Technique:
A projective techniques can be traced to the Thematic
Appreciation Test (TAT), which consists of a series of
pictures of ordinary as well as unusual events. In some of
these pictures, the persons or objects are clearly
depicted, while in others they are relatively vague.
The respondent is asked to tell stories about these
pictures. The respondent’s interpretation of the picture
gives indications of that individual’s personality. For
example, an individual may be characterized by
impulsive, creative, unimaginative and so on.
2. Cartoons
In cartoon tests, cartoon characteristics are shown
in specific situation related to the problem. The
respondents are asked to indicate what one cartoon
character might say in response to the comments
of another character.
Expressive Techniques
• In expressive techniques, respondents are presented with a verbal or visual
situation and asked to relate the feelings and attitudes of other people to the
situation. The respondents express not their own feelings or attitudes, but those of
others. The two main expressive techniques are role playing and third-person
technique.
Role Playing:
In role playing, respondents are asked to play the role or assume the behavior of
someone else. The researcher assumes that the respondents will project their own
feelings into the role. These can be then uncovered by analyzing the responses.
Third-Person Techniques:
In third-person technique, the respondent is presented with a verbal or visual
situation and asked to relate the beliefs and attitudes of a third person rather than
directly expressing personal beliefs and attitudes. This third person may be a
friend, neighbor, colleague, or a typical person. Asking the individual to respond in
the third person reduces the social pressure to give an acceptable answer.
Advantages of Projective
Techniques
1. Projective techniques can increase the validity of
responses by disguising the purpose.
2. It avoids the issues to be addressed personal, sensitive,
or subject to strong social norms.
3. In the unstructured direct technique, they may elicit
responses that subjects would be un willing or unable
to give if they knew the purpose of the study.
4. These techniques are also helpful when underlying
motivations, beliefs, and attitudes are opening at a
subconscious level.
Disadvantages of Projective
Techniques
• Projective techniques suffer from many of the
disadvantages of unstructured direct techniques, but
to greater extent.
1. These techniques generally require personal
interviews with highly trained interviewers.
2. Skilled interprets are also required to analyze the
responses. Hence they tend to be expensive.
3. There is serious risk of interpretation bias. Making
the analysis and interpretation difficult and
subjective.
Applications of projective
techniques
1. Projective techniques should be used because the
required information cannot be accurately obtained
by direct method.
2. Projective techniques should be used for
exploratory research to gain initial insights and
understanding.
3. Given their complexity, projective techniques
should not be used naively.
Criteria FOCUS
GROUPS
DEPTH
INTERVIEWS
PROJECTIVE
TECHNIQUES
Degree of structure Relatively high Relatively
medium
Relatively low
Probing of individual
respondents
Low High medium
Moderator bias Relatively
medium
Relatively high Relatively low
Interpretation bias Relatively low Relatively
medium
Relatively high
Uncovering
subconscious
information
low Medium to high high
Discovering innovation
information
high Medium Low
Obtaining sensitive low Medium high
A comparison of focus groups, depth interviews, and projective techniques
Descriptive Research Design :
Survey and Observation
Survey Methods :
The survey method involves a structured
questionnaire given to respondents and design to
elicit specific information.
Respondents are asked a variety of questions
regarding their behavior, intentions, demographic
and lifestyle characteristics.
Structured here refer to the degree of data collection
process.
Descriptive Research Design :
Survey and Observation
• In structured data collection, a formal questionnaire
is prepared and the questions are asked in a
prearranged order.
• The structured direct survey, the most popular data-
collection method, involves administrating a
questionnaire, most questionnaire are fixed
alternative questions that require the respondent to
select from a predetermined set of responses.
• Example: shopping in department stores is fun.1 2 3
4 5
Advantages of Survey Methods
1. Questionnaire is simple to administer.
2. The data obtained are reliable because the
responses are limited to the alternatives stated.
3. The use of fixed response questions reduce the
variability in the results that may be caused by
differences in interviewers.
4. Coding, analysis, and interpretation of data are
relatively simple.
Disadvantages of Survey Methods
• Respondents may be unable or unwilling to provide
the desired information.
For example: Motivational factors
• Respondents may be unwilling to respond if the
information requested is sensitive or personal.
• Structured questions and fixed response alternatives
may result in loss of validity for certain types of data
such as beliefs and feelings.
Wording questions properly is not easy.
A classification of Survey Methods
Survey questionnaires may be administrated in four
modes.
1. Telephone interviews
2. Personal interviews
3. Mail interviews
4. Electronic interviewing
Telephone Methods
1. Traditional Telephone Interviews
It involve phoning a sample of respondents and asking
them a series of questions. The interviewer uses a paper
questionnaire and records the response with pencil.
2. Computer-Assisted Telephone Interviewing
CATI from a central location is now more popular than
traditional telephone method. It involves a computerized
questionnaire administrated to respondents over the
telephone. A computerized questionnaire may be generated
using a mainframe computer, a minicomputer, or a personal
computer. The interviewer sits in front of a computer
terminal and wears a miniheadset.
Personal Methods
• Personal interviewing methods may be categorized as
follows.
1. In-home interviews
2. Mall intercept interviews
3. Computer assisted interviewing
Personal In-home Interviews:
The respondents are interviewed face-to-face in their
homes. The interviewer’s task is to contact the
respondents, ask questions, and record the responses. In
recent years, the use of personal interviews declined due
to its high cost.
Mall Intercept Personal Interviews:
In this method respondents are interpreted while they are
shopping in malls and brought to test facilities in the
malls. The interviewer administrated a questionnaire as
in the home personal survey.
Computer-Assisted Personal Interviewing
(CAPI):
The respondents sits in front of a computer terminal
and answer a questionnaire on the computer screen
by using a key board or a mouse. There are several
user friendly electronic packages that design
questions that are easy for respondent to
understand. Help screens and courteous error
message are also provided.
Mail Methods
Mail Interviews:
In the traditional mail interview, questionnaire are mailed to
preselected potential respondents. A typical mail interview package
consists of the outgoing envelope, cover letter questionnaire, return
envelope and possibly an incentive. The respondents complete and
return the questionnaires. There is no verbal interaction between
the researcher and respondent.
Mail Panels:
A mail panel consists of a large, nationally representative sample of
households that have agreed to participate in periodic mail
questionnaires and product tests. The house holds are compensate
with various incentives. Data on the panel members is updated
every year. Because of the panel members commitment, the
response rates can approach 80 percent.
Electronic Methods
E-mail interviews:
To conduct a e-mail survey, a list of e-mail address is
obtained. The survey is written within the body of e-mail
message. The e-mails are sent over the internet. E-mail
surveys are pure text to represent questionnaires and
can be received and responded to by anyone with an e-
mail address.
E-mail surveys have several limitations. Given the
technical limitations of most e-mail systems,
questionnaires cannot utilize programmed skip patterns,
logic checks, or randomization.
Electronic Methods
Internet Interviews:
In contrast to e-mail surveys, internet or web surveys
use hypertext markup language (HTML). The
language of the web site. Respondents may be
recruited over the internet from potential respondent
databases maintained by the business research firm
or they can be recruited by conventional methods.
For web surveys that recruit respondents who are
browsing or by placing banner ads, there is inherent
self-selection bias.
A Comparative Evaluation of
Survey Methods
1. Flexibility of Data Collection
2. Diversity of questions
3. Use of physical stimuli
4. Sample control
5. Control of data – collection environment
6. Control of field force
7. Quantity of data
8. Response rate
9. Perceived anonymity of the respondent
10. Social desirability
11. Obtaining sensitive information
12. Potential for interviewer bias
13. Speed
14. cost
Observation Methods
• Observation methods are the second type of
methodology used in descriptive research.
Observation involves recording the behavioral
patterns of people, objects, and events in a
systematic manner to obtain information about the
phenomenon of interest.
• Observation methods may be classified as follows.
1. Structured Versus Unstructured Observation
2. Disguised Versus Undisguised Observation
3. Natural Versus Contrived Observation
A Classification of Observation
Methods
Observation
Methods
Trace
Analysis
Contest
Analysis
Audit
Mechanical
Observation
Personal
Observation
A Comparative Evaluation of
Observation Methods
• Degree of structure
• Degree of disguise
• Ability to observe in natural setting
• Observation bias
• Analysis bias
• General remarks
A Comparison of Survey and
Observation Methods
Relative disadvantages of observation:
1. Measurement of actual behavior
2. Certain data can be collected only by observation. The respondent is
unaware of or unable to communicate.
For Example: babies at playground.
Relative Disadvantages of observation:
1. Selective perception can bias the data
2. Observations methods may be unethical
3. Observation behavior may not be determined because little is known
about the underlying motives, beliefs, attitudes and preferences.
Causal Research Design :
Experimentation
Concept of causality:
When the occurrence of X increases the probability of
the occurrence of Y.
Experimentation is commonly used to infer causal
relationships. The concept of causality is complex.
“causality” means something very different to
average person on the street than to a scientist. A
statement such as X causes Y will have different
meaning to an ordinary person and to a scientist.
Concept of causality:
Ordinary meaning Scientific Meaning
• X is the only cause of Y
• X must always lead to Y
• ( X is a deterministic cause of
Y)
• It is possible to prove that X is
a cause of Y.
• X is only one of a number of
possible cause of Y.
• The occurrence of X makes the
occurrence of Y more probable.
• We can never prove that X is
cause of Y.
• At best, we can infer that X is
cause of Y.
Conditions for Causality
• There are three conditions must be satisfied. These
are:
1. Concomitant Variation
2. Time order of occurrence of variables
3. Elimination of other possible causal factors
Concomitant Variation
• Concomitant variation is the extent to which a cause,
X and effect, Y, occur together or vary together in the
way predicted by the hypothesis under consideration.
For example: In the qualitative case, the management
of a department store believes that sales are highly
dependent upon the quality of in-store service.
For a quantitative example, consider a random
survey of 1,000 respondents regarding purchase of
fashion clothing from department stores. This survey
yields the data in the below table.
Evidence of Concomitant variation
between Fashion Clothing and
Education
Education-X Purchase of Fashion Clothing -Y
High Low Total
High 363 137 500
Low 322 178 500
Time order of occurrence of
variables
The time order of occurrence condition states that the
causing event must occur either before or
simultaneously with the effect; it cannot occur
afterwards. By definition, an effect cannot be
produced by an event in a relationship to be both
cause and effect has taken place.
To illustrate, customers who shop frequently in a
department store are more likely to have the charge
or credit card for that store. Also, customers who
have the charge card for department store are likely
to shop there frequently.
Absence of Other Possible Causal
Factors
The absence of other possible causal factors means
that the factor or variable being investigated should
be the only possible causal explanation. In store
service may be a cause of sales if we can be sure
that changes in all other factors affecting sales, such
as pricing, advertising, level of distribution, product
quality, competition, were held constant or otherwise
controlled.
Definitions and Concepts
Some basic concepts are as follows.
• Independent variables:
Independent variables are variables or alternatives are
manipulated, and whose effects are measured and
compared. These variables also known as treatments,
may include price levels, package designs, and
advertising themes.
• Test units:
Test units are individuals, organizations, or other entities
whose response to the independent variables or
treatments being examined. Test units may include
consumers, stores, or geographic units.
• Dependent variables:
Dependent variables are the variables that measure the
effect of the independent variables on the test units.
These variables may include sales, profits, and market
shares.
Extraneous variables:
Extraneous variables are all variables other than the
independent variables that affect the response of the test
units. These variables can confound the dependent
variable measures in a way that weakens or invalidates
the results of the experiment. Extraneous variables
include store size, geographical location, and competitive
effort.
• Experiment:
An experiment is formed when the researcher manipulates one or
more independent variables and measures their effect on one or
more dependent variables, while controlling for the effect of
extraneous variables.
• Experimental design:
An experimental design is a set procedures specifying
1. The test unit and how these units are to be divided into
homogeneous subsamples.
2. What independent variables or treatments are to be manipulated.
3. What dependent variables are to be measured, and
4. How the extraneous variables are to be controlled.
Definitions of Symbols
• To facilitate our discussion of extraneous variables and
specific experimental designs, we define a set of symbols
that are now commonly used in business research.
X = the exposure of a group to an independent variable,
treatment, or event, the effect of which to be
determined.
O = the process of observation or measurement of the
dependent variable on the test units or group of units.
R = the random assignment of test units or groups to
separate treatments.
Validity in Experimentation
When conducting an experiment, a researcher has two
goals:
1. Draw valid conclusions about the effects of
independent variables on the study group.
2. Make valid generalizations to a larger population of
interest.
the first goal concerns internal validity, the
second, external validity.
Extraneous Variables
We classify extraneous variables in the following categories:
1. History
2. Maturation
3. Testing
• Main testing effect
• Interactive testing effect
5. Instrumentation
6. Statistical regression
7. Selection bias and
8. Mortality
Controlling Extraneous Variables
• Extraneous variables represent alternative explanation of
experimental results. They pose a series of threat to the
internal and external validity of an experiment. Unless
they are controlled for, they affect the dependent variable
and thus confound results. For this reason they are also
called confounding variables.
There are four ways of controlling extraneous variables:
1. Randomization
2. Matching
3. Statistical control
4. Design control
A Classification of Experimental
Designs
Experimental
Designs
Statistical
Quasi-
Experimental
True
experimental
Preexperimenta
l
A Classification of Experimental
Designs
• Preexperimental designs:
Designs that do not control for extraneous factors by randomization.
• True experimental designs:
Experimental designs distinguished by the fact that the researcher
can randomly assign test units to experimental groups and also
randomly assign treatments to experimental control.
• Quasi-experimental designs:
Designs that apply part of the procedures of true experimentation
but lack full experimental control.
• Statistical:
designs that allow for the statistical control and analysis of
external variables.
Preexperimental Designs
1. One-Shot Case Study
2. One-Group Pretest-Posttest Design
3. Static Group Design
One-Shot Case Study:
A pre experimental design in which a single group of test units is exposed to a
treatment X, and then a single measurement on the dependent variable is
taken.
It is symbolically represented as
X O1
Where, X is a single group of test units is exposed to a treatment.
O1 is a single measurement on the dependent variable is taken.
The one-shot case study is more appropriate for exploratory than for
conclusive research.
One-Group Pretest-Posttest Design:
A pre experimental design in which a group of test units
is measured twice.
It may be symbolized as
O 1 X O 2
There is no control group. First, a pretreatment
measure is taken ( O 1), then the group is exposed to
the treatment (X). Finally a post treatment measure is
taken ( O 2). The treatment effect is computed as
O2 – O1.
Static Group Design:
The static group is a two-group experimental design.
One group, called the experimental group (EG), is
exposed to the treatment, and the other, called control
group (CG). Measurements on both groups are made
only after the treatment, and test units are not assigned
at random.
EG: X O1
CG: O2
The treatment effect would be measured as
O1 –O2.
True experimental Designs
1. Pretest-Posttest Control Design
2. Posttest-Only control Group Design
3. Solomon Four group Design
Pretest-Posttest Control Design:
A true experimental design in which the experimental group is exposed to the
treatment but the control group is not. Pretest and posttest measures are taken
on both groups.
This design is symbolized as:
EG: R O1 X O2
CG: R O3 O4
The treatment effect is measured as
(O2-O1) – (O4-O3)
Posttest-Only control Group Design:
A true experimental design in which the experimental
group is exposed to the treatment but the control group
is not and no pretest measure is taken.
It may be symbolized as
EG: R X O1
CG: R O2
The treatment effect is obtained by
TE = O1 – O2
Solomon Four group Design:
A true experimental design that explicitly controls for
interactive testing effects, in addition to controlling
for all other extraneous variables. This design
overcomes the limitations of the other two research
designs in that it explicitly controls for interactive
testing effect.
This design has practical limitations:
1. It is expensive and time consuming to implement
2. It is not considered further
Quasi-Experimental Designs
A quasi- experimental design results under the following
conditions.
1. Researcher can control when measurements are taken
and on whom they are taken.
2. The researcher lacks control over the scheduling of the
treatments and also is unable to expose test units to
the treatments randomly.
Popular forms of quasi-experimental designs are:
1. Time Series Design
2. Multiple Time Series Design
Time Series Design:
A quasi experimental design that involves periodic
measurements on the dependent variable for a group
of test units. Then, the treatment is administered by
the researcher or occurs naturally. After the
treatment, periodic measurements are continued to
determine the treatment effect.
A time series experiment may be symbolized as
O1 O2 O3 O4 O5 X O6 O7 O8 O9 O10
Multiple Time Series Design:
The multiple time series design is similar to the time
series design except that another group of test units
is added to serve as a control group. Symbolically,
this design may be described as
EG: O1 O2 O3 O4 O5 X O6 O7 O8 O9 O10
CG: O11 O12 O13 O14 O15 X O16 O17 O18 O19
O20
Statistical Designs
Statistical designs consists of series of basic experiments that allow for
statistical control and analysis of external variables. In other words, several
basic experiments are conducted simultaneously. Thus, statistical designs are
influenced by the same sources of invalidity that affect the basic designs
being used. Statistical designs offer the following advantages:
1. The effect of more than one independent variable can be measured.
2. Specific extraneous variables can be statistically controlled.
3. Economical designs can be formulated when each test unit is measured
more than once.
The most common statistical designs are
• Randomized Block Design
• Latin Square Design
• Factorial Design
Randomized Block Design:
A statistical design in which the test units are blocked
on the basis of external variable to ensure that the
various experimental and control groups are matched
closely on that variable.
Latin square Design:
A statistical design that allows for the statistical
control of two noninteracting external variables in
addition to the manipulation of independent variable.
Factorial Design:
A factorial design is used to measure the effects of
two or more independent variables at various levels
and to allow for interactions between variables.
Laboratory Versus Field
Experiments
Laboratory experiment:
An artificial setting for experimentation in which the
researcher constructs the desired conditions.
Field environment:
An experimental environmental location set in actual
market conditions.
Laboratory Versus Field
Experiments
FACTOR LABORATORY FIELD
Environment
Control
Artificial
High
Realistic
Low
Reactive Error
Demand Artifacts
High
High
Low
Low
Internal Validity
External Validity
Time
High
Low
Short
Low
High
Long
Number of units
Ease of implementation
Small
High
Large
Low
cost Low High
Experimental Versus
Nonexperimental Designs
• Causal designs are truly appropriate for inferring
cause-and-effect relationships.
• Although descriptive survey data are often used to
provide evidence of “causal” relationships, these
studies do not meet all the conditions required for
causality.
• descriptive research offers little control over other
possible causal factors.
Limitations of Experimentation
• Time
Experiments can be time consuming, particularly if the researcher
is interested in measuring the long term effects of treatment.
Experiments should lost long enough so that the post treatment
measurements include most or all the effects of the independent
variables.
• Cost
Experiments are often expensive. The requirements of experimental
group, control group, and multiple measurements significantly add
to the cost of research.
• Administration
Experiments can be difficult to administer. It may be impossible to
control for the effects of the extraneous variables, particularly in a
field environment.
193
CLASSIFICATION AND TABULATION
It is the process of arranging data in groups or classes on the basis of common
characteristics such as descriptive or numerical.
• Simple Classification: This means that one attribute is considered and
the universe is divided into two classes. With one class consisting of items
possessing the given attribute and the other class consisting of items which do
not possess the given attribute.
• Class interval Classification: This is more relevant when we use
quantitative data like number of guests, number of spa users, age groups of
tourists, income levels of travelers, daily occupancy and other statistical data.
194
TABULATION
It is the process of summarizing raw data and displaying the same in compact
form for further analysis. It is an orderly arrangement of data in columns and
rows.
Tabulation is essential because:
It conserves space and reduces explanatory and descriptive statement to a
minimum.
It facilitates the process of comparison.
It facilitates the summation of items and the detection of errors and omissions.
It provides the basis for various statistical computations.
195
Tabulation may also be classified as simple and complex tabulation. Simple
tabulation generally results in one-way tables which supply answers to
questions about one characteristic of data only. Complex tabulation usually
results on two-way tables that give information about two interrelated
characteristics of data, three –way tables or still higher order tables known as
manifold tables. Components of Data Tables
The components of data tables are as under:
1.Table Number: Each table should have a specific table number for ease of
access and locating. This number can be readily mentioned anywhere which
serves as a reference and leads us directly to the data mentioned in that
particular table.
196
1. Title: A table must contain a title that clearly tells the readers about the data
it contains, time period of study, place of study and the nature of
classification of data.
2. Head notes: A headnote further aids in the purpose of a title and displays
more information about the table. Generally, headnotes present the units of
data in brackets at the end of a table title.
3. Stubs: These are titles of the rows in a table. Thus a stub display information
about the data contained in a particular row.
4. Caption: A caption is the title of a column in the data table. In fact, it is a
counterpart if a stub and indicates the information contained in a column.
5. Body or field: The body of a table is the content of a table in its entirety.
Each item in a body is known as a ‗cell‘.
6. Footnotes: Footnotes are rarely used. In effect, they supplement the title of
a table if required.
7. Source: When using data obtained from a secondary source, this source has
197
PRESENTATION OF DATA
The various types of data that can be presented are: Textual presentation
Data tables Diagrammatic presentation
1. Time Series Data
2. Bar Charts
3. Combo Charts
4. Pie Charts
5. Tables
6. Geo Map
7. Scorecard
8. Scatter Charts
9. Bullet Charts
10. Area Chart
11. Text & Images
198
PRESENTING AND ANALYZING DATA:
1. The results should be presented such that a progression of arguments is in
support of the study beginning with a statement defining the purpose of
study and subsequently a logical presentation making objectives clear and
related to the aim of study.
2. Bigger objectives should be broken down into smaller ones i.e. define each
objective as per need and outcome. Prepare a list of data to be collected,
the sources of data, form in which data exists and needs to be obtained
and conducting a primary survey for information which does not exist.
3. Form and explain the methodology adapted to carry out a study.
4. Sampling methods should be clear and confirmed for ease of collecting
data that results in efficient and lesser errors in the process.
2. Collect/obtain data from primary or secondary sources.
3. Change the format of data, i.e., table, maps, graphs, etc. in the desired format
4. Sort data through grouping, discarding the extra data and deciding the required form to
make data comprehensible
199
5.Present only the required information and skip the background research to
make your point more clear.
6.Credits and references should either be provided in the end and wherever
obligatory.
7.The presentation methods depend upon the availability of resources and
type of results expected out of the final presentation. PowerPoint, Models,
Paper Charts, Smart Boards, Analytical software e.g. Google analytics etc can
be used to make the presentation effective and crisp.
1. Frame the objectives of the study and make a list of data to be collected Frame the
objectives of the study and make a list of data to be collected and its format.
Collect/obtain data from primary or secondary sources.
Change the format of data, i.e., table, maps, graphs, etc. in the desired format
Sort data through grouping, discarding the extra data and deciding the required form to make

BUSINESS RESEARCH METHODS-DATA COLLECTION METHODS

  • 1.
    Established as perthe Section 2(f) of the UGC Act, 1956 Approved by AICTE, COA and BCI, New Delhi Business Research Methods S c h o o l o f M a n a g e m e n t S t u d i e s
  • 2.
    2 DATA DATA Data can bedefined as a systematic record of a particular quantity. It is the different values of that quantity represented together in a set. It is a collection of facts and figures to be used for a specific purpose such as a survey or analysis. When arranged in an organized form, can be called information.
  • 3.
    3 CONCEPT OF DATACOLLECTION Data collection is the process of gathering and measuring information on variables of interest, in an established systematic fashion that enables one to answer stated research questions, test hypotheses, and evaluate outcomes. The data collection component of research is common to all fields of study including physical and social sciences, humanities, business, etc. While methods vary by discipline, the emphasis on ensuring accurate and honest collection remains the same. The goal for all data collection is to capture quality evidence that then translates to rich data analysis and allows the building of a convincing and credible answer to questions that have been posed.
  • 4.
    4 Regardless of thefield of study or preference for defining data (quantitative, qualitative), accurate data collection is essential to maintaining the integrity of research. Both the selection of appropriate data collection instruments (existing, modified, or newly developed) and clearly delineated instructions for their correct use reduce the likelihood of errors occurring
  • 5.
    What is Data? Data is a existing information /knowledge represented or coded in some form suitable for better usage or processing. Data is a set of values of qualitative or quantitative variables.
  • 6.
    Quantitative Vs QualitativeData • Quantitative data are anything that can be expressed as a number, or quantified. These data may be represented by ordinal, interval or ratio scales and lend themselves to most statistical manipulation. • Qualitative data is a categorical measurement expressed not in terms of numbers, but rather by means of a natural language description. In statistics, it is often used interchangeably with "categorical" data. For example: favorite color = "blue"
  • 7.
    Quantitative Vs QualitativeData • Quantitative and Qualitative data can be gathered from the same data unit depending on whether the variable of interest is numerical or categorical. For example: Data unit Numeric variable = Quantitative data Categorical variable = Qualitative data A person "How many children do you have?" 2 children "In which country were your children born?" India "How much do you earn?" Rs.60,000 p.m. "What is your occupation?" Teacher "How many hours do you work?" 40 hours per week "Do you work full- time or part- time?" Full-time
  • 8.
    Primary and SecondaryData • The task of data collection begins after a research problem has been defined and research design/plan chalked out. • While deciding about the method of data collection to be used for the study, the researcher should keep in mind two types of data viz., primary and secondary.
  • 9.
    Primary and SecondaryData • Primary Data are collected by the researcher. • Secondary data collected by someone else and have already been passed through the statistical process. • A researcher as per requirement of study may decide on use of primary data or secondary data or both. • Both primary and secondary data have their own pros and cons.
  • 10.
    10 KEY DIFFERENCES BETWEENPRIMARY AND SECONDARY DATA 1. The fundamental differences between primary and secondary data are discussed in the following points: 2. The term primary data refers to the data originated by the researcher for the first time. Secondary data is the already existing data, collected by the investigator agencies and organisations earlier. 3. Primary data is a real-time data whereas secondary data is one which relates to the past. 4. Primary data is collected for addressing the problem at hand while secondary data is collected for purposes other than the problem at hand.
  • 11.
    11 1. Primary datacollection is a very involved process. On the other hand, secondary data collection process is rapid and easy. 2. Primary data collection sources include surveys, observations, experiments, questionnaire, personal interview, etc. On the contrary, secondary data collection sources are government publications, websites, books, journal articles, internal records etc. 3. Primary data collection requires a large amount of resources like time, cost and manpower. Conversely, secondary data is relatively inexpensive and quickly available. 4. Primary data is always specific to the researcher’s needs, and he controls the quality of research. In contrast, secondary data is neither specific to the researcher’s need, nor he has control over the data quality.
  • 12.
    Methods of CollectingData • The methods of collecting data mainly refers to collecting primary data. • As secondary data are already available, we have to carefully choose the sources , relevancy of data and reliability.
  • 13.
    Collecting Secondary Data •Sources of secondary data are existing literature, Reports of professional agencies, Departments, Archives, Internet, etc. • While collecting secondary data one has to follow legal procedures required and maintain the academic ethics.
  • 14.
    Methods of Collecting PrimaryData There are several methods of collecting primary data, particularly in surveys and descriptive research. Important ones are- • Observation • Interview • Questionnaire • Schedule • Other Methods
  • 15.
    Observation See what ishappening • traffic patterns • land use patterns • layout of city and rural areas • quality of housing • condition of roads • conditions of buildings • who goes to a health clinic
  • 16.
  • 17.
    Observation is Helpfulwhen: • Need direct information • Trying to understand ongoing behavior • There is physical evidence, products, or outputs than can be observed • Need to provide alternative when other data collection is infeasible or inappropriate
  • 18.
    Types of Observation •Structured and Unstructured • Participant or Non Participant or Disguised • Natural or Contrived • Controlled and Uncontrolled
  • 19.
    Advantages/Disadvantages of Observation Advantages:  Subjectivebias eliminated  Researcher gets current information  Independent of Respondents  Disadvantages:  Expensive, Time consuming  Limited information  Unforeseen factors may influence observation
  • 20.
    Interview • The interviewmethod of collecting data involves presentation of oral-verbal stimuli and reply in terms of oral-verbal responses. • This method can be used through personal interviews or telephone interviews. • Structured, Semi-Structured or Unstructured Interview.
  • 21.
    Interview Types • PersonalInterviews: Interviewer asking questions generally in a face-to-face contact to the other person or persons. Direct personal investigation or Indirect oral investigation. • Focused Interview is meant to focus attention on the given experience of the respondent and its effects. • Clinical Interview is concerned with broad underlying feelings or motivations or with the course of individual’s life experience. • Non-directive Interview is that where the interviewer’s function is simply to encourage the respondent to talk about the given topic with a bare minimum of direct questioning.
  • 22.
    Skill of Interviewer Themain game in interviewing is to facilitate an interviewee’s ability to answer. This involves: • easing respondents into the interview • asking strategic questions • prompting and probing appropriately • keeping it moving • winding it down when the time is right
  • 23.
    Merits/Demerits of Interview Merits: •More and in depth information obtained • Personal Information • Greater Flexibility • Adaptation as per the respondent Demerits: • Bias of Interviewer • Expensive/Time Consuming • Need expertise
  • 24.
    Questionnaire Method • Aquestionnaire is sent (usually by post) to persons concerned with a request to answer the questions and return the questionnaire. • A questionnaire consists of a number of questions printed in a definite order. • The respondents have to answer the questions on their own.
  • 25.
    Steps in questionnaireconstruction • Preparation • Constructing the first draft • Self-evaluation • External evaluation • Revision • Pre-test or Pilot study • Revision • Second pre-testing • Preparing final draft
  • 26.
    Essentials of aGood Questionnaire • Questionnaire should be short and simple • Question arranged in from simple to difficult. • Personal and intimate questions should be left to the end. • Technical term and vague expression should be avoided. • Questions should be answered in yes or no ; multiple choice. • Control question to cross check the information of the responded.
  • 27.
    Advantages of Questionnaire Themerits claimed on behalf of this method are as follows: • 1. There is low cost even when the universe is large and is widely spread geographically. • 2. It is free from the bias of the interviewer; answers are in respondents’ own words. • 3. Respondents have adequate time to give well thought out answers. • 4. Respondents, who are not easily approachable, can also be reached conveniently. • 5. Large samples can be made use of and thus the results can be made more dependable and reliable.
  • 28.
    Disadvantages of questionnaire Themain demerits of this system can also be listed here: • 1. Low rate of return of the duly filled in questionnaires; bias due to no-response is often indeterminate. • 2. It can be used only when respondents are educated and cooperating. • 3. The control over questionnaire may be lost once it is sent. • 4. There is inbuilt inflexibility because of the difficulty of amending the approach once questionnaires have been despatched. • 5. There is also the possibility of ambiguous replies or omission of replies altogether to certain questions; interpretation of omissions is difficult. • 6. It is difficult to know whether willing respondents are truly representative. • 7. This method is likely to be the slowest of all.
  • 29.
    29 1. Main aspectsof a questionnaire: Quite often questionnaire is considered as the heart of a survey operation. Hence it should be very carefully constructed. If it is not properly set up, then the survey is bound to fail. This fact requires us to study the main aspects of a questionnaire viz., the general form, question sequence and question formulation and wording. Researcher should note the following with regard to these three main aspects of a questionnaire:
  • 30.
    30 1. General form:So far as the general form of a questionnaire is concerned, it can either be structured or unstructured questionnaire. Structured questionnaires are those questionnaires in which there are definite, concrete and pre-determined questions. The questions are presented with exactly the same wording and in the same order to all respondents. Resort is taken to this sort of standardisation to ensure that all respondents reply to the same set of questions. The form of the question may be either closed (i.e., of the type ‘yes’ or ‘no’) or open (i.e., inviting free response) but should be stated in advance and not constructed during questioning.
  • 31.
    31 2. Question sequence:In order to make the questionnaire effective and to ensure quality to the replies received, a researcher should pay attention to the question- sequence in preparing the questionnaire. A proper sequence of questions reduces considerably the chances of individual questions being misunderstood. The question-sequence must be clear and smoothly- moving, meaning thereby that the relation of one question to another should be readily apparent to the respondent, with questions that are easiest to answer being put in the beginning.
  • 32.
    32 1. The followingtype of questions should generally be avoided as opening questions in a questionnaire: 2. questions that put too great a strain on the memory or intellect of the respondent; 3. questions of a personal character; 4. questions related to personal wealth, etc.
  • 33.
    Descriptive Research Design: Survey and Observation • In structured data collection, a formal questionnaire is prepared and the questions are asked in a prearranged order. • The structured direct survey, the most popular data- collection method, involves administrating a questionnaire, most questionnaire are fixed alternative questions that require the respondent to select from a predetermined set of responses. • Example: shopping in department stores is fun.1 2 3 4 5
  • 34.
    Advantages of SurveyMethods 1. Questionnaire is simple to administer. 2. The data obtained are reliable because the responses are limited to the alternatives stated. 3. The use of fixed response questions reduce the variability in the results that may be caused by differences in interviewers. 4. Coding, analysis, and interpretation of data are relatively simple.
  • 35.
    Disadvantages of SurveyMethods • Respondents may be unable or unwilling to provide the desired information. For example: Motivational factors • Respondents may be unwilling to respond if the information requested is sensitive or personal. • Structured questions and fixed response alternatives may result in loss of validity for certain types of data such as beliefs and feelings. Wording questions properly is not easy.
  • 36.
    A classification ofSurvey Methods Survey questionnaires may be administrated in four modes. 1. Telephone interviews 2. Personal interviews 3. Mail interviews 4. Electronic interviewing
  • 37.
    Telephone Methods 1. TraditionalTelephone Interviews It involve phoning a sample of respondents and asking them a series of questions. The interviewer uses a paper questionnaire and records the response with pencil. 2. Computer-Assisted Telephone Interviewing CATI from a central location is now more popular than traditional telephone method. It involves a computerized questionnaire administrated to respondents over the telephone. A computerized questionnaire may be generated using a mainframe computer, a minicomputer, or a personal computer. The interviewer sits in front of a computer terminal and wears a miniheadset.
  • 38.
    Personal Methods • Personalinterviewing methods may be categorized as follows. 1. In-home interviews 2. Mall intercept interviews 3. Computer assisted interviewing
  • 39.
    Personal In-home Interviews: Therespondents are interviewed face-to-face in their homes. The interviewer’s task is to contact the respondents, ask questions, and record the responses. In recent years, the use of personal interviews declined due to its high cost. Mall Intercept Personal Interviews: In this method respondents are interpreted while they are shopping in malls and brought to test facilities in the malls. The interviewer administrated a questionnaire as in the home personal survey.
  • 40.
    Computer-Assisted Personal Interviewing (CAPI): Therespondents sits in front of a computer terminal and answer a questionnaire on the computer screen by using a key board or a mouse. There are several user friendly electronic packages that design questions that are easy for respondent to understand. Help screens and courteous error message are also provided.
  • 41.
    Electronic Methods E-mail interviews: Toconduct a e-mail survey, a list of e-mail address is obtained. The survey is written within the body of e-mail message. The e-mails are sent over the internet. E-mail surveys are pure text to represent questionnaires and can be received and responded to by anyone with an e- mail address. E-mail surveys have several limitations. Given the technical limitations of most e-mail systems, questionnaires cannot utilize programmed skip patterns, logic checks, or randomization.
  • 42.
    Collection of DataThrough Schedule • Schedules like questionnaires contain a set of questions. • Researcher /Enumerators appointed collect data through schedules. • Enumerators go to the field, put questions to the respondents and fill the schedules. • Enumerators need to be trained.
  • 43.
    45 CASE STUDY 1. NielsenBuzzMetrics’ (www.nielsenbuzzmetrics.com) BrandPulse suite of products—BrandPulse and BrandPulse Insight—measure consumer- generated media to help companies understand consumer needs, reactions, and issues. 2. BrandPulse helps answer basic and fundamental questions about the volume, spread, and influence of word-of-mouth practices and consumer- to-consumer recommendations on a company or brand. 3. BrandPulse Insight provides the latest information on hot consumer trends, up-to-the-minute data about growing consumer concerns, safety/quality issues, or sudden shifts in consumer opinions. It generates verifiable data about the online consumers who are best suited to influence and shape word-of-mouth behavior.
  • 44.
    46 1. Tide (www.tide.com),one of the most popular consumer brands in the world from P&G, wanted to boost its consumer image for a variety of reasons. 2. Tide’s feedback system needed to spread information and brand data more quickly to receive complete data and identify niche markets. 3. Tide chose BrandPulse suite to redesign its feedback system. Tide is now capturing and assimilating on one platform consumer feedback from all incoming sources, including word of mouth. Tide’s Web site has a whole new look and feel, with consumers receiving instant self-service answers to many of their queries about Tide products and issues. Those requiring follow-up are automatically routed to the appropriate consumer relations representative.
  • 45.
    47 1. Consumers withstain questions are linked to Tide’s “Stain Detective,” and when appropriate, other consumers are offered surveys, study opportunities, coupons, or special promotions. All functions are powered by Nielsen BuzzMetrics’ tools but maintain the look and feel of Tide’s Web site. Such proactive gathering of information helps in the development of new products as well.
  • 46.
    48 1. This isreflected in the number of product Selection of Survey Methods. Depending upon such factors as information requirements, budgetary constraints (time and money), and respondent characteristics, none, one, two, or even all methods may be appropriate. Remember that the various data-collection modes are not mutually exclusive. Rather, they can be employed in a complementary fashion to build on each other’s strengths and compensate for each other’s weaknesses. The researcher can employ these methods in combination and develop creative methods.
  • 47.
    49 1. To illustrate,in a classic project, interviewers distributed the product, self- administered questionnaires, and returned envelopes to respondents. 2. Traditional telephone interviews were used for follow-up. Combining the data-collection modes resulted in telephone cooperation from 97 percent of the respondents. Furthermore, 82 percent of the questionnaires were returned by mail. 3. In the chapter introduction, we illustrated how election polling successfully used telephone and Internet interviewing. However, caution should be exercised when using different methods in the same domestic marketing research project (also called the use of mixed-mode surveys). The method used may affect the responses obtained and hence the responses obtained by different methods may not be comparable. The results of studies examining the effect of survey methods on respondents are not very consistent.
  • 48.
    50 1. The followingdepartment store project example illustrates the selection of a survey mode, whereas the P&G example illustrates the use of a combination of survey methods. unstructured observation Observation that involves a researcher monitoring all relevant phenomena without specifying the details in advance. natural observation Observing behavior as it takes place in the environment. contrived observation The behavior is observed in an artificial environment. improvements Tide has made. 2. P&G had modified this product 22 times in its 21 years of existence. It also makes modifications to cater to market segments such as geographies. For example, a Tide bar was introduced in the Indian market after considering the opinion of its Indian users.33 ■
  • 49.
    Questionnaire Vs. Schedule Questionnaire •Mailed, filled by Respondent • Economical • Non-Response high • Time Consuming • Literate, co-operative respondents • Success depends on quality of questionnaire Schedule • Direct contact , filled by Researcher or Enumerator • Expensive • Non-Response low • Time bound • No such pre condition • Success depends on quality of enumerator
  • 50.
    Some Other Methods •Warranty Cards Post card size cards sent to customers and feedback collected through asking questions. • Distributor or Store Audits are performed by manufacturer/distributor through salesmen. Information so obtained are used to estimate market size, market share, seasonal sales pattern, etc. • Pantry Audits From the observation of pantry of customer to know purchase habit of people ( of which product, what brand, etc.). Questions may be asked at the time of audit.
  • 51.
    Some Other Methods •Consumer Panels Pantry audit approach on a regular basis is known as ‘consumer panel’, where a set of consumers are arranged to come to an understanding to maintain detailed daily records of their consumption and the same is made available to investigator on demands. • Projective techniques developed by psychologists to use projections of respondents for inferring about underlying motives, urges, or intentions which are such that the respondent either resists to reveal them or is unable to figure out himself.
  • 52.
    Some Other Methods •Use of Mechanical Devices Eye Camera is used to record the focus of eyes of a respondent on a specific portion of a sketch or diagram or written material. Psychogalvanometer is used for measuring the extent of body excitement as a result of the visual stimulus. Motion picture camera is used to record movement of consumer at time of purchase. Audiometer is used to know the preferences to TV channels, programmes.
  • 53.
    Some Other Methods •Depth interviews are those interviews that are designed to discover underlying motives and desires and are often used in motivational research. Indirect question or projective technique are used to know the behaviour of respondents. • Content Analysis Analyzing the contents of documentary materials such as books, magazines, newspapers and the contents of all other verbal materials which can be either spoken or printed.
  • 54.
    56 PILOT STUDY PILOTING THEQUESTIONNAIRE The questionnaire before being finalized should be cross checked with peers, managers etc. Thereafter questionnaire must be piloted i.e. it should be tested to see if it is obtaining the results as per objectives or not. This is done by asking people to read it through and see if there are any ambiguities which you have not noticed. They should also be asked to comment about the length, structure and wording of the questionnaire. Alter the questions accordingly.
  • 55.
    57 You can determinethe feasibility of your research design, with a pilot study before you start. This is a preliminary, small-scale “rehearsal” in which you test the methods you plan to use for your research project. You will use the results to guide the methodology of your large-scale investigation. Pilot studies should be performed for both qualitative and quantitative studies. Here, we discuss the importance of the pilot study and how it will save you time, frustration and resources.
  • 56.
    58 Components of aPilot Study Whether your research is a survey in the form of a questionnaire or interview, you want your study to be informative and add value to your research field. Things to consider in your pilot study include: • Sample size and selection. Your data needs to be representative of the target study population. You should use statistical methods to estimate the feasibility of your sample size. • Determine the criteria for a successful pilot study based on the objectives of your study. How will your pilot study address these criteria? • When recruiting subjects or collecting samples ensure that the process is practical and manageable. •
  • 57.
    59 Always test themeasurement instrument. This could be a questionnaire, equipment, or methods used. Is it realistic and workable? How can it be improved? • Data entry and analysis. Run the trial data through your proposed statistical analysis to see whether your proposed analysis is appropriate for your data set. • Create a flow chart of the process.
  • 58.
    60 IMPORTANCE OF PILOTSTUDY IN RESEARCH • Pilot studies should be routinely incorporated into research designs because they: • Help define the research question • Test the proposed study design and process. This could alert you to issues which may negatively affect your project. • Educate yourself on different techniques related to your study. • Determine the feasibility of your study, so you don’t waste resources and time. • Provide preliminary data that you can use to improve your chances for funding and convince stakeholders that you have the necessary skills and expertise to successfully carry out the research.
  • 59.
    Selection of AppropriateMethod of Data Collection  Nature, Scope and Object of enquiry  Availability of Fund  Availability of Time  Degree of Precision Required
  • 60.
    62 SECONDARY DATA Secondary datameans data that are already available i.e., they refer to the data which have already been collected and analysed by someone else. When the researcher utilises secondary data, then he has to look into various sources from where he can obtain them. In this case he is certainly not confronted with the problems that are usually associated with the collection of original data. Secondary data may either be published data or unpublished data.
  • 61.
    63 Sources of SecondaryData While primary data can be collected through questionnaires, depth interview, focus group interviews, case studies, experimentation and observation; The secondary data can be obtained through 1. Internal Sources - These are within the organization 2. External Sources - These are outside the organization
  • 62.
    64 Internal Sources ofData If available, internal secondary data may be obtained with less time, effort and money than the external secondary data. In addition, they may also be more pertinent to the situation at hand since they are from within the organization. The internal sources include 1. Accounting resources- This gives so much information which can be used by the marketing researcher. They give information about internal factors. 2. Sales Force Report- It gives information about the sale of a product. The information provided is of outside the organization. 3. Internal Experts- These are people who are heading the various departments. They can give an idea of how a particular thing is working 4. Miscellaneous Reports- These are what information you are getting from operational reports. If the data available within the organization are unsuitable or inadequate, the
  • 63.
    65 External Sources ofData External Sources are sources which are outside the company in a larger environment. Collection of external data is more difficult because the data have much greater variety and the sources are much more numerous. External data can be divided into following classes. a. Government Publications- Government sources provide an extremely rich pool of data for the researchers. In addition, many of these data are available free of cost on internet websites. There are number of government agencies generating data. These are: 1. Registrar General of India- It is an office which generate demographic data. It includes details of gender, age, occupation etc.
  • 64.
    66 2. Central StatisticalOrganization- This organization publishes the national accounts statistics. It contains estimates of national income for several years, growth rate, and rate of major economic activities. Annual survey of Industries is also published by the CSO. It gives information about the total number of workers employed, production units, material used and value added by the manufacturer. 3. Director General of Commercial Intelligence- This office operates from Kolkata. It gives information about foreign trade i.e. import and export. These figures are provided region-wise and country-wise. 4. Ministry of Commerce and Industries- This ministry through the office of economic advisor provides information on wholesale price index. These indices may be related to a number of sectors like food, fuel, power, food grains etc. It also generates All India Consumer Price Index numbers for industrial workers, urban, non manual employees and cultural labourers.
  • 65.
    67 5. Planning Commission-It provides the basic statistics of Indian Economy. 6. Reserve Bank of India- This provides information on Banking Savings and investment. RBI also prepares currency and finance reports. 7. Labour Bureau- It provides information on skilled, unskilled, white collared jobs etc. 8. National Sample Survey- This is done by the Ministry of Planning and it provides social, economic, demographic, industrial and agricultural statistics. 9. Department of Economic Affairs- It conducts economic survey and it also generates information on income, consumption, expenditure, investment, savings and foreign trade.
  • 66.
    68 10. State StatisticalAbstract- This gives information on various types of activities related to the state like - commercial activities, education, occupation etc. b. Non Government Publications- These includes publications of various industrial and trade associations, such as 1. The Indian Cotton Mill Association 2. Various chambers of commerce 3. The Bombay Stock Exchange (it publishes a directory containing financial accounts, key profitability and other relevant matter) 4. Various Associations of Press Media.
  • 67.
    69 5. Export PromotionCouncil. 6. Confederation of Indian Industries ( CII ) 7. Small Industries Development Board of India 8. Different Mills like - Woolen mills, Textile mills etc The only disadvantage of the above sources is that the data may be biased. They are likely to colour their negative points.
  • 68.
    70 c. Syndicate Services-These services are provided by certain organizations which collect and tabulate the marketing information on a regular basis for a number of clients who are the subscribers to these services. So the services are designed in such a way that the information suits the subscriber. These services are useful in television viewing, movement of consumer goods etc. These syndicate services provide information data from both household as well as institution. In collecting data from household they use three approaches 1. Survey- They conduct surveys regarding - lifestyle, sociographic, general topics. 2. Mail Diary Panel- It may be related to 2 fields - Purchase and Media. 3. Electronic Scanner Services- These are used to generate data on volume. They collect data for Institutions from
  • 69.
    71 4. Whole sellers 5.Retailers, and 6. Industrial Firms Various syndicate services are Operations Research Group (ORG) and The Indian Marketing Research Bureau (IMRB). Importance of Syndicate Services Syndicate services are becoming popular since the constraints of decision making are changing and we need more of specific decision-making in the light of changing environment. Also Syndicate services are able to provide information to the industries at a low unit cost.
  • 70.
    72 Disadvantages of SyndicateServices The information provided is not exclusive. A number of research agencies provide customized services which suits the requirement of each individual organization. d. International Organization- These includes 1. The International Labour Organization (ILO)- It publishes data on the total and active population, employment, unemployment, wages and consumer prices 2. The Organization for Economic Co-operation and development (OECD)- It publishes data on foreign trade, industry, food, transport, and science and technology. 3. The International Monetary Fund (IMA)- It publishes reports on national and international foreign exchange regulations.
  • 71.
    73 SECONDARY DATA, MUSTSEE THAT THEY POSSESS FOLLOWING CHARACTERISTICS: 1. Reliability of data: The reliability can be tested by finding out such things about the said data: (a) Who collected the data? (b) What were the sources of data? (c) Were they collected by using proper methods (d) At what time were they collected?(e) Was there any bias of the compiler? (t) What level of accuracy was desired? Was it achieved ? 2. Suitability of data: The data that are suitable for one enquiry may not necessarily be found suitable in another enquiry. Hence, if the available data are found to be unsuitable, they should not be used by the researcher.
  • 72.
    74 In this context,the researcher must very carefully scrutinise the definition of various terms and units of collection used at the time of collecting the data from the primary source originally. Similarly, the object, scope and nature of the original enquiry must also be studied. If the researcher finds differences in these, the data will remain unsuitable for the present enquiry and should not be used.
  • 73.
    75 3. Adequacy ofdata: If the level of accuracy achieved in data is found inadequate for the purpose of the present enquiry, they will be considered as inadequate and should not be used by the researcher. The data will also be considered inadequate, if they are related to an area which may be either narrower or wider than the area of the present enquiry.
  • 74.
    76 From all thiswe can say that it is very risky to use the already available data. The already available data should be used by the researcher only when he finds them reliable, suitable and adequate. But he should not blindly discard the use of such data if they are readily available from authentic sources and are also suitable and adequate for in that case it will not be economical to spend time and energy in field surveys for collecting information. At times, there may be wealth of usable information in the already available data which must be used by an intelligent researcher but with due precaution.
  • 75.
    Precautions in DataCollection • The data must be relevant to the research problem. • It should be collected through formal or standardized research tools. • The data should be such as these can be subjected to statistical treatment easily. • The data should have minimum measurement error.
  • 76.
    78 PROCESSING OF DATA Processingand analyzing data involves a number of closely related operations which are performed with the purpose of summarizing the collected data and organizing these in a manner that they answer the research questions (objectives). It includes 1.Editing 2.Coding 3.Tabulation
  • 77.
    79 EDITING OF DATA Itis a process of examining the collected raw data to detect errors and omissions and to correct these when possible. It is also defined as the process relating to the review and adjustment of collected survey data with an aim to control the quality of the collected data. Data editing can be performed manually, with the assistance of a computer or using a combination of both the methods. Data editing is crucial as it helps in take full advantage of the available data to be converted into useful data, ensuring that the errors arising during collection, entry, assimilation are omitted or minimized. It also assures that the consistency is coherent and consistent, since such characteristics have a constructive impact on the final analysis and outcomes. 1. 1.
  • 78.
    80 1. Editing: Editingof data is a process of examining the collected raw data (specially in surveys) to detect errors and omissions and to correct these when possible. 2. As a matter of fact, editing involves a careful scrutiny of the completed questionnaires and/or schedules. 3. Editing is done to assure that the data are accurate, consistent with other facts gathered, uniformly entered, as completed as possible and have been well arranged to facilitate coding and tabulation.
  • 79.
    81 With regard topoints or stages at which editing should be done, one can talk of field editing and central editing. 1.Field editing consists in the review of the reporting forms by the investigator for completing (translating or rewriting) what the latter has written in abbreviated and/or in illegible form 1 at the time of recording the respondents’ responses. This type of editing is necessary in view of the fact that individual writing styles often can be difficult for others to decipher. This sort of editing should be done as soon as possible after the interview, preferably on the very day or on the next day. While doing field editing, the investigator must restrain himself and must not correct errors of omission by simply guessing what the informant would have said if the question had been asked. 1.
  • 80.
    82 1. Central editingshould take place when all forms or schedules have been completed and returned to the office. This type of editing implies that all forms should get a thorough editing by a single editor in a small study and by a team of editors in case of a large inquiry. 2. Editor(s) may correct the obvious errors such as an entry in the wrong place, entry recorded in months when it should have been recorded in weeks, and the like. In case of inappropriate on missing replies, the editor can sometimes determine the proper answer by reviewing the other information in the schedule.
  • 81.
    83 1. At times,the respondent can be contacted for clarification. The editor must strike out the answer if the same is inappropriate and he has no basis for determining the correct answer or the response. In such a case an editing entry of ‘no answer’ is called for. 2. All the wrong replies, which are quite obvious, must be dropped from the final results, especially in the context of mail surveys.
  • 82.
    84 CODING OF DATA 1.The purpose of data coding is to bring out the essence and meaning of the data that has been collected from the respondents. In order to make sense of the data, it must be analyzed. 2. Analysis begins with the labeling of data as to its source, how it was collected, the information it contains, etc. When we have received hundreds of questionnaires, forma and formats containing the data it seems impossible to figure out any outcomes just by looking at the quantum. 3. E.g. if the Hotel guest‘s feedback is received in letter forms with no specific format it would be nearly impossible to assess the satisfaction levels, major complaint areas or just finding out who has been recommended by most of the guests as the best employee at the hotel.
  • 83.
    85 1. Coding facilitatesthe researcher to reduce the bulk od information and data to a form that is easily understandable and can be interpreted soon either manually or through software programming. 2. For example, the injury rate at different levels of intensive physical labor demanding operations in various hotels in the city may not be sorted under name but each of the hotels can be assigned a numeric or alphabetical code. The content analysis computer programs help researchers to code textual data for qualitative or quantitative analysis.
  • 84.
    86 CLASSIFICATION AND TABULATION 1.It is the process of arranging data in groups or classes on the basis of common characteristics such as descriptive or numerical. Most research studies result in a large volume of raw data which must be reduced into homogeneous groups if we are to get meaningful relationships. This fact necessitates classification of data which happens to be the process of arranging data in groups or classes on the basis of common characteristics. 2. Data having a common characteristic are placed in one class and in this way the entire data get divided into a number of groups or classes. Classification can be one of the following two types, depending upon the nature of the phenomenon involved:
  • 85.
    87 1. (a) Classificationaccording to attributes: As stated above, data are classified on the basis of common characteristics which can either be descriptive (such as literacy, sex, honesty, etc.) or numerical (such as weight, height, income, etc.). Descriptive characteristics refer to qualitative phenomenon which cannot be measured quantitatively; only their presence or absence in an individual item can be noticed. 2. Data obtained this way on the basis of certain attributes are known as statistics of attributes and their classification is said to be classification according to attributes. Such classification can be simple classification or manifold classification. 3. In simple classification we consider only one attribute and divide the universe into two classes—one class consisting of items possessing the given attribute and the other class consisting of items which do not possess the given attribute.
  • 86.
    88 1. But inmanifold classification we consider two or more attributes simultaneously, and divide that data into a number of classes (total number of classes of final order is given by 2n, where n = number of attributes considered).* Whenever data are classified according to attributes, the researcher must see that the attributes are defined in such a manner that there is least possibility of any doubt/ambiguity concerning the said attributes.
  • 87.
    89 (b) Classification accordingto class-intervals: Unlike descriptive characteristics, the numerical characteristics refer to quantitative phenomenon which can be measured through some statistical units. Data relating to income, production, age, weight, etc. come under this category. Such data are known as statistics of variables and are classified on the basis of class intervals.
  • 88.
    90 1. CLASSIFICATION ACCORDINGTO THE CLASS INTERVAL USUALLY INVOLVES THE FOLLOWING THREE MAIN PROBLEMS: 2. 1. Number of Classes. 2. How to select class limits. 3. How to determine the frequency of each class
  • 89.
    91 1. TABULATION 2. Itis the process of summarizing raw data and displaying the same in compact form for further analysis. It is an orderly arrangement of data in columns and rows.The mass of data collected has to be arranged in some kind of concise and logical order. Tabulation summarizes the raw data and displays data in form of some statistical tables. Tabulation is an orderly arrangement of data in rows and columns.
  • 90.
    92 OBJECTIVE OF TABULATION: 1.Conserves space & minimizes explanation and descriptive statements. 2. Facilitates process of comparison and summarization. 3. Facilitates detection of errors and omissions. 4. Establish the basis of various statistical computations.
  • 91.
    93 BASIC PRINCIPLES OFTABULATION: 1. Tables should be clear, concise & adequately titled. 2. Every table should be distinctly numbered for easy reference. 3. Column headings & row headings of the table should be clear & brief. 4. Units of measurement should be specified at appropriate places. 5. Explanatory footnotes concerning the table should be placed at appropriate places. 6. Source of information of data should be clearly indicated. 7. The columns & rows should be clearly separated with dark lines
  • 92.
    94 8. Demarcation shouldalso be made between data of one class and that of another. 9. Comparable data should be put side by side. 10. The figures in percentage should be approximated before tabulation. 11. The alignment of the figures, symbols etc. should be properly aligned and adequately spaced to enhance the readability of the same. 12. Abbreviations should be avoided. Tabulation is essential because: • It conserves space and reduces explanatory and descriptive statement to a minimum. •
  • 93.
    95 1. It facilitatesthe process of comparison. 2. • It facilitates the summation of items and the detection of errors and omissions. 3. • It provides the basis for various statistical computations.
  • 94.
    96 1. Tabulation mayalso be classified as simple and complex tabulation. Simple tabulation generally results in one-way tables which supply answers to questions about one characteristic of data only. Complex tabulation usually results on two-way tables that give information about two interrelated characteristics of data, three –way tables or still higher order tables known as manifold tables. Components of Data Tables 2. The components of data tables are as under: 3. Table Number: Each table should have a specific table number for ease of access and locating. This number can be readily mentioned anywhere which serves as a reference and leads us directly to the data mentioned in that particular table.
  • 95.
    97 1. Title: Atable must contain a title that clearly tells the readers about the data it contains, time period of study, place of study and the nature of classification of data. 2. Head notes: A headnote further aids in the purpose of a title and displays more information about the table. Generally, headnotes present the units of data in brackets at the end of a table title. 3. Stubs: These are titles of the rows in a table. Thus a stub display information about the data contained in a particular row. 4. Caption: A caption is the title of a column in the data table. In fact, it is a counterpart if a stub and indicates the information contained in a column. 5. Body or field: The body of a table is the content of a table in its entirety. Each item in a body is known as a ‗cell‘.
  • 96.
    98 1. Scorecard 2. •Scatter Charts 3. • Bullet Charts 4. • Area Chart 5. • Text & Images 6. Presenting and Analyzing data: 7. 1. Frame the objectives of the study and make a list of data to be collected and its format. 8. 2. Collect/obtain data from primary or secondary sources. 9. 3. Change the format of data, i.e., table, maps, graphs, etc. in the desired format
  • 97.
    99 1. PRESENTATION OFDATA 2. The various types of data that can be presented are: • Textual presentation • Data tables • Diagrammatic presentation 3. • Time Series Data 4. • Bar Charts 5. • Combo Charts 6. • Pie Charts 7. • Tables 8. • Geo Map 9. •
  • 98.
    Precautions in DataCollection • The data must be tenable for the verification of the hypotheses. • The data should be collected through objective procedure. • The data should be accurate and precise. • The data should be reliable and valid • The data should be complete in itself and also comprehensive in nature.
  • 99.
  • 100.
    Research Design • Aresearch design is a framework or blueprint for conducting the business research project. It details procedures are necessary for obtaining the information needed to structure and/or solve research problems. Although a broad approach to the problem has already been developed, the research design specifies the details – the nuts and bolts of implementing the project.
  • 101.
    Research Design • Aresearch design involves the following components, or tasks: 1. Define the information needed 2. Design the exploratory, descriptive, and/or causal phases of research 3. Specify the measurement and scaling procedures 4. Construct and pretest a questionnaire 5. Specify the sampling process and sample size 6. Develop a plan of data analysis
  • 102.
    Research design: classification •Research designs may be broadly classified into exploratory and conclusive. • The primary objective of exploratory research is to provide insights into, and an understanding of, the problem confronting the researcher. Exploratory research is used in cases when you must define the problem more precisely, identify the relevant courses of action, or gain additional insights before an approach can be developed. The information needed is loosely defined at this stage, and the research process that is adopted is flexible and unstructured. • Exploratory research should be regarded as tentative or as input to further research. Typically, such research is followed by further exploratory or conclusive research.
  • 103.
    Research design: classification •The insight gained from exploratory research might be verified or quantified by conclusive research. The objective of conclusive research is to test specific hypothesis and examine specific relationships. This requires that researcher clearly specify the information needed. Conclusive research is typically more formal and structured than exploratory research. It is based on large, representative samples, and the data obtained are subjected to quantitative analysis. The findings from this research are considered to be conclusive in nature in that they are used as input into managerial decision making.
  • 104.
  • 105.
    Exploratory Research • Theobjective of exploratory research is to express or search through a problem or situation to provide insights and understanding. Exploratory research could be used for any of the following purposes. 1. Formulate a problem or define a problem more precisely. 2. Identify alternative course of action. 3. Develop hypothesis. 4. Isolate key variables and relationship for further examination. 5. Gain insights for developing an approach to the problem. 6. Establish priorities for further research.
  • 106.
    Exploratory Research • Theuse of exploratory research to identify the social causes. As a result, the following causes were identified as salient: childcare, drug abuse, public education, hunger, crime, environment, medical research, poverty. In general, it is meaningful in any situation where the researcher does not have enough understanding to proceed with the research project.
  • 107.
    Exploratory Research • Exploratoryresearch is characterized by flexibility and versatility with respects to methods because formal research protocols and procedures are not employed. It rarely involves structured questionnaires, large samples, and probability sampling plans. • Exploratory research can greatly benefit from use of following methods. 1. Survey of exports 2. Pilot surveys 3. Secondary data analyzed in a qualitative way 4. Qualitative research Example: the department store project, which employed the following types of studies. • To identify the relevant demographic and psychographic factors • Interviews with retailing experts to determine trends • A comparative analysis • Focus groups.
  • 108.
    Exploratory Descriptive Causal objective Discover ideasand insights Describe market characteristics Determine cause and effect relationships. Characteristi cs Flexible Versatile Often the front end of total research design Marked by the prior formulation of specific hypothesis Preplanned and structured design Manipulation of one or more independent variables Control of other mediating variables Methods Expert surveys Pilot surveys Secondary data Qualitative research Secondary data Surveys Panels Observational and other data Experiments A COMPARISION OF BASIC RESEARCH DESIGNS
  • 109.
    Descriptive Research • Atype of conclusive research that has its major objective the describing of something – usually market characteristics or functions. • Descriptive research is conducted for the following reasons. 1. To describe the characteristics of relevant groups 2. To estimate the percentage of units in a specified population exhibiting a certain behavior. 3. To determine the perception of product characteristics 4. To determine the degree to which marketing variables are associated 5. To make specific predictions
  • 110.
    • A descriptivedesign requires a clear specification of the who, what, when, where, why, and way of research. • Examples of descriptive studies: o Market studies o Market share studies o Sale analysis studies o Image studies o Product usage studies o Distribution studies o Pricing studies o Advertising studies Secondary data analyzed in a quantitative methods are • Surveys • Panels • Observational and other data
  • 111.
    Causal Research Causal researchis used to obtain evidence of cause- and-effect relationships. Researchers continually make decisions based on assumed causal relationships. These assumptions may not be justifiable and the validity of causal relationship should be examined via formal research. For example, the common assumption that a decrease in price will lead to increased sales and market shares does not hold in certain competitive environments. Causal research is appropriate for the following purposes: 1. To understand which variables are the cause ( independent variables) and which variables are the effect (dependent variables) of a phenomenon. 2. To determine the nature of the relationship between the causal variables and the effect to be predicted.
  • 112.
    Causal Research • Likedescriptive research, causal research requires a planned and structured design. Although descriptive research can determine the degree of association between variables, it is not appropriate for examining causal relationships. Such an examination requires causal design. In which the causal, or independent, variables are manipulated in a relatively controlled environment. A relatively controlled environment is one in which the other variables that may affect the dependent variable are controlled or checked as much as possible. The effect of this manipulation on one or more dependent variables is then measured to infer causality. The main method of causal research is experimentation.
  • 113.
    Relationships among Exploratory, Descriptive,and Causal research The following general guidelines for choosing research designs. 1. When little is known about the problem situation, it is desirable to begin with exploratory research. Exploratory research is appropriate when the problems needs to be defined more precisely, alternative course of action identified, research hypothesis developed, and key variables are isolated and classified as dependent or independent. 2. Exploratory research is the initial step in the overall research design framework. It should, in most instances, be followed by descriptive or causal research. 3. It is not necessary to begin every research design with exploratory research. It depends upon the precision with which the problem has been defined and the researcher’s degree of certainty about the approach to the problem. 4. Although exploratory research is the initial step, it need not be exploratory research may follow descriptive or causal research.
  • 114.
    Exploratory Research Design: SecondaryData Primary versus Secondary data: Primary data are originated by a researcher for the specific purpose of addressing the problem at hand. Obtaining primary data can be expensive and time consuming. Secondary data are data that have already been collected for purposes other than the problem at the hand. These data can be located quickly and inexpensively.
  • 115.
    A comparison ofPrimary and Secondary data Primary Data Secondary Data Collection purpose For the problem at hand For other problems Collection Process Very involved Rapid and easy Collection cost High Relatively low Collection time long Short
  • 116.
    Advantages and Usesof Secondary Data • Secondary data offer several advantages over primary data. Secondary data are easily accessible, relatively inexpensive and quickly obtained. • Secondary data can help to: 1. Identify the problem 2. Better define the problem 3. Develop an approach to the problem 4. Formulate an appropriate research design 5. Answer certain research questions and test some hypothesis 6. Interpret primary data more insightfully
  • 117.
    Disadvantages of SecondaryData • Secondary data usefulness to the current problem may be limited in several important ways: 1. Relevance and accuracy 2. The objectives, nature, and method used to collect the secondary data may not be appropriate the present situation 3. Secondary data may be lacking in accuracy, or they may not be completely current or dependent. 4. Important to evaluation
  • 118.
    Criteria for EvaluatingSecondary Data • The quality of secondary data should be routinely evaluated, using the following criteria. 1. Specifications/Methodology 2. Error/Accuracy 3. Currency 4. Objective 5. Nature 6. dependability
  • 119.
    Classification of SecondaryData Secondary Data External Internal Computerize d databases Published materials Requires further processing Ready to use Syndicated services
  • 120.
    Internal Data andExternal Data • Internal data are those generated within the organization for which the research being conducted. The information may be available in ready to use format, such as information routinely supplied by the management decision support system. These data may exist within the organization but may require considerable processing before they are useful to manager. • External data's are those generated by sources outside the organization. These data may exist in the form of published material, online databases, or information made available by syndicate services.
  • 121.
    Internal Secondary Data •Internal sources should be the starting point in the search for secondary data. Because most organizations have a wealth of in-house information, some data may be readily available and provide useful insights. • Secondary internal data have two significant advantages. They are easily available and inexpensive. Database Marketing: Database marketing involves the use of computers to capture and track customer profile and purchase details. This secondary information serves as the foundation of internal source.
  • 122.
    Internal Secondary Data Typeof individual/Household level data available from syndicate firms I. Demographic Data • Identification-name, address, telephone • Sex • Marital status • Names of family members • Age • Income • Occupation • Number of children present • Home ownership • Length of residence • Number and make of cars owned II. Psychographic Lifestyle Data • Interest in golf • Interest in snow skiing • Interest in book reading • Interest in running • Interest in bicycling • Interest in electronics
  • 123.
    Published External Secondary Sources Published SecondaryData Government Sources General Business Sources Census Data Statistical Data Indexes Guides Other Government publications Directorie s
  • 124.
    Computerized Databases • Computerdatabases consists of information that has been made available in computer reliable form for electronic distribution. • Computerized databases may be classified as online, internet, or offline.
  • 125.
  • 126.
    Syndicated Sources ofSecondary Data • Syndicated sources, also referred to as syndicated services, companies that collect and sell common pools of data of known commercial value, designed to serve information needs shared by a number of clients. These data are not collected for the purpose of business research problems specific to individual clients, but the data and reports supplied to clients companies can be personalized to fit for particular needs.
  • 127.
    A Classification ofSyndicated Services Unit of Measurement Institutions Households/ consumers
  • 128.
    Exploratory Research Design: QualitativeResearch Qualitative Research Procedures Indirect Direct Projective Techniques Expressive Techniques Construction Techniques Completion Techniques Associative Techniques
  • 129.
    Exploratory Research Design: QualitativeResearch Projective Techniques: Both focus groups and depth interviews are direct approaches in which the true purpose of the research is disclosed to the respondents or is otherwise obvious to them. A projective technique is an unstructured and indirect form of questioning encourages the respondents to project their underlying motivations, beliefs, and attitudes or feelings regarding the issues of concern. In projective techniques, respondents are asked to interpret the behavior of others rather than describe their own behavior.
  • 130.
    • Association techniques: Inassociation techniques, an individual is presented with a stimulus and asked to respond with the first thing that comes to mind. Word association is the best known of these techniques. In word association, respondents are presented with a list of words, one at a time, and asked to respond to each with the first word that comes to mind. The words of interest, called test words, are interspersed throughout the list. For example, in the department store study, some of the test words might be: location, parking, shopping, quality and price. Responses are analyzed by calculating: 1. The frequency with which any word is given as a response. 2. The amount of time that elapses before a response given. 3. The number of respondents who do not respond at all to a test word within a reasonable period of time.
  • 131.
    Completion Techniques • Incompletion techniques, the respondent is asked to complete an incomplete stimulus situation. Common completion techniques in research situation are sentence completion and story completion. Sentence Completion: It is similar to word association. Respondents are given incomplete sentences and asked to complete them. A person who shops at lifestyle is ____________ When I think of shopping in a department store I______
  • 132.
    Completion Techniques Story Completion: Aprojective technique in which the respondents are provided with part of a story and required to give the conclusion in their own words. The respondents completion of this story will reveal their underlying feelings and emotions.
  • 133.
    Construction Techniques Construction techniquesare closely related to the completion techniques. Construction techniques require the respondent to construct a response in the form of a story, dialogue, or description. In a construction technique, the researcher provides less initial structure to the respondent than in a completion technique. The two main construction techniques are 1. Picture Response 2. Cartoons
  • 134.
    Construction Techniques 1. PictureResponse Technique: A projective techniques can be traced to the Thematic Appreciation Test (TAT), which consists of a series of pictures of ordinary as well as unusual events. In some of these pictures, the persons or objects are clearly depicted, while in others they are relatively vague. The respondent is asked to tell stories about these pictures. The respondent’s interpretation of the picture gives indications of that individual’s personality. For example, an individual may be characterized by impulsive, creative, unimaginative and so on.
  • 135.
    2. Cartoons In cartoontests, cartoon characteristics are shown in specific situation related to the problem. The respondents are asked to indicate what one cartoon character might say in response to the comments of another character.
  • 136.
    Expressive Techniques • Inexpressive techniques, respondents are presented with a verbal or visual situation and asked to relate the feelings and attitudes of other people to the situation. The respondents express not their own feelings or attitudes, but those of others. The two main expressive techniques are role playing and third-person technique. Role Playing: In role playing, respondents are asked to play the role or assume the behavior of someone else. The researcher assumes that the respondents will project their own feelings into the role. These can be then uncovered by analyzing the responses. Third-Person Techniques: In third-person technique, the respondent is presented with a verbal or visual situation and asked to relate the beliefs and attitudes of a third person rather than directly expressing personal beliefs and attitudes. This third person may be a friend, neighbor, colleague, or a typical person. Asking the individual to respond in the third person reduces the social pressure to give an acceptable answer.
  • 137.
    Advantages of Projective Techniques 1.Projective techniques can increase the validity of responses by disguising the purpose. 2. It avoids the issues to be addressed personal, sensitive, or subject to strong social norms. 3. In the unstructured direct technique, they may elicit responses that subjects would be un willing or unable to give if they knew the purpose of the study. 4. These techniques are also helpful when underlying motivations, beliefs, and attitudes are opening at a subconscious level.
  • 138.
    Disadvantages of Projective Techniques •Projective techniques suffer from many of the disadvantages of unstructured direct techniques, but to greater extent. 1. These techniques generally require personal interviews with highly trained interviewers. 2. Skilled interprets are also required to analyze the responses. Hence they tend to be expensive. 3. There is serious risk of interpretation bias. Making the analysis and interpretation difficult and subjective.
  • 139.
    Applications of projective techniques 1.Projective techniques should be used because the required information cannot be accurately obtained by direct method. 2. Projective techniques should be used for exploratory research to gain initial insights and understanding. 3. Given their complexity, projective techniques should not be used naively.
  • 140.
    Criteria FOCUS GROUPS DEPTH INTERVIEWS PROJECTIVE TECHNIQUES Degree ofstructure Relatively high Relatively medium Relatively low Probing of individual respondents Low High medium Moderator bias Relatively medium Relatively high Relatively low Interpretation bias Relatively low Relatively medium Relatively high Uncovering subconscious information low Medium to high high Discovering innovation information high Medium Low Obtaining sensitive low Medium high A comparison of focus groups, depth interviews, and projective techniques
  • 141.
    Descriptive Research Design: Survey and Observation Survey Methods : The survey method involves a structured questionnaire given to respondents and design to elicit specific information. Respondents are asked a variety of questions regarding their behavior, intentions, demographic and lifestyle characteristics. Structured here refer to the degree of data collection process.
  • 142.
    Descriptive Research Design: Survey and Observation • In structured data collection, a formal questionnaire is prepared and the questions are asked in a prearranged order. • The structured direct survey, the most popular data- collection method, involves administrating a questionnaire, most questionnaire are fixed alternative questions that require the respondent to select from a predetermined set of responses. • Example: shopping in department stores is fun.1 2 3 4 5
  • 143.
    Advantages of SurveyMethods 1. Questionnaire is simple to administer. 2. The data obtained are reliable because the responses are limited to the alternatives stated. 3. The use of fixed response questions reduce the variability in the results that may be caused by differences in interviewers. 4. Coding, analysis, and interpretation of data are relatively simple.
  • 144.
    Disadvantages of SurveyMethods • Respondents may be unable or unwilling to provide the desired information. For example: Motivational factors • Respondents may be unwilling to respond if the information requested is sensitive or personal. • Structured questions and fixed response alternatives may result in loss of validity for certain types of data such as beliefs and feelings. Wording questions properly is not easy.
  • 145.
    A classification ofSurvey Methods Survey questionnaires may be administrated in four modes. 1. Telephone interviews 2. Personal interviews 3. Mail interviews 4. Electronic interviewing
  • 146.
    Telephone Methods 1. TraditionalTelephone Interviews It involve phoning a sample of respondents and asking them a series of questions. The interviewer uses a paper questionnaire and records the response with pencil. 2. Computer-Assisted Telephone Interviewing CATI from a central location is now more popular than traditional telephone method. It involves a computerized questionnaire administrated to respondents over the telephone. A computerized questionnaire may be generated using a mainframe computer, a minicomputer, or a personal computer. The interviewer sits in front of a computer terminal and wears a miniheadset.
  • 147.
    Personal Methods • Personalinterviewing methods may be categorized as follows. 1. In-home interviews 2. Mall intercept interviews 3. Computer assisted interviewing
  • 148.
    Personal In-home Interviews: Therespondents are interviewed face-to-face in their homes. The interviewer’s task is to contact the respondents, ask questions, and record the responses. In recent years, the use of personal interviews declined due to its high cost. Mall Intercept Personal Interviews: In this method respondents are interpreted while they are shopping in malls and brought to test facilities in the malls. The interviewer administrated a questionnaire as in the home personal survey.
  • 149.
    Computer-Assisted Personal Interviewing (CAPI): Therespondents sits in front of a computer terminal and answer a questionnaire on the computer screen by using a key board or a mouse. There are several user friendly electronic packages that design questions that are easy for respondent to understand. Help screens and courteous error message are also provided.
  • 150.
    Mail Methods Mail Interviews: Inthe traditional mail interview, questionnaire are mailed to preselected potential respondents. A typical mail interview package consists of the outgoing envelope, cover letter questionnaire, return envelope and possibly an incentive. The respondents complete and return the questionnaires. There is no verbal interaction between the researcher and respondent. Mail Panels: A mail panel consists of a large, nationally representative sample of households that have agreed to participate in periodic mail questionnaires and product tests. The house holds are compensate with various incentives. Data on the panel members is updated every year. Because of the panel members commitment, the response rates can approach 80 percent.
  • 151.
    Electronic Methods E-mail interviews: Toconduct a e-mail survey, a list of e-mail address is obtained. The survey is written within the body of e-mail message. The e-mails are sent over the internet. E-mail surveys are pure text to represent questionnaires and can be received and responded to by anyone with an e- mail address. E-mail surveys have several limitations. Given the technical limitations of most e-mail systems, questionnaires cannot utilize programmed skip patterns, logic checks, or randomization.
  • 152.
    Electronic Methods Internet Interviews: Incontrast to e-mail surveys, internet or web surveys use hypertext markup language (HTML). The language of the web site. Respondents may be recruited over the internet from potential respondent databases maintained by the business research firm or they can be recruited by conventional methods. For web surveys that recruit respondents who are browsing or by placing banner ads, there is inherent self-selection bias.
  • 153.
    A Comparative Evaluationof Survey Methods 1. Flexibility of Data Collection 2. Diversity of questions 3. Use of physical stimuli 4. Sample control 5. Control of data – collection environment 6. Control of field force 7. Quantity of data 8. Response rate 9. Perceived anonymity of the respondent 10. Social desirability 11. Obtaining sensitive information 12. Potential for interviewer bias 13. Speed 14. cost
  • 154.
    Observation Methods • Observationmethods are the second type of methodology used in descriptive research. Observation involves recording the behavioral patterns of people, objects, and events in a systematic manner to obtain information about the phenomenon of interest. • Observation methods may be classified as follows. 1. Structured Versus Unstructured Observation 2. Disguised Versus Undisguised Observation 3. Natural Versus Contrived Observation
  • 155.
    A Classification ofObservation Methods Observation Methods Trace Analysis Contest Analysis Audit Mechanical Observation Personal Observation
  • 156.
    A Comparative Evaluationof Observation Methods • Degree of structure • Degree of disguise • Ability to observe in natural setting • Observation bias • Analysis bias • General remarks
  • 157.
    A Comparison ofSurvey and Observation Methods Relative disadvantages of observation: 1. Measurement of actual behavior 2. Certain data can be collected only by observation. The respondent is unaware of or unable to communicate. For Example: babies at playground. Relative Disadvantages of observation: 1. Selective perception can bias the data 2. Observations methods may be unethical 3. Observation behavior may not be determined because little is known about the underlying motives, beliefs, attitudes and preferences.
  • 158.
    Causal Research Design: Experimentation Concept of causality: When the occurrence of X increases the probability of the occurrence of Y. Experimentation is commonly used to infer causal relationships. The concept of causality is complex. “causality” means something very different to average person on the street than to a scientist. A statement such as X causes Y will have different meaning to an ordinary person and to a scientist.
  • 159.
    Concept of causality: Ordinarymeaning Scientific Meaning • X is the only cause of Y • X must always lead to Y • ( X is a deterministic cause of Y) • It is possible to prove that X is a cause of Y. • X is only one of a number of possible cause of Y. • The occurrence of X makes the occurrence of Y more probable. • We can never prove that X is cause of Y. • At best, we can infer that X is cause of Y.
  • 160.
    Conditions for Causality •There are three conditions must be satisfied. These are: 1. Concomitant Variation 2. Time order of occurrence of variables 3. Elimination of other possible causal factors
  • 161.
    Concomitant Variation • Concomitantvariation is the extent to which a cause, X and effect, Y, occur together or vary together in the way predicted by the hypothesis under consideration. For example: In the qualitative case, the management of a department store believes that sales are highly dependent upon the quality of in-store service. For a quantitative example, consider a random survey of 1,000 respondents regarding purchase of fashion clothing from department stores. This survey yields the data in the below table.
  • 162.
    Evidence of Concomitantvariation between Fashion Clothing and Education Education-X Purchase of Fashion Clothing -Y High Low Total High 363 137 500 Low 322 178 500
  • 163.
    Time order ofoccurrence of variables The time order of occurrence condition states that the causing event must occur either before or simultaneously with the effect; it cannot occur afterwards. By definition, an effect cannot be produced by an event in a relationship to be both cause and effect has taken place. To illustrate, customers who shop frequently in a department store are more likely to have the charge or credit card for that store. Also, customers who have the charge card for department store are likely to shop there frequently.
  • 164.
    Absence of OtherPossible Causal Factors The absence of other possible causal factors means that the factor or variable being investigated should be the only possible causal explanation. In store service may be a cause of sales if we can be sure that changes in all other factors affecting sales, such as pricing, advertising, level of distribution, product quality, competition, were held constant or otherwise controlled.
  • 165.
    Definitions and Concepts Somebasic concepts are as follows. • Independent variables: Independent variables are variables or alternatives are manipulated, and whose effects are measured and compared. These variables also known as treatments, may include price levels, package designs, and advertising themes. • Test units: Test units are individuals, organizations, or other entities whose response to the independent variables or treatments being examined. Test units may include consumers, stores, or geographic units.
  • 166.
    • Dependent variables: Dependentvariables are the variables that measure the effect of the independent variables on the test units. These variables may include sales, profits, and market shares. Extraneous variables: Extraneous variables are all variables other than the independent variables that affect the response of the test units. These variables can confound the dependent variable measures in a way that weakens or invalidates the results of the experiment. Extraneous variables include store size, geographical location, and competitive effort.
  • 167.
    • Experiment: An experimentis formed when the researcher manipulates one or more independent variables and measures their effect on one or more dependent variables, while controlling for the effect of extraneous variables. • Experimental design: An experimental design is a set procedures specifying 1. The test unit and how these units are to be divided into homogeneous subsamples. 2. What independent variables or treatments are to be manipulated. 3. What dependent variables are to be measured, and 4. How the extraneous variables are to be controlled.
  • 168.
    Definitions of Symbols •To facilitate our discussion of extraneous variables and specific experimental designs, we define a set of symbols that are now commonly used in business research. X = the exposure of a group to an independent variable, treatment, or event, the effect of which to be determined. O = the process of observation or measurement of the dependent variable on the test units or group of units. R = the random assignment of test units or groups to separate treatments.
  • 169.
    Validity in Experimentation Whenconducting an experiment, a researcher has two goals: 1. Draw valid conclusions about the effects of independent variables on the study group. 2. Make valid generalizations to a larger population of interest. the first goal concerns internal validity, the second, external validity.
  • 170.
    Extraneous Variables We classifyextraneous variables in the following categories: 1. History 2. Maturation 3. Testing • Main testing effect • Interactive testing effect 5. Instrumentation 6. Statistical regression 7. Selection bias and 8. Mortality
  • 171.
    Controlling Extraneous Variables •Extraneous variables represent alternative explanation of experimental results. They pose a series of threat to the internal and external validity of an experiment. Unless they are controlled for, they affect the dependent variable and thus confound results. For this reason they are also called confounding variables. There are four ways of controlling extraneous variables: 1. Randomization 2. Matching 3. Statistical control 4. Design control
  • 172.
    A Classification ofExperimental Designs Experimental Designs Statistical Quasi- Experimental True experimental Preexperimenta l
  • 173.
    A Classification ofExperimental Designs • Preexperimental designs: Designs that do not control for extraneous factors by randomization. • True experimental designs: Experimental designs distinguished by the fact that the researcher can randomly assign test units to experimental groups and also randomly assign treatments to experimental control. • Quasi-experimental designs: Designs that apply part of the procedures of true experimentation but lack full experimental control. • Statistical: designs that allow for the statistical control and analysis of external variables.
  • 174.
    Preexperimental Designs 1. One-ShotCase Study 2. One-Group Pretest-Posttest Design 3. Static Group Design One-Shot Case Study: A pre experimental design in which a single group of test units is exposed to a treatment X, and then a single measurement on the dependent variable is taken. It is symbolically represented as X O1 Where, X is a single group of test units is exposed to a treatment. O1 is a single measurement on the dependent variable is taken. The one-shot case study is more appropriate for exploratory than for conclusive research.
  • 175.
    One-Group Pretest-Posttest Design: Apre experimental design in which a group of test units is measured twice. It may be symbolized as O 1 X O 2 There is no control group. First, a pretreatment measure is taken ( O 1), then the group is exposed to the treatment (X). Finally a post treatment measure is taken ( O 2). The treatment effect is computed as O2 – O1.
  • 176.
    Static Group Design: Thestatic group is a two-group experimental design. One group, called the experimental group (EG), is exposed to the treatment, and the other, called control group (CG). Measurements on both groups are made only after the treatment, and test units are not assigned at random. EG: X O1 CG: O2 The treatment effect would be measured as O1 –O2.
  • 177.
    True experimental Designs 1.Pretest-Posttest Control Design 2. Posttest-Only control Group Design 3. Solomon Four group Design Pretest-Posttest Control Design: A true experimental design in which the experimental group is exposed to the treatment but the control group is not. Pretest and posttest measures are taken on both groups. This design is symbolized as: EG: R O1 X O2 CG: R O3 O4 The treatment effect is measured as (O2-O1) – (O4-O3)
  • 178.
    Posttest-Only control GroupDesign: A true experimental design in which the experimental group is exposed to the treatment but the control group is not and no pretest measure is taken. It may be symbolized as EG: R X O1 CG: R O2 The treatment effect is obtained by TE = O1 – O2
  • 179.
    Solomon Four groupDesign: A true experimental design that explicitly controls for interactive testing effects, in addition to controlling for all other extraneous variables. This design overcomes the limitations of the other two research designs in that it explicitly controls for interactive testing effect. This design has practical limitations: 1. It is expensive and time consuming to implement 2. It is not considered further
  • 180.
    Quasi-Experimental Designs A quasi-experimental design results under the following conditions. 1. Researcher can control when measurements are taken and on whom they are taken. 2. The researcher lacks control over the scheduling of the treatments and also is unable to expose test units to the treatments randomly. Popular forms of quasi-experimental designs are: 1. Time Series Design 2. Multiple Time Series Design
  • 181.
    Time Series Design: Aquasi experimental design that involves periodic measurements on the dependent variable for a group of test units. Then, the treatment is administered by the researcher or occurs naturally. After the treatment, periodic measurements are continued to determine the treatment effect. A time series experiment may be symbolized as O1 O2 O3 O4 O5 X O6 O7 O8 O9 O10
  • 182.
    Multiple Time SeriesDesign: The multiple time series design is similar to the time series design except that another group of test units is added to serve as a control group. Symbolically, this design may be described as EG: O1 O2 O3 O4 O5 X O6 O7 O8 O9 O10 CG: O11 O12 O13 O14 O15 X O16 O17 O18 O19 O20
  • 183.
    Statistical Designs Statistical designsconsists of series of basic experiments that allow for statistical control and analysis of external variables. In other words, several basic experiments are conducted simultaneously. Thus, statistical designs are influenced by the same sources of invalidity that affect the basic designs being used. Statistical designs offer the following advantages: 1. The effect of more than one independent variable can be measured. 2. Specific extraneous variables can be statistically controlled. 3. Economical designs can be formulated when each test unit is measured more than once. The most common statistical designs are • Randomized Block Design • Latin Square Design • Factorial Design
  • 184.
    Randomized Block Design: Astatistical design in which the test units are blocked on the basis of external variable to ensure that the various experimental and control groups are matched closely on that variable.
  • 185.
    Latin square Design: Astatistical design that allows for the statistical control of two noninteracting external variables in addition to the manipulation of independent variable.
  • 186.
    Factorial Design: A factorialdesign is used to measure the effects of two or more independent variables at various levels and to allow for interactions between variables.
  • 187.
    Laboratory Versus Field Experiments Laboratoryexperiment: An artificial setting for experimentation in which the researcher constructs the desired conditions. Field environment: An experimental environmental location set in actual market conditions.
  • 188.
    Laboratory Versus Field Experiments FACTORLABORATORY FIELD Environment Control Artificial High Realistic Low Reactive Error Demand Artifacts High High Low Low Internal Validity External Validity Time High Low Short Low High Long Number of units Ease of implementation Small High Large Low cost Low High
  • 189.
    Experimental Versus Nonexperimental Designs •Causal designs are truly appropriate for inferring cause-and-effect relationships. • Although descriptive survey data are often used to provide evidence of “causal” relationships, these studies do not meet all the conditions required for causality. • descriptive research offers little control over other possible causal factors.
  • 190.
    Limitations of Experimentation •Time Experiments can be time consuming, particularly if the researcher is interested in measuring the long term effects of treatment. Experiments should lost long enough so that the post treatment measurements include most or all the effects of the independent variables. • Cost Experiments are often expensive. The requirements of experimental group, control group, and multiple measurements significantly add to the cost of research. • Administration Experiments can be difficult to administer. It may be impossible to control for the effects of the extraneous variables, particularly in a field environment.
  • 191.
    193 CLASSIFICATION AND TABULATION Itis the process of arranging data in groups or classes on the basis of common characteristics such as descriptive or numerical. • Simple Classification: This means that one attribute is considered and the universe is divided into two classes. With one class consisting of items possessing the given attribute and the other class consisting of items which do not possess the given attribute. • Class interval Classification: This is more relevant when we use quantitative data like number of guests, number of spa users, age groups of tourists, income levels of travelers, daily occupancy and other statistical data.
  • 192.
    194 TABULATION It is theprocess of summarizing raw data and displaying the same in compact form for further analysis. It is an orderly arrangement of data in columns and rows. Tabulation is essential because: It conserves space and reduces explanatory and descriptive statement to a minimum. It facilitates the process of comparison. It facilitates the summation of items and the detection of errors and omissions. It provides the basis for various statistical computations.
  • 193.
    195 Tabulation may alsobe classified as simple and complex tabulation. Simple tabulation generally results in one-way tables which supply answers to questions about one characteristic of data only. Complex tabulation usually results on two-way tables that give information about two interrelated characteristics of data, three –way tables or still higher order tables known as manifold tables. Components of Data Tables The components of data tables are as under: 1.Table Number: Each table should have a specific table number for ease of access and locating. This number can be readily mentioned anywhere which serves as a reference and leads us directly to the data mentioned in that particular table.
  • 194.
    196 1. Title: Atable must contain a title that clearly tells the readers about the data it contains, time period of study, place of study and the nature of classification of data. 2. Head notes: A headnote further aids in the purpose of a title and displays more information about the table. Generally, headnotes present the units of data in brackets at the end of a table title. 3. Stubs: These are titles of the rows in a table. Thus a stub display information about the data contained in a particular row. 4. Caption: A caption is the title of a column in the data table. In fact, it is a counterpart if a stub and indicates the information contained in a column. 5. Body or field: The body of a table is the content of a table in its entirety. Each item in a body is known as a ‗cell‘. 6. Footnotes: Footnotes are rarely used. In effect, they supplement the title of a table if required. 7. Source: When using data obtained from a secondary source, this source has
  • 195.
    197 PRESENTATION OF DATA Thevarious types of data that can be presented are: Textual presentation Data tables Diagrammatic presentation 1. Time Series Data 2. Bar Charts 3. Combo Charts 4. Pie Charts 5. Tables 6. Geo Map 7. Scorecard 8. Scatter Charts 9. Bullet Charts 10. Area Chart 11. Text & Images
  • 196.
    198 PRESENTING AND ANALYZINGDATA: 1. The results should be presented such that a progression of arguments is in support of the study beginning with a statement defining the purpose of study and subsequently a logical presentation making objectives clear and related to the aim of study. 2. Bigger objectives should be broken down into smaller ones i.e. define each objective as per need and outcome. Prepare a list of data to be collected, the sources of data, form in which data exists and needs to be obtained and conducting a primary survey for information which does not exist. 3. Form and explain the methodology adapted to carry out a study. 4. Sampling methods should be clear and confirmed for ease of collecting data that results in efficient and lesser errors in the process. 2. Collect/obtain data from primary or secondary sources. 3. Change the format of data, i.e., table, maps, graphs, etc. in the desired format 4. Sort data through grouping, discarding the extra data and deciding the required form to make data comprehensible
  • 197.
    199 5.Present only therequired information and skip the background research to make your point more clear. 6.Credits and references should either be provided in the end and wherever obligatory. 7.The presentation methods depend upon the availability of resources and type of results expected out of the final presentation. PowerPoint, Models, Paper Charts, Smart Boards, Analytical software e.g. Google analytics etc can be used to make the presentation effective and crisp. 1. Frame the objectives of the study and make a list of data to be collected Frame the objectives of the study and make a list of data to be collected and its format. Collect/obtain data from primary or secondary sources. Change the format of data, i.e., table, maps, graphs, etc. in the desired format Sort data through grouping, discarding the extra data and deciding the required form to make