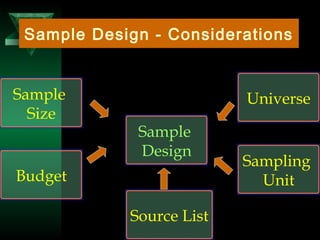
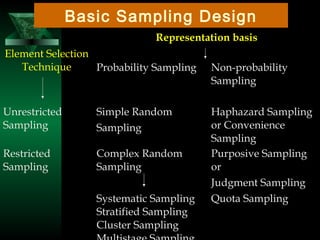
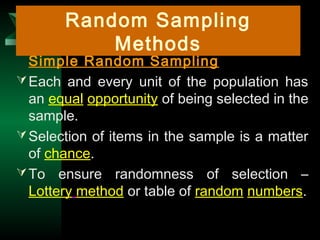
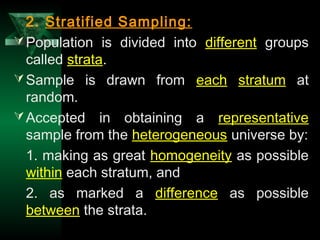
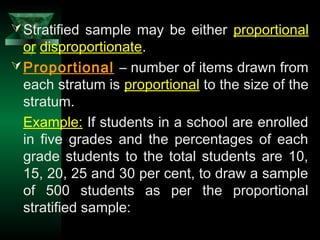
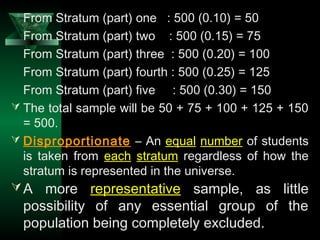
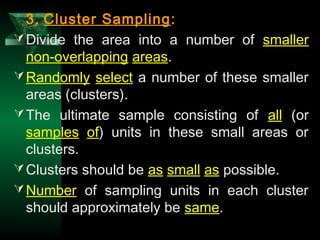
1
Chapter – 6
Sampling Design
2
Contents
 Population and sample
 Sample design-considerations
 Basic sampling design
 Selection of appropriate sampling design
 Characteristics of sample
 Sampling and non-sampling errors
 Discussion- Research topics and farming
sampling design
3
All items in any field of inquiry constitute a
‘Universe’ or ‘Population’.
A complete enumeration of all items in the
‘population’ is known as a Census inquiry.
Merits of Census Method:
Each and Every unit of the population is
covered.
Representative, accurate and reliable
results.
Population/Universe
4
Demerits of Census Method:
 Difficult to adopt in case the universe is infinite.
 Large amount of effort, money and time is
required.
Sample Design
 Is a definite plan for obtaining a sample
from a given population.
Why Sample:
1. Lower cost
2. Greater speed of data collection
3. Availability of population elements
5
Sample
( Selected Respondents)
Sampling
( Selection Process/
Technique
Sample Design
Sample Survey
( Survey of the selected respondents )
6
Sample
Design
Universe
Sampling
Unit
Source List
Budget
Sample
Size
Sample Design - Considerations
7
Type of Universe:
Defining the set of objects to be studied.
Identifying the universe – finite or infinite.
Have an idea about the nature and number
of items in the universe.
Sampling Unit:
Determining the sampling unit before
selecting the sample – geographical one,
social unit, individual, etc.
8
Source List:
Known as ‘sampling frame’ from which
sample is to be drawn.
Contains the names of all items of a finite
universe.
In case of non-availability, researcher has to
prepare the same.
List must be comprehensive, correct, reliable
and appropriate.
9
Budgetary Constraint:
Cost considerations have a major impact
upon the size and type of the sample.
Can even lead to the use of a non-
probability sample.
Size of Sample:
Refers to the number of items to be selected
from the universe.
Size of the sample should be –
representative and reliable.
10
Sample size based on:
1. Statistics formula
2. Nature and size of the universe, nature of
the problem to be studied, involvement of
cost, etc.
11
Element Selection
Technique
Representation basis
Probability Sampling Non-probability
Sampling
Unrestricted
Sampling
Simple Random
Sampling
Haphazard Sampling
or Convenience
Sampling
Restricted
Sampling
Complex Random
Sampling
Systematic Sampling
Stratified Sampling
Cluster Sampling
Purposive Sampling
or
Judgment Sampling
Quota Sampling
Basic Sampling Design
12
Simple Random Sampling
Each and every unit of the population has
an equal opportunity of being selected in the
sample.
Selection of items in the sample is a matter
of chance.
To ensure randomness of selection –
Lottery method or table of random numbers.
Random Sampling
Methods
13
Lottery Method: A blindfold selection of
the number of slips (sample size) is made
out of the items of the universe.
Slips should be of identical size, shape and
color and should be mixed thoroughly.
Limited practical utility in case the size of
universe is large.
Table of Random Numbers:
Several standard tables of Random
Numbers are available – Tippett (1927),
Fisher and Yates (1938), Kendall and Smith
(1939), Rao, Mitra and Mathai (1966).
14
Tippett’s (1927) random number tables
consisting of 41,600 digits grouped into
10,400 sets of four-digit random numbers.
The first forty sets from Tippett’s table are:
2952 6641 3992 9792 7969 5911 3170 5624
4167 9524 1545 1396 7203 5356 1300 2693
2370 7483 3408 2762 3563 1089 6913 7691
0560 5246 1112 6107 6008 8125 4233 8776
2754 9143 1405 9025 7002 6111 8816 6446
For selecting 10 items out of 5000, the first
ten numbers up to 5000 should be selected.
15
If the size of the universe is less than 1000,
for selecting 10 items out of 900, the
numbers from 0001 to 0900 will be selected.
If the size of the universe is less than 100,
for selecting 10 items out of 90, after writing
down the number in pairs and reading either
horizontally or vertically and ignoring the
numbers greater than 90, the items may be
selected.
Sample depends entirely on chance, hence
no possibility of personal bias affecting the
results.
16
Difficulty involved in studying samples
having widely dispersed geographically.
Complex Random Sampling Designs
1. Systematic Sampling:
Is formed by selecting one unit at random
and then selecting additional units at evenly
spaced intervals until the sample has been
formed.
Required a complete list of the population
from which sample is to be drawn.
17
 After the first item, subsequent items are
selected by taking every k th item from the
list.
 ‘k’ refers to the sampling interval or
sampling ratio, i.e., the ratio of population
to the size of the sample.
 k = N / n, N = universe size and n =
sample size.
 Also referred to as quasi-random sampling
method.
18
 Compared to simple random sample,
systematic sample spreads more evenly
over the entire population.
 In case of a fractional value of k, if it is <
0.5 it should be omitted, if it is > 0.5 it
should be taken as 1, and if it is 0.5 it
should be omitted if the number is even
and taken as 1 if the number is odd.
19
 Example: If the number of students in
three schools are 102, 115 and 110 and
the sample size is required to be 20, then
k = 102 / 20 = 5.1 or 5
k = 115 / 20 = 5.75 or 6
k = 110 / 20 = 5.5 or 6
 The first student will be selected at random
between 1 to k and then every k the
student will be selected for the study.
20
2. Stratified Sampling:
Population is divided into different groups
called strata.
Sample is drawn from each stratum at
random.
Accepted in obtaining a representative
sample from the heterogeneous universe by:
1. making as great homogeneity as possible
within each stratum, and
2. as marked a difference as possible
between the strata.
21
Stratified sample may be either proportional
or disproportionate.
Proportional – number of items drawn from
each stratum is proportional to the size of the
stratum.
Example: If students in a school are enrolled
in five grades and the percentages of each
grade students to the total students are 10,
15, 20, 25 and 30 per cent, to draw a sample
of 500 students as per the proportional
stratified sample:
22
From Stratum (part) one : 500 (0.10) = 50
From Stratum (part) two : 500 (0.15) = 75
From Stratum (part) three : 500 (0.20) = 100
From Stratum (part) fourth : 500 (0.25) = 125
From Stratum (part) five : 500 (0.30) = 150
 The total sample will be 50 + 75 + 100 + 125 + 150
= 500.
 Disproportionate – An equal number of students
is taken from each stratum regardless of how the
stratum is represented in the universe.
A more representative sample, as little
possibility of any essential group of the
population being completely excluded.
23
3. Cluster Sampling:
Divide the area into a number of smaller
non-overlapping areas.
Randomly select a number of these smaller
areas (clusters).
The ultimate sample consisting of all (or
samples of) units in these small areas or
clusters.
Clusters should be as small as possible.
Number of sampling units in each cluster
should approximately be same.
24
Reduces cost by concentrating surveys in
selected clusters.
Certainly less precise than random sampling.
Mostly used for the economic advantage it
possesses; estimates based on cluster
samples are usually more reliable per unit
cost.
Better known as Area sampling, if clusters
happen to be some geographic subdivisions.
25
4. Multi-stage Sampling:
Is a further development of the principle of
cluster sampling.
Random selection is made of primary,
intermediate and final units from a given
population or stratum.
Stages of Sample Selection:
First Stage: To select large primary
sampling unit, such as Provinces in the
country.
26
Second stage: To select certain districts.
(Represents a two-stage sampling design)
Third stage: To select certain towns/
communes.
(Represents a three-stage sampling design)
Fourth stage: To select randomly sample
units (schools) from each selected towns/
communes.
(Represents a four-stage sampling design)
Selection made at all stages randomly
referred to as ‘multi-stage random sampling
design’.
27
1. Convenience Sampling:
Is obtained by selecting ‘convenient’
population units.
Samples are biased by their nature of
selection.
Used frequently for making pilot studies.
Non-probability Sampling
28
2. Purposive Sampling:
Type of non-random sampling, also known
as judgment or deliberate sampling.
Choice of sample items depends exclusively
on the judgment of the researcher.
Used in case of small size of the universe.
Sample units may be affected by the
personal prejudice or bias of the universe.
29
3. Quota Sampling:
Quotas are set up according to some
specified characteristics (age, income,
habitation..)
Within the quotas, selection of sample items
depends on personal judgment.
Probability of missing representative
samples due to personal biasness.
30
Normally, random sampling should be
preferred because of its non-biasness.
Purposive sampling is more appropriate
when the universe happens to be small and
a known characteristics of it is to be studied
intensively.
Nature of problem, size of universe, size of
the sample, availability of funds, time etc.
influence the selection of a method.
Selection of Appropriate
Method of Sampling
31
A sample should be so selected that truly
represents universe. (Representativeness)
The size of sample should be adequate to
represent the characteristics of the universe.
(Adequacy)
Should not be any difference in the nature of
units of the universe and sample.
(Homogeneity)
All items of the universe should have same
chance of being selected in the sample.
Characteristics of Sample
32
Sampling and Non-sampling
Errors
Error arising due to drawing inferences
about the population on the basis of few
observations – Sampling Error.
Sampling Error in this sense is non-existent
in complete enumeration survey. (whole
population is surveyed).
33
Error arising at the stages of ascertainment
and processing of data – non-sampling
errors.
Non-sampling errors are common both in
complete enumeration and sample surveys.
Will be of large magnitude in census than in
sample survey due to increase in the
number of units.
34
Control of Sampling Errors
Sample should be drawn either entirely at
random or at random subject to restrictions.
Size of the sample should be increased for
increasing the accuracy level.
Control of Non-sampling Errors
Adequate training before survey begins.
Using right statistical techniques in data
analysis.
Pilot survey before finalization of
questionnaire.
Complete and thorough editing work.
Effective follow-up of non-response cases.
35
Sampling Exercise
Group Activity (Two persons)
Time: 30 minutes

Chapter 6 (sample design)

  • 1.
  • 2.
    2 Contents  Population andsample  Sample design-considerations  Basic sampling design  Selection of appropriate sampling design  Characteristics of sample  Sampling and non-sampling errors  Discussion- Research topics and farming sampling design
  • 3.
    3 All items inany field of inquiry constitute a ‘Universe’ or ‘Population’. A complete enumeration of all items in the ‘population’ is known as a Census inquiry. Merits of Census Method: Each and Every unit of the population is covered. Representative, accurate and reliable results. Population/Universe
  • 4.
    4 Demerits of CensusMethod:  Difficult to adopt in case the universe is infinite.  Large amount of effort, money and time is required. Sample Design  Is a definite plan for obtaining a sample from a given population. Why Sample: 1. Lower cost 2. Greater speed of data collection 3. Availability of population elements
  • 5.
    5 Sample ( Selected Respondents) Sampling (Selection Process/ Technique Sample Design Sample Survey ( Survey of the selected respondents )
  • 6.
  • 7.
    7 Type of Universe: Definingthe set of objects to be studied. Identifying the universe – finite or infinite. Have an idea about the nature and number of items in the universe. Sampling Unit: Determining the sampling unit before selecting the sample – geographical one, social unit, individual, etc.
  • 8.
    8 Source List: Known as‘sampling frame’ from which sample is to be drawn. Contains the names of all items of a finite universe. In case of non-availability, researcher has to prepare the same. List must be comprehensive, correct, reliable and appropriate.
  • 9.
    9 Budgetary Constraint: Cost considerationshave a major impact upon the size and type of the sample. Can even lead to the use of a non- probability sample. Size of Sample: Refers to the number of items to be selected from the universe. Size of the sample should be – representative and reliable.
  • 10.
    10 Sample size basedon: 1. Statistics formula 2. Nature and size of the universe, nature of the problem to be studied, involvement of cost, etc.
  • 11.
    11 Element Selection Technique Representation basis ProbabilitySampling Non-probability Sampling Unrestricted Sampling Simple Random Sampling Haphazard Sampling or Convenience Sampling Restricted Sampling Complex Random Sampling Systematic Sampling Stratified Sampling Cluster Sampling Purposive Sampling or Judgment Sampling Quota Sampling Basic Sampling Design
  • 12.
    12 Simple Random Sampling Eachand every unit of the population has an equal opportunity of being selected in the sample. Selection of items in the sample is a matter of chance. To ensure randomness of selection – Lottery method or table of random numbers. Random Sampling Methods
  • 13.
    13 Lottery Method: Ablindfold selection of the number of slips (sample size) is made out of the items of the universe. Slips should be of identical size, shape and color and should be mixed thoroughly. Limited practical utility in case the size of universe is large. Table of Random Numbers: Several standard tables of Random Numbers are available – Tippett (1927), Fisher and Yates (1938), Kendall and Smith (1939), Rao, Mitra and Mathai (1966).
  • 14.
    14 Tippett’s (1927) randomnumber tables consisting of 41,600 digits grouped into 10,400 sets of four-digit random numbers. The first forty sets from Tippett’s table are: 2952 6641 3992 9792 7969 5911 3170 5624 4167 9524 1545 1396 7203 5356 1300 2693 2370 7483 3408 2762 3563 1089 6913 7691 0560 5246 1112 6107 6008 8125 4233 8776 2754 9143 1405 9025 7002 6111 8816 6446 For selecting 10 items out of 5000, the first ten numbers up to 5000 should be selected.
  • 15.
    15 If the sizeof the universe is less than 1000, for selecting 10 items out of 900, the numbers from 0001 to 0900 will be selected. If the size of the universe is less than 100, for selecting 10 items out of 90, after writing down the number in pairs and reading either horizontally or vertically and ignoring the numbers greater than 90, the items may be selected. Sample depends entirely on chance, hence no possibility of personal bias affecting the results.
  • 16.
    16 Difficulty involved instudying samples having widely dispersed geographically. Complex Random Sampling Designs 1. Systematic Sampling: Is formed by selecting one unit at random and then selecting additional units at evenly spaced intervals until the sample has been formed. Required a complete list of the population from which sample is to be drawn.
  • 17.
    17  After thefirst item, subsequent items are selected by taking every k th item from the list.  ‘k’ refers to the sampling interval or sampling ratio, i.e., the ratio of population to the size of the sample.  k = N / n, N = universe size and n = sample size.  Also referred to as quasi-random sampling method.
  • 18.
    18  Compared tosimple random sample, systematic sample spreads more evenly over the entire population.  In case of a fractional value of k, if it is < 0.5 it should be omitted, if it is > 0.5 it should be taken as 1, and if it is 0.5 it should be omitted if the number is even and taken as 1 if the number is odd.
  • 19.
    19  Example: Ifthe number of students in three schools are 102, 115 and 110 and the sample size is required to be 20, then k = 102 / 20 = 5.1 or 5 k = 115 / 20 = 5.75 or 6 k = 110 / 20 = 5.5 or 6  The first student will be selected at random between 1 to k and then every k the student will be selected for the study.
  • 20.
    20 2. Stratified Sampling: Populationis divided into different groups called strata. Sample is drawn from each stratum at random. Accepted in obtaining a representative sample from the heterogeneous universe by: 1. making as great homogeneity as possible within each stratum, and 2. as marked a difference as possible between the strata.
  • 21.
    21 Stratified sample maybe either proportional or disproportionate. Proportional – number of items drawn from each stratum is proportional to the size of the stratum. Example: If students in a school are enrolled in five grades and the percentages of each grade students to the total students are 10, 15, 20, 25 and 30 per cent, to draw a sample of 500 students as per the proportional stratified sample:
  • 22.
    22 From Stratum (part)one : 500 (0.10) = 50 From Stratum (part) two : 500 (0.15) = 75 From Stratum (part) three : 500 (0.20) = 100 From Stratum (part) fourth : 500 (0.25) = 125 From Stratum (part) five : 500 (0.30) = 150  The total sample will be 50 + 75 + 100 + 125 + 150 = 500.  Disproportionate – An equal number of students is taken from each stratum regardless of how the stratum is represented in the universe. A more representative sample, as little possibility of any essential group of the population being completely excluded.
  • 23.
    23 3. Cluster Sampling: Dividethe area into a number of smaller non-overlapping areas. Randomly select a number of these smaller areas (clusters). The ultimate sample consisting of all (or samples of) units in these small areas or clusters. Clusters should be as small as possible. Number of sampling units in each cluster should approximately be same.
  • 24.
    24 Reduces cost byconcentrating surveys in selected clusters. Certainly less precise than random sampling. Mostly used for the economic advantage it possesses; estimates based on cluster samples are usually more reliable per unit cost. Better known as Area sampling, if clusters happen to be some geographic subdivisions.
  • 25.
    25 4. Multi-stage Sampling: Isa further development of the principle of cluster sampling. Random selection is made of primary, intermediate and final units from a given population or stratum. Stages of Sample Selection: First Stage: To select large primary sampling unit, such as Provinces in the country.
  • 26.
    26 Second stage: Toselect certain districts. (Represents a two-stage sampling design) Third stage: To select certain towns/ communes. (Represents a three-stage sampling design) Fourth stage: To select randomly sample units (schools) from each selected towns/ communes. (Represents a four-stage sampling design) Selection made at all stages randomly referred to as ‘multi-stage random sampling design’.
  • 27.
    27 1. Convenience Sampling: Isobtained by selecting ‘convenient’ population units. Samples are biased by their nature of selection. Used frequently for making pilot studies. Non-probability Sampling
  • 28.
    28 2. Purposive Sampling: Typeof non-random sampling, also known as judgment or deliberate sampling. Choice of sample items depends exclusively on the judgment of the researcher. Used in case of small size of the universe. Sample units may be affected by the personal prejudice or bias of the universe.
  • 29.
    29 3. Quota Sampling: Quotasare set up according to some specified characteristics (age, income, habitation..) Within the quotas, selection of sample items depends on personal judgment. Probability of missing representative samples due to personal biasness.
  • 30.
    30 Normally, random samplingshould be preferred because of its non-biasness. Purposive sampling is more appropriate when the universe happens to be small and a known characteristics of it is to be studied intensively. Nature of problem, size of universe, size of the sample, availability of funds, time etc. influence the selection of a method. Selection of Appropriate Method of Sampling
  • 31.
    31 A sample shouldbe so selected that truly represents universe. (Representativeness) The size of sample should be adequate to represent the characteristics of the universe. (Adequacy) Should not be any difference in the nature of units of the universe and sample. (Homogeneity) All items of the universe should have same chance of being selected in the sample. Characteristics of Sample
  • 32.
    32 Sampling and Non-sampling Errors Errorarising due to drawing inferences about the population on the basis of few observations – Sampling Error. Sampling Error in this sense is non-existent in complete enumeration survey. (whole population is surveyed).
  • 33.
    33 Error arising atthe stages of ascertainment and processing of data – non-sampling errors. Non-sampling errors are common both in complete enumeration and sample surveys. Will be of large magnitude in census than in sample survey due to increase in the number of units.
  • 34.
    34 Control of SamplingErrors Sample should be drawn either entirely at random or at random subject to restrictions. Size of the sample should be increased for increasing the accuracy level. Control of Non-sampling Errors Adequate training before survey begins. Using right statistical techniques in data analysis. Pilot survey before finalization of questionnaire. Complete and thorough editing work. Effective follow-up of non-response cases.
  • 35.
    35 Sampling Exercise Group Activity(Two persons) Time: 30 minutes