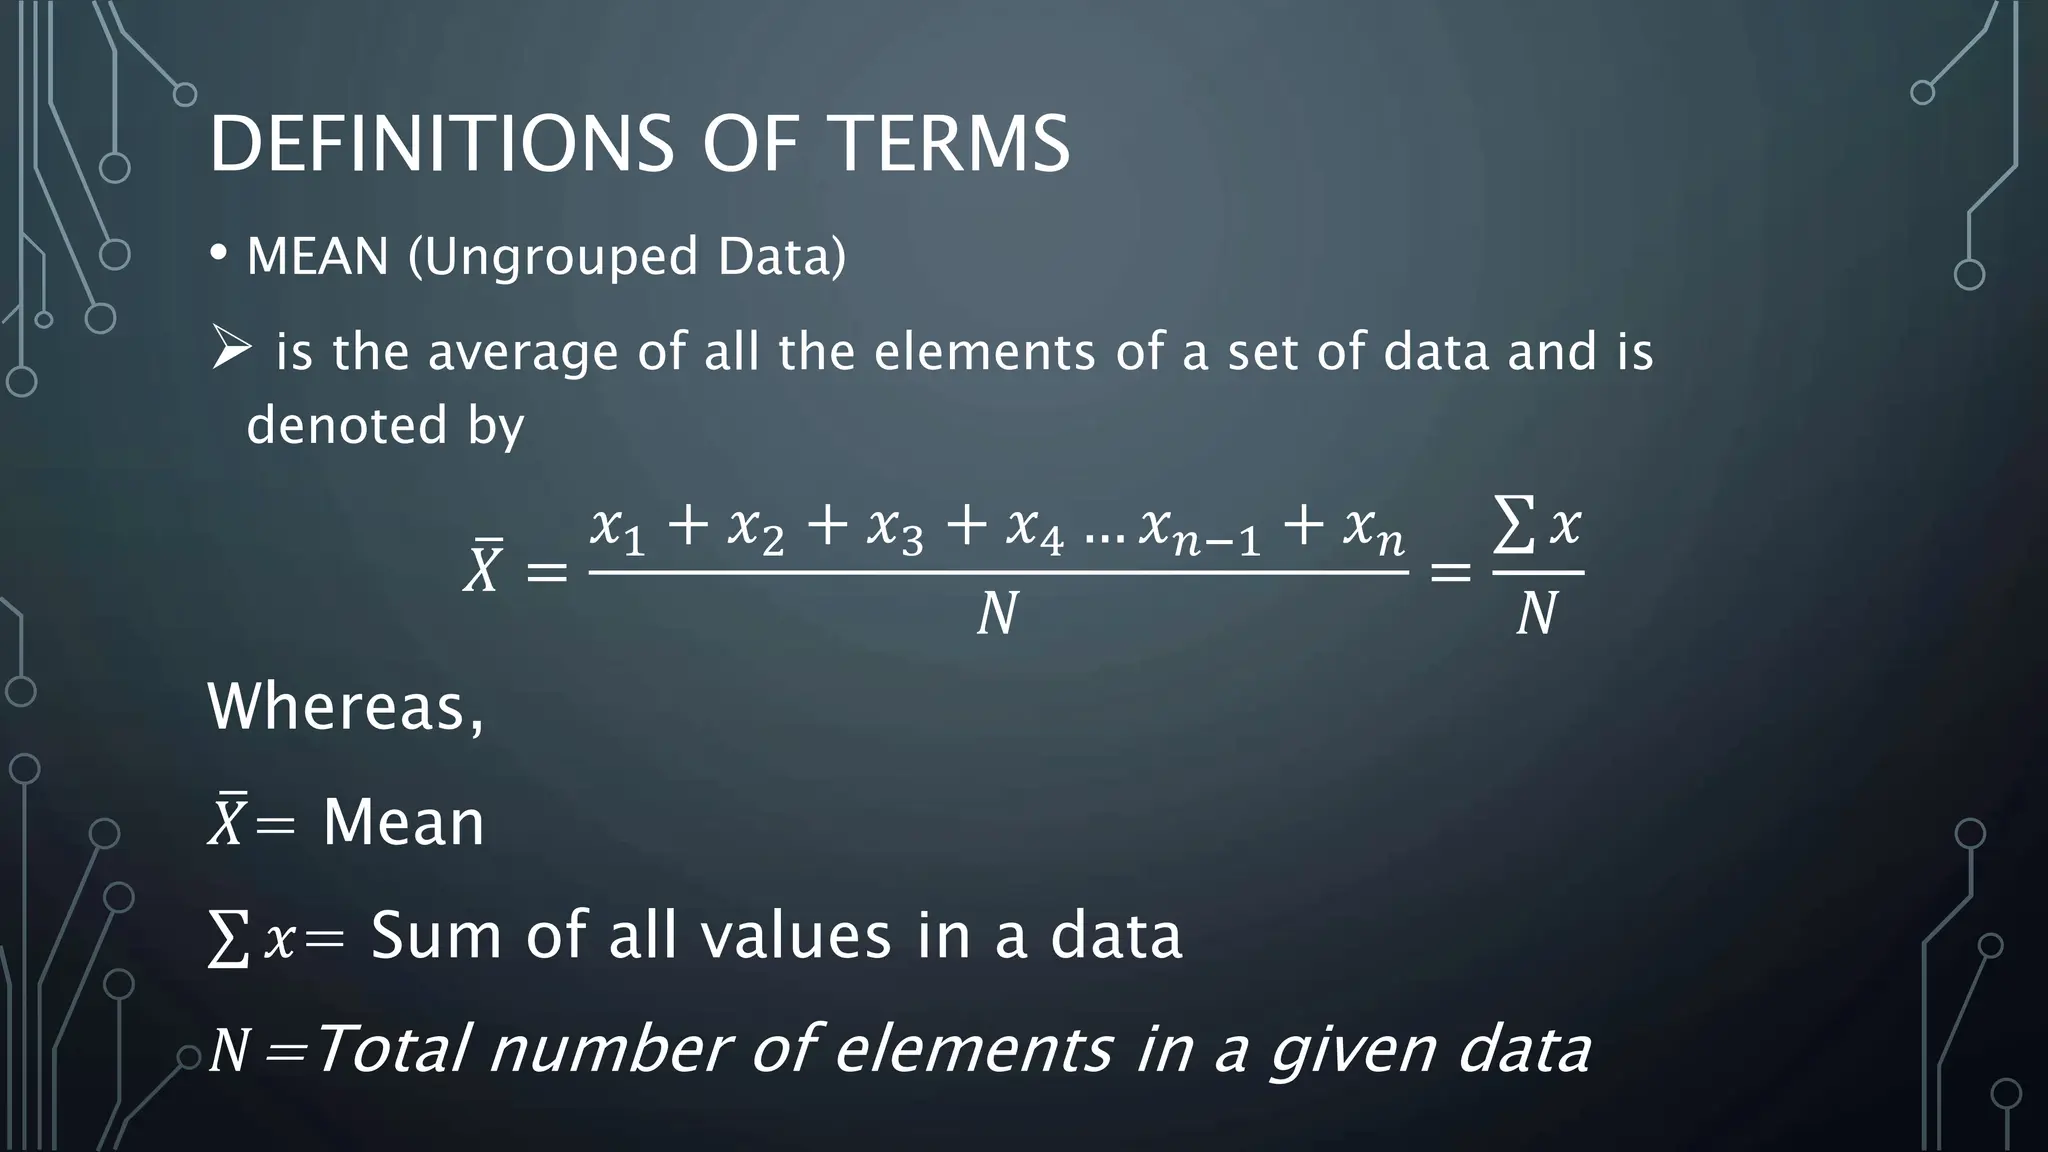
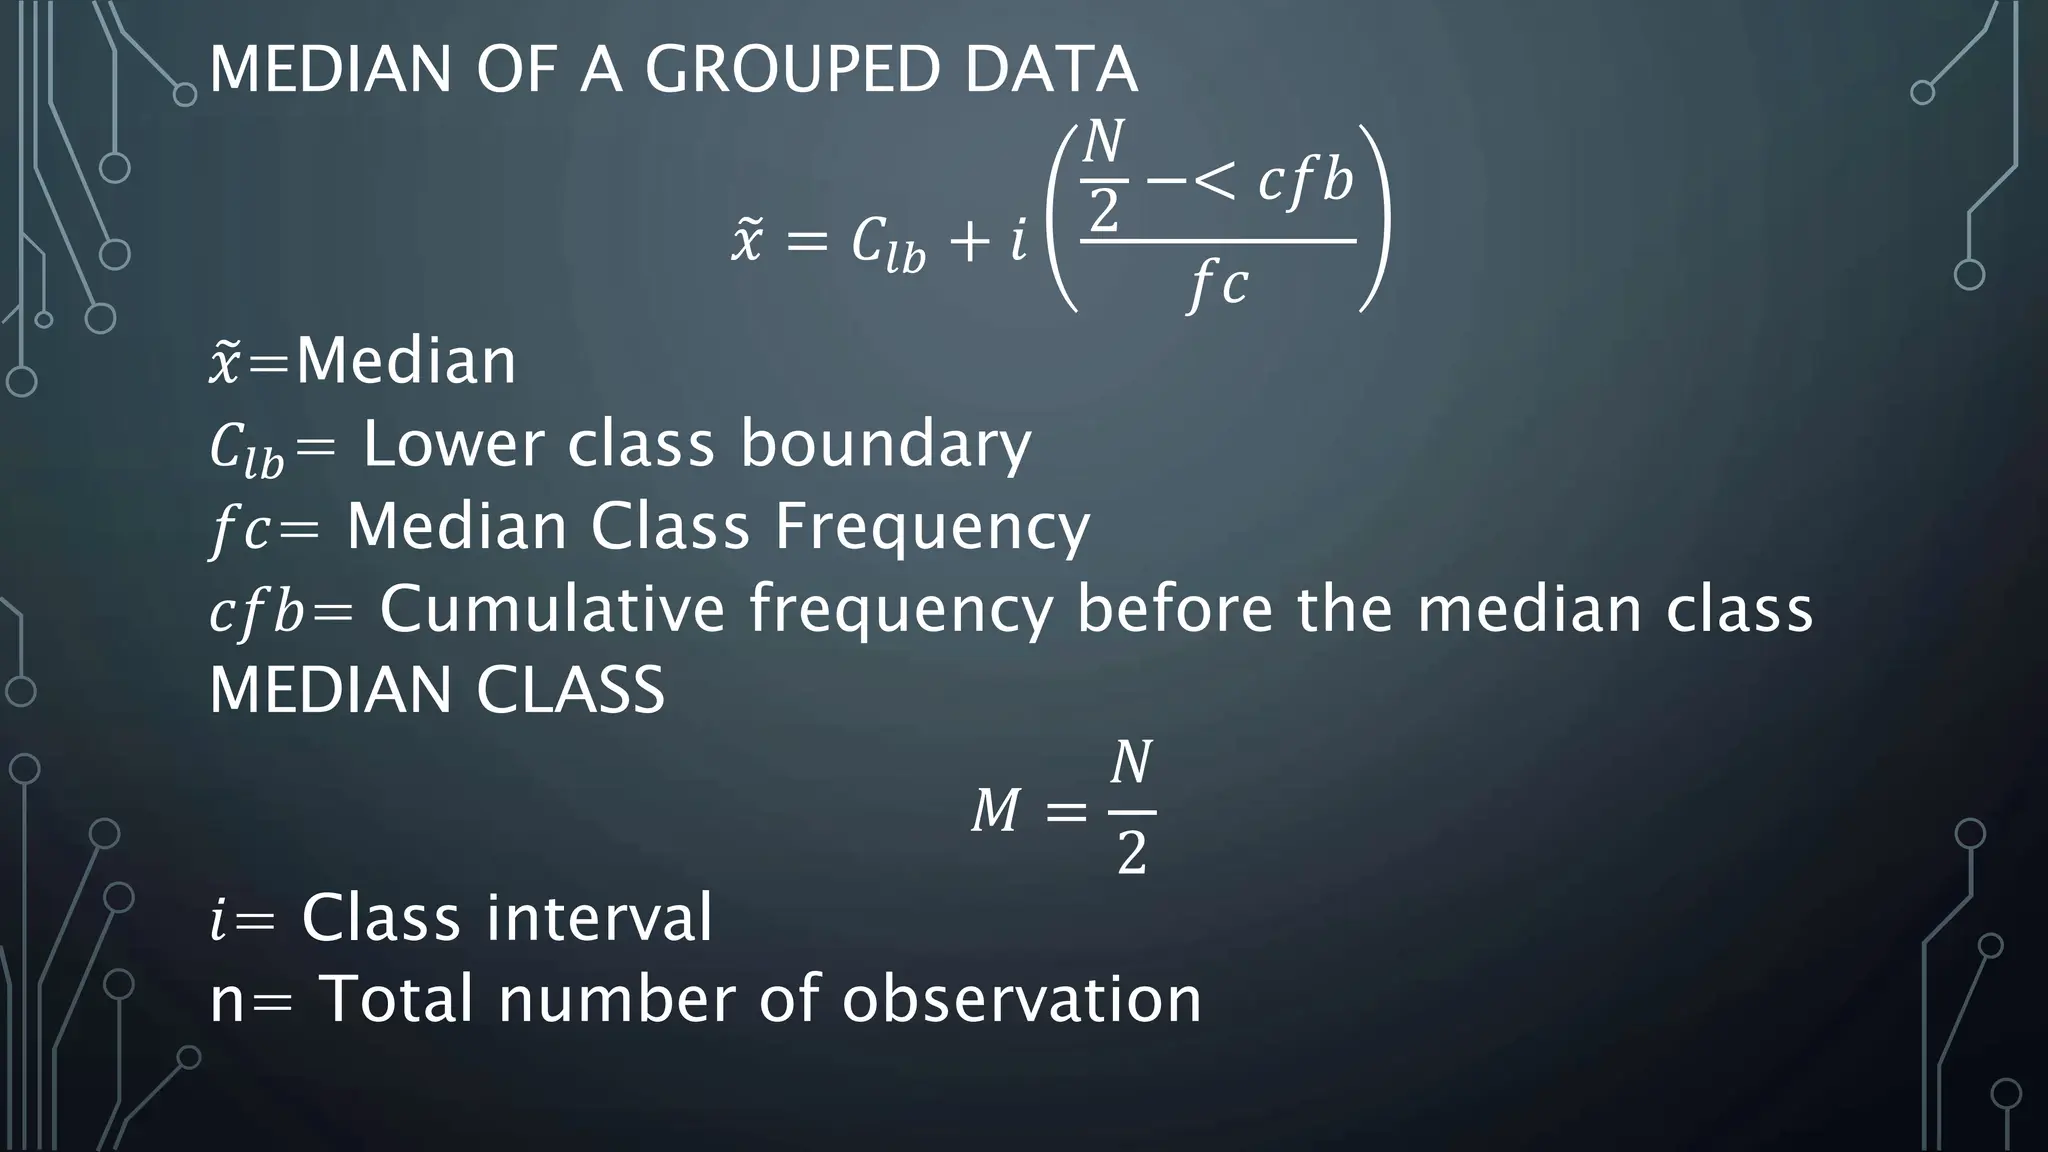
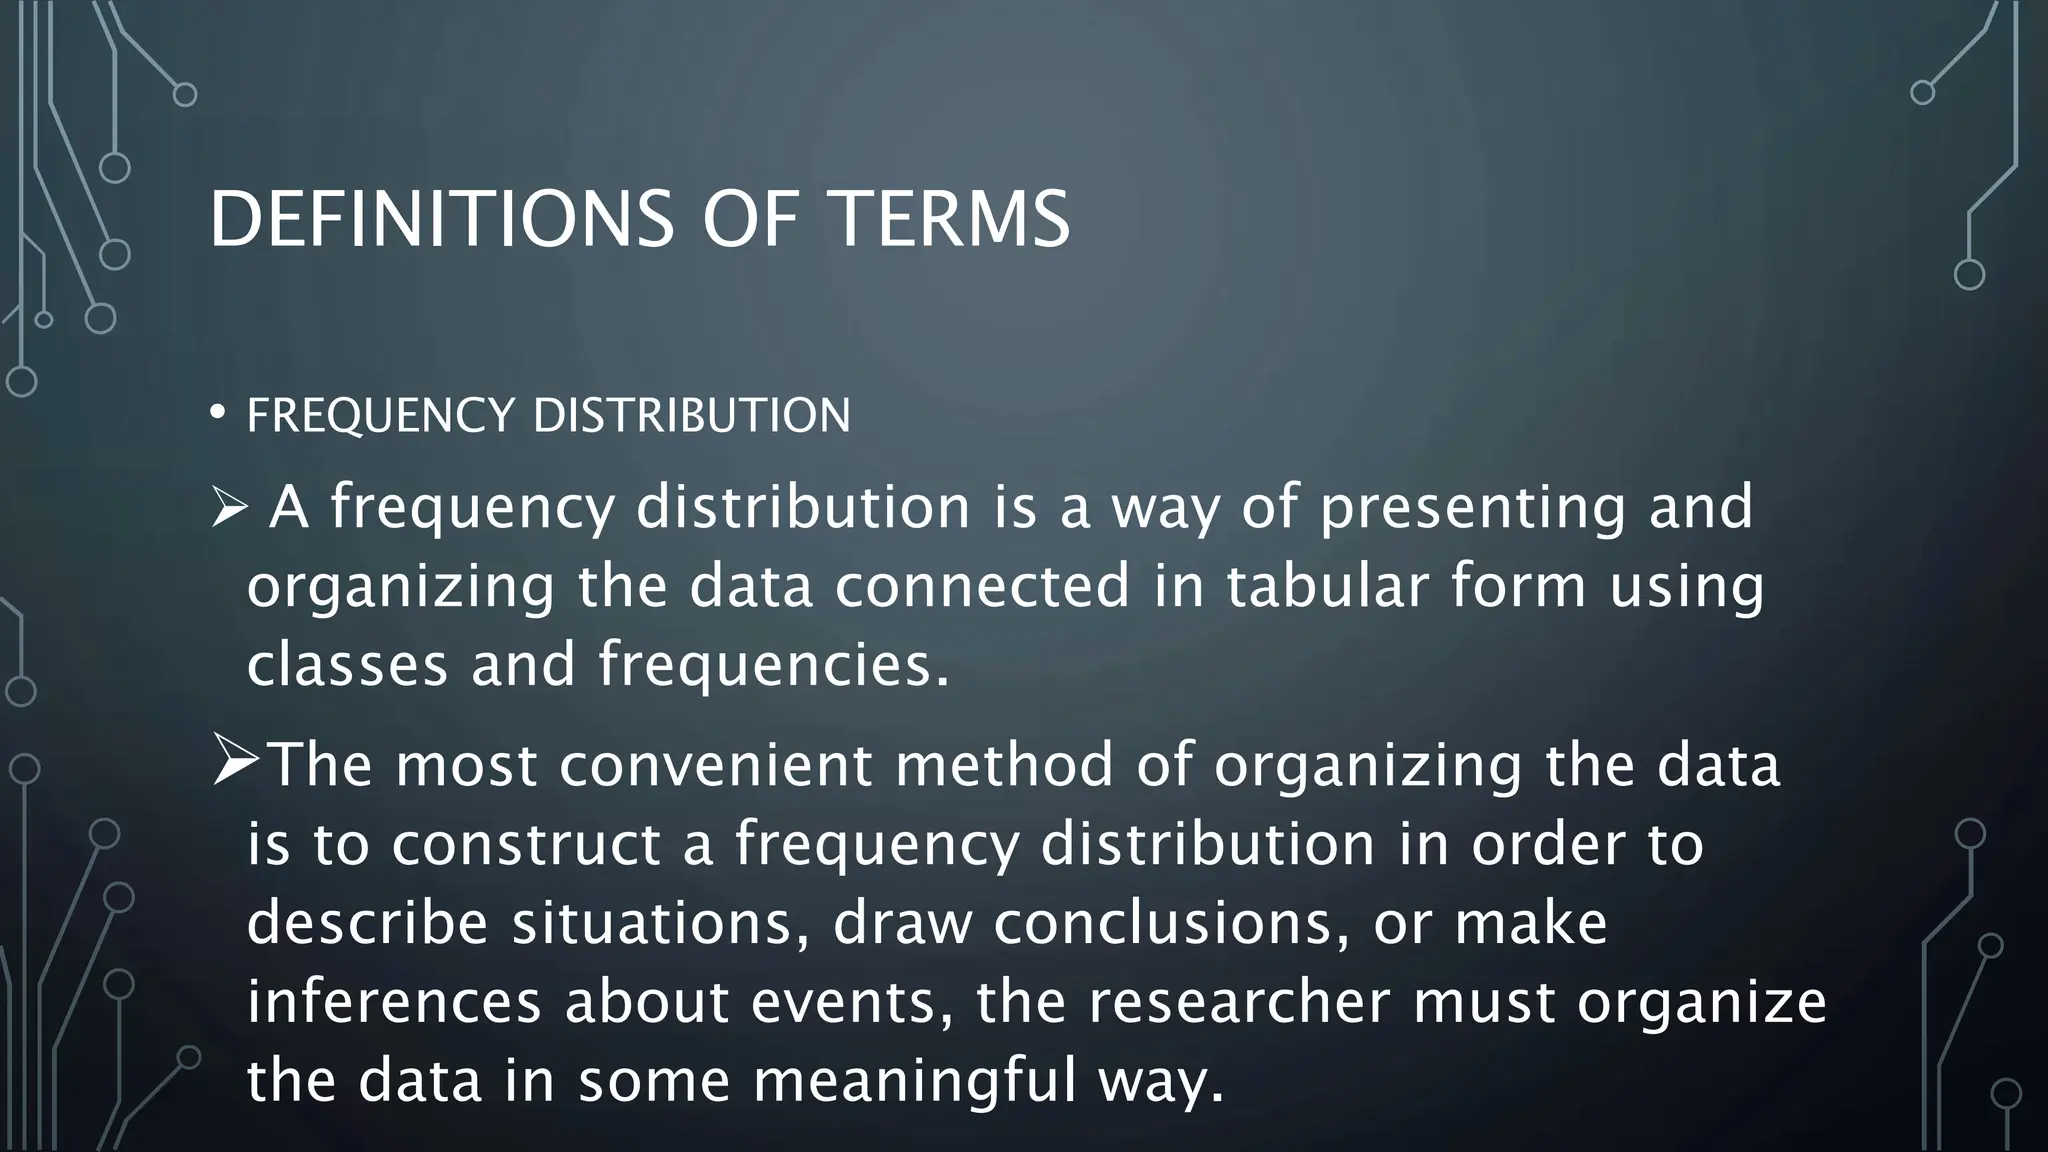
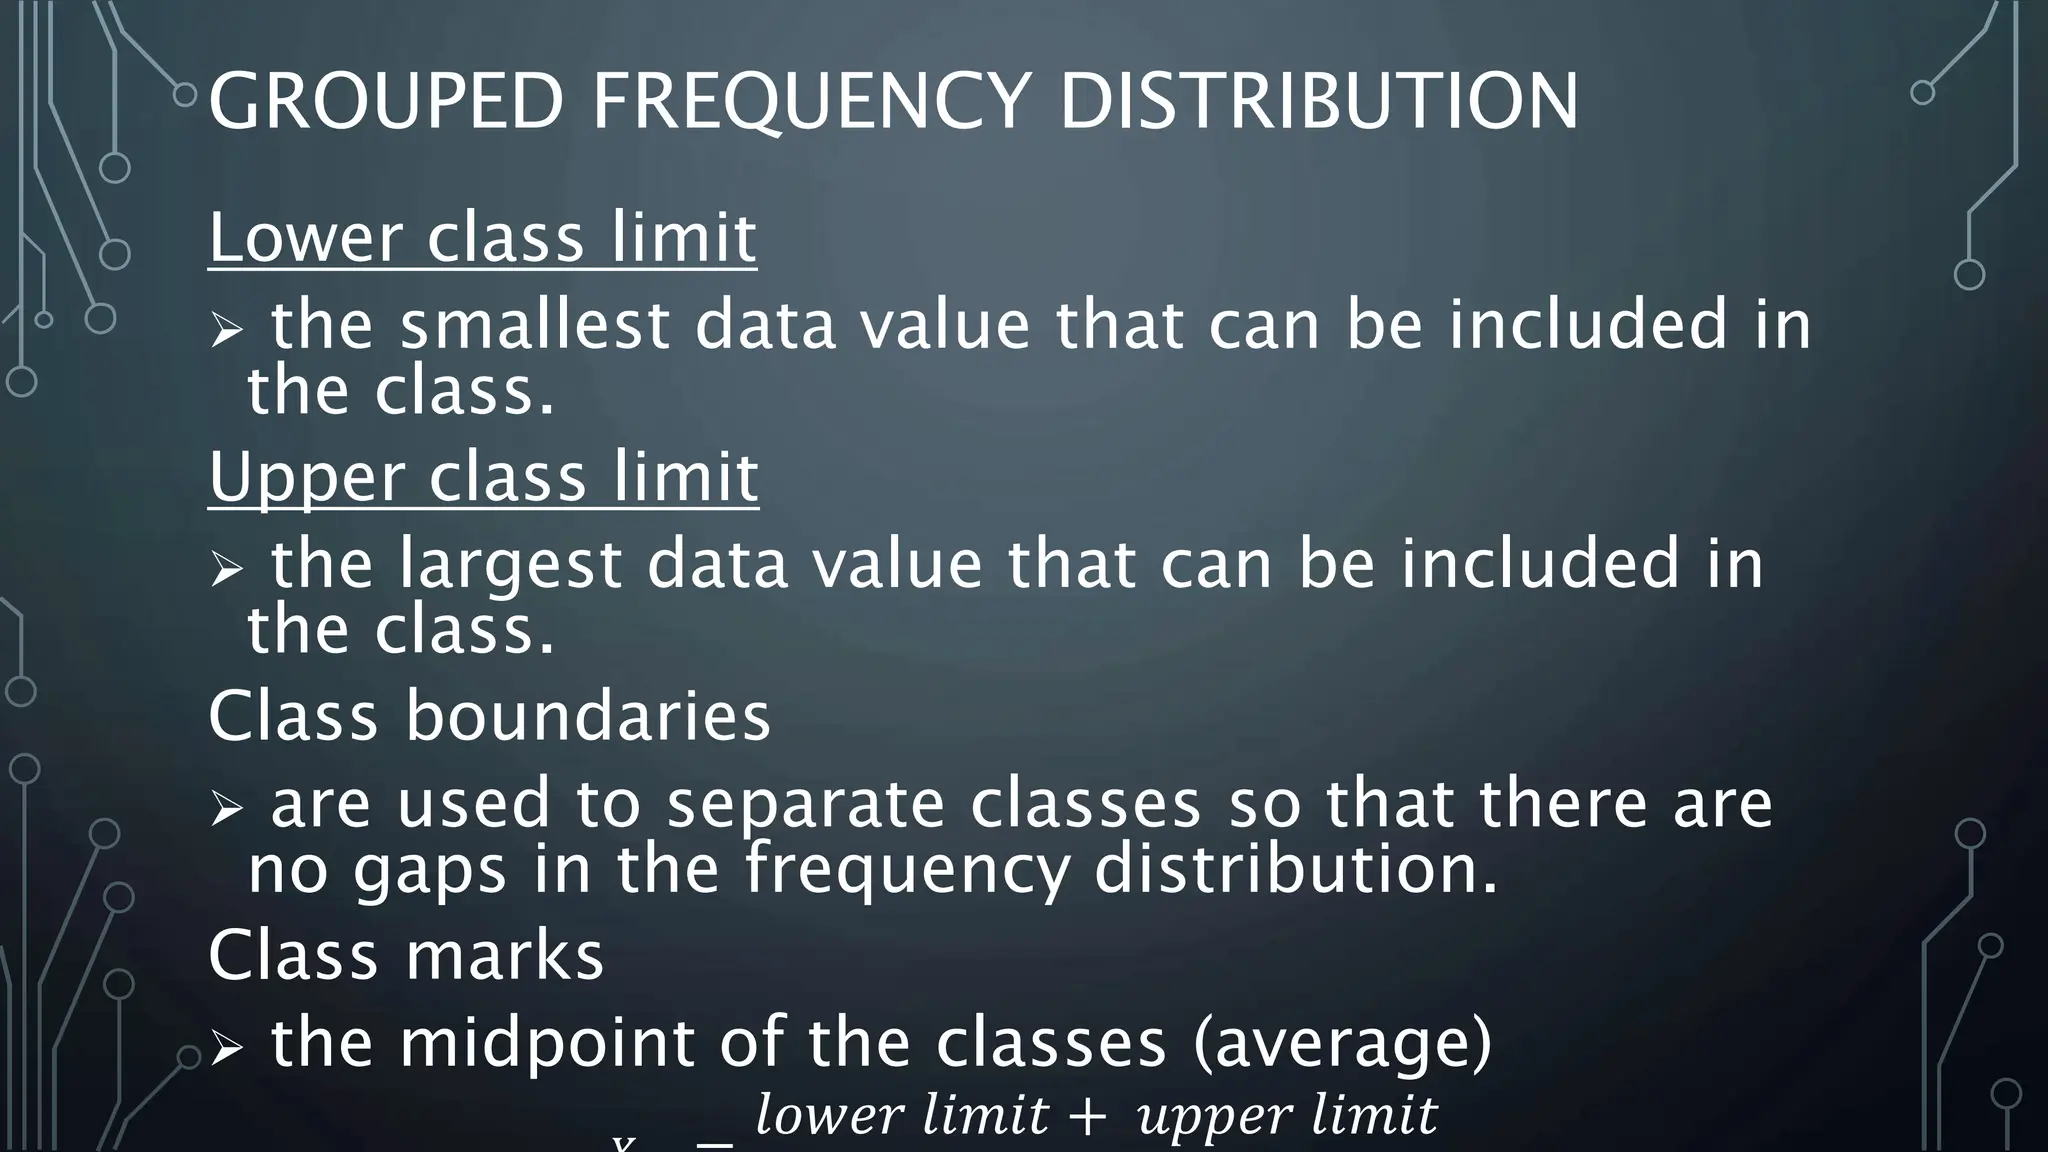
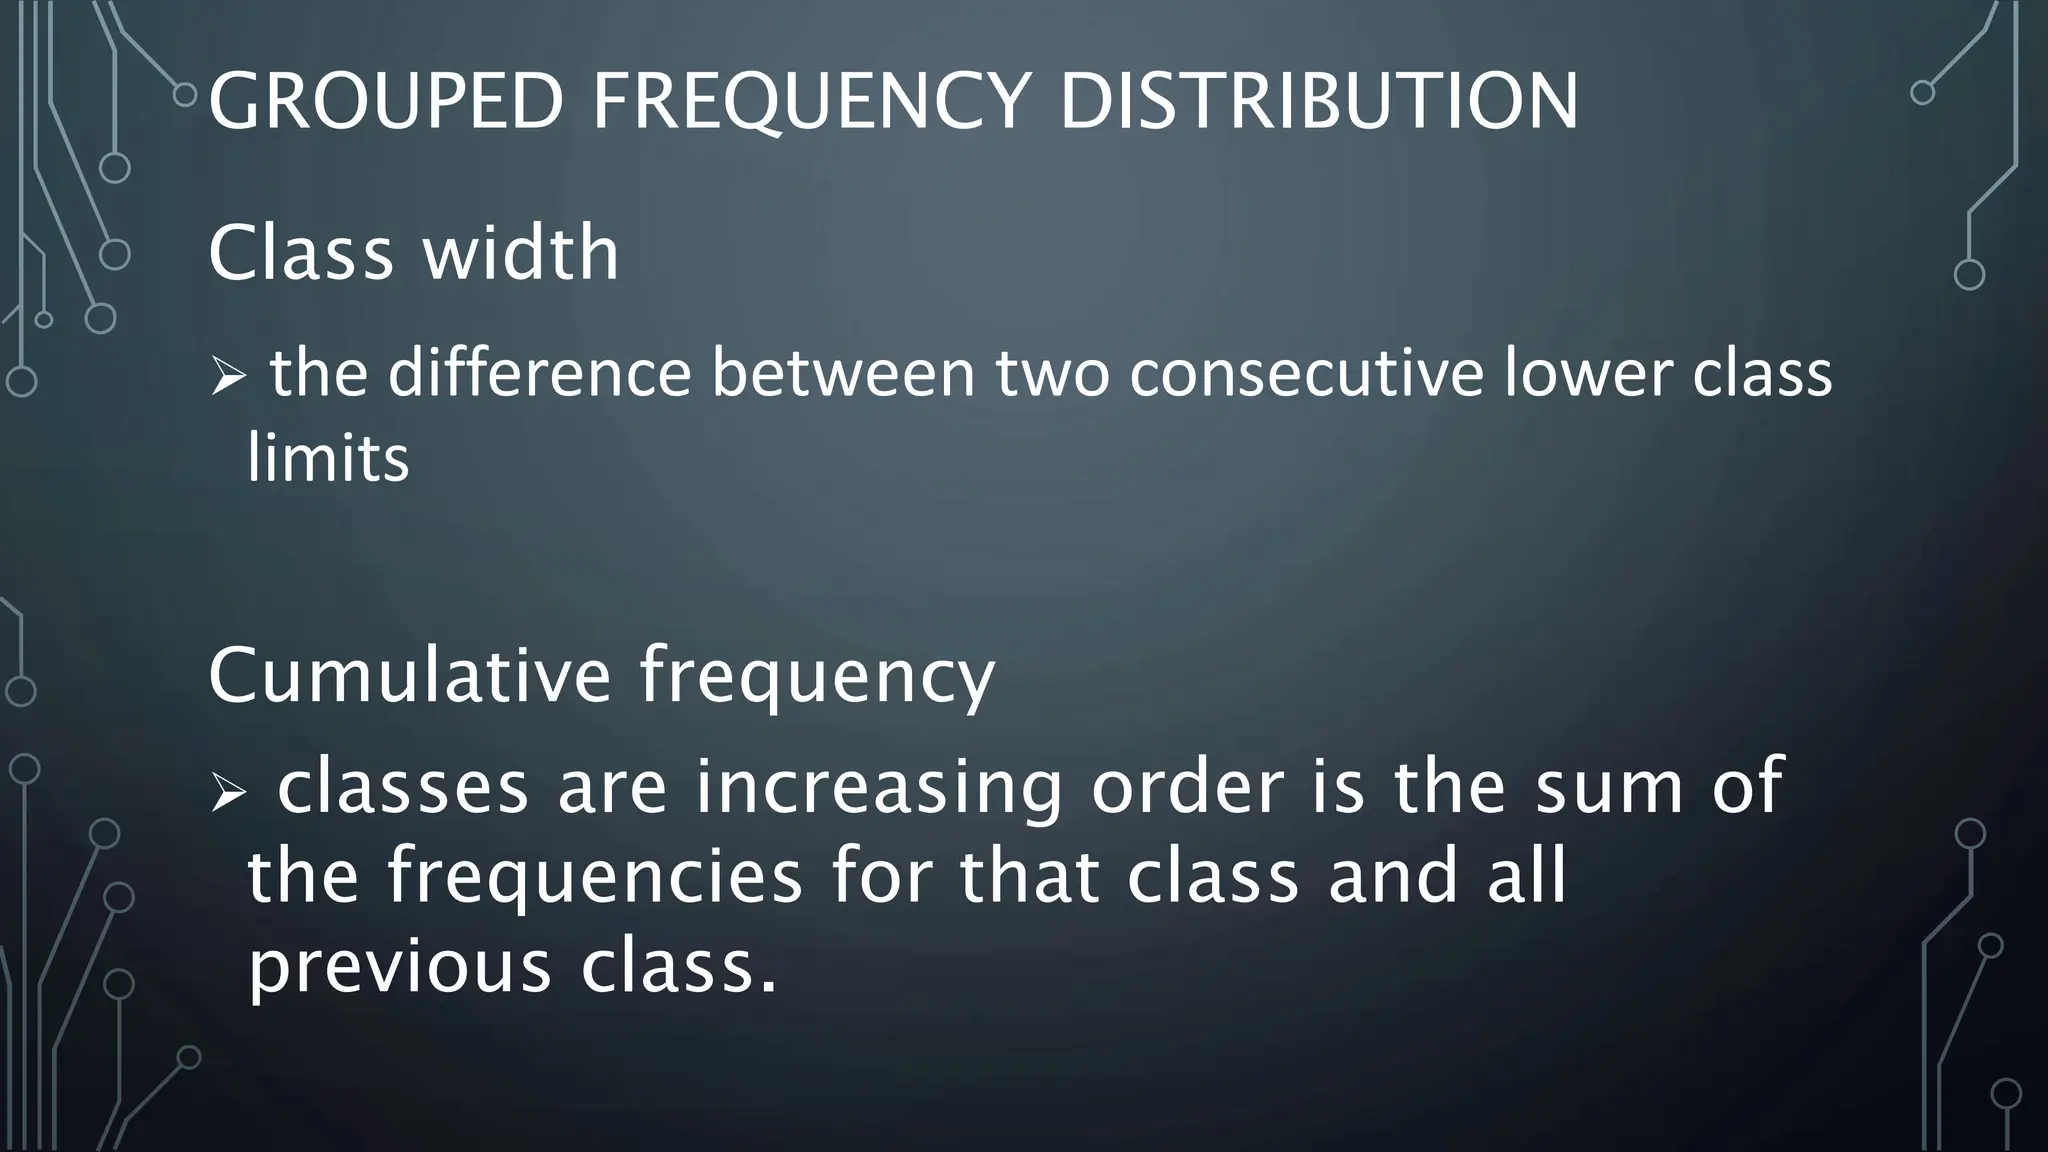
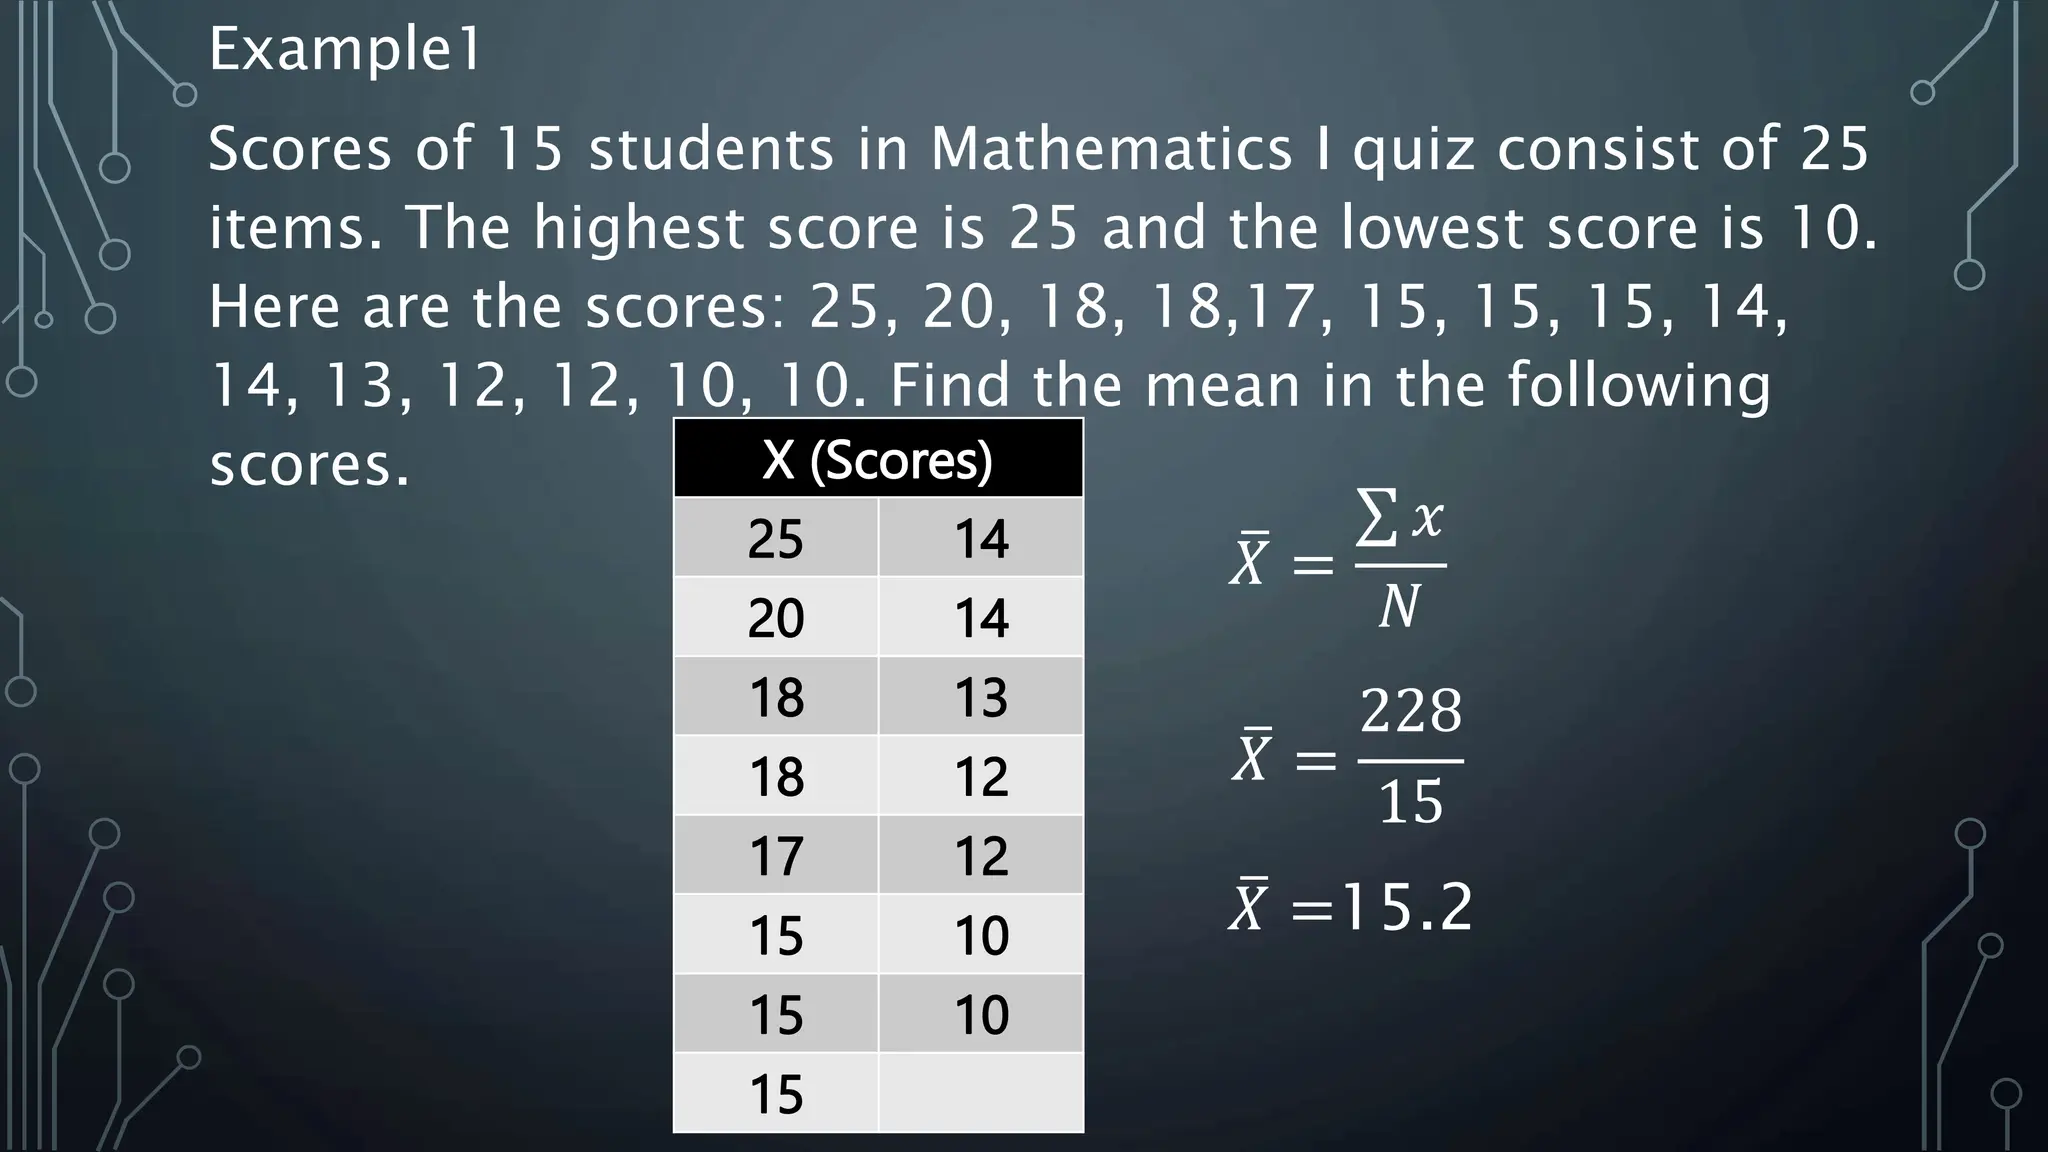
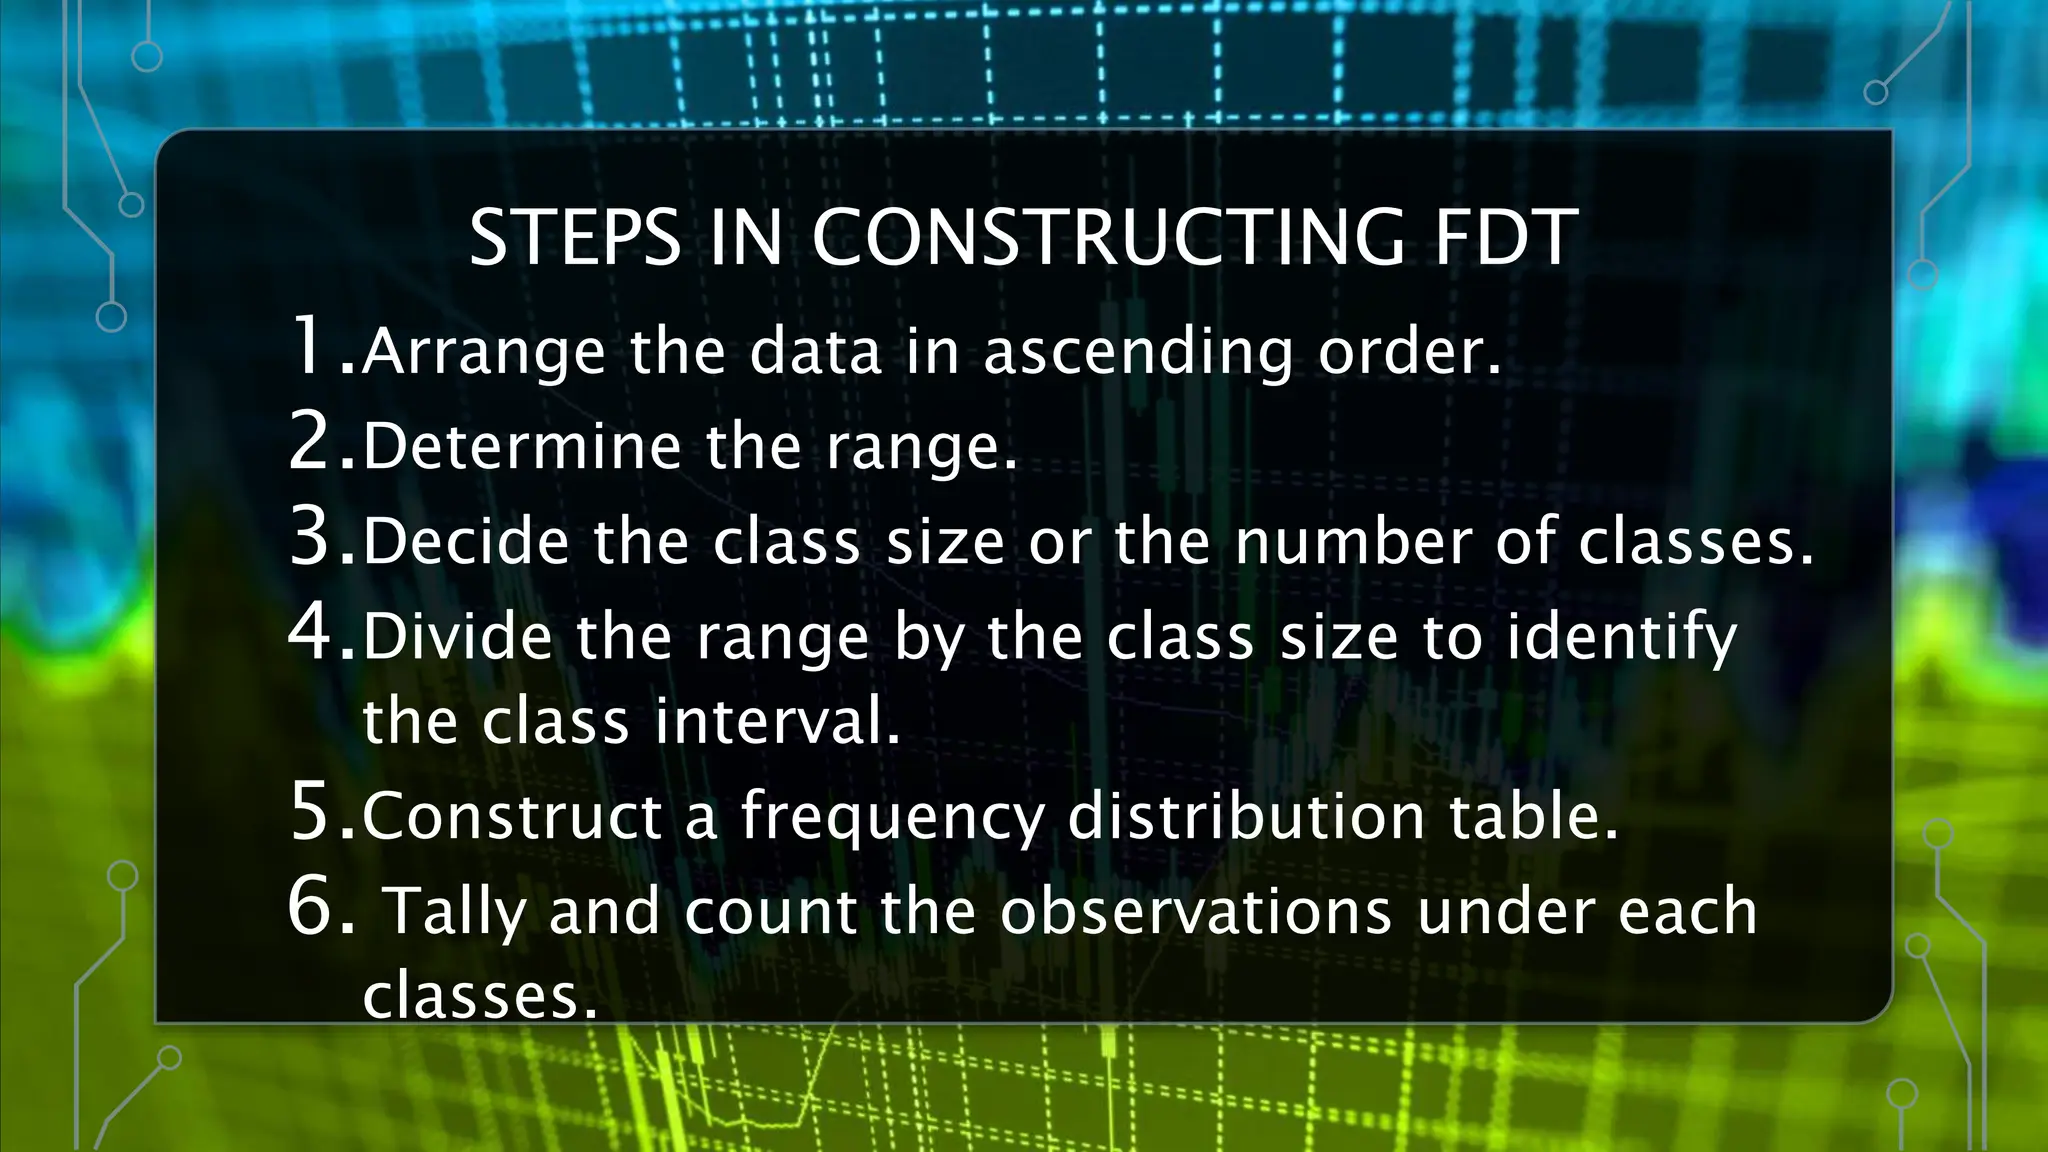
SlideShare a Scribd company logo
1 of 32
STATISTICS
MEASURES OF CENTRAL
TENDENCY
DEFINITIONS OF TERMS
• MEAN (Ungrouped Data)
 is the average of all the elements of a set of data and is
denoted by
𝑋 =
𝑥1 + 𝑥2 + 𝑥3 + 𝑥4 … 𝑥𝑛−1 + 𝑥𝑛
𝑁
=
𝑥
𝑁
Whereas,
𝑋= Mean
𝑥= Sum of all values in a data
𝑁=Total number of elements in a given data
MEDIAN (UNGROUPED)
 Is usually denoted by 𝑥. By definition, median
is the value at the middle when all the
elements in a given set of data are
arranged in ascending order.
NOTE: If n is odd number, select the middle
data value
𝑥=
𝑛+1
2
If n is even number, find the mean of the
two middle values.
MEDIAN OF A GROUPED DATA
𝑥 = 𝐶𝑙𝑏 + 𝑖
𝑁
2
−< 𝑐𝑓𝑏
𝑓𝑐
𝑥=Median
𝐶𝑙𝑏= Lower class boundary
𝑓𝑐= Median Class Frequency
𝑐𝑓𝑏= Cumulative frequency before the median class
MEDIAN CLASS
𝑀 =
𝑁
2
𝑖= Class interval
n= Total number of observation
MODE (UNGROUPED)
 defined as the element in a set of data that has the
greatest number of frequencies. It is donated by 𝑋.
The value that occurs most often in a data
set.
𝑋= Most frequent
Different types of mode:
Unimodal
Bimodal
Multimodal
No mode
MODE (GROUPED)
 𝑥 = 𝐶𝐵𝑙 +
∆𝑓𝑏
∆𝑓𝑏+∆𝑓𝑎
𝑖
Whereas:
𝑥 = 𝑀𝑜𝑑𝑒
𝐶𝐵𝑙 = 𝐿𝑜𝑤𝑒𝑟 𝑐𝑙𝑎𝑠𝑠 𝑏𝑜𝑢𝑛𝑑𝑎𝑟𝑦
∆𝑓𝑏 = 𝑀𝑜𝑑𝑎𝑙 𝑐𝑙𝑎𝑠𝑠 𝑓𝑟𝑒𝑞𝑢𝑒𝑛𝑐𝑦 𝑚𝑖𝑛𝑢𝑠 𝑓𝑟𝑒𝑞𝑢𝑒𝑛𝑐𝑦 𝑏𝑒𝑓𝑜𝑟𝑒
∆𝑓𝑎 = 𝑀𝑜𝑑𝑎𝑙 𝑐𝑙𝑎𝑠𝑠 𝑓𝑟𝑒𝑞𝑢𝑒𝑛𝑐𝑦 𝑚𝑖𝑛𝑢𝑠 𝑓𝑟𝑒𝑞𝑢𝑒𝑛𝑐𝑦 𝑎𝑓𝑡𝑒𝑟
𝑖 = 𝐶𝑙𝑎𝑠𝑠 𝑖𝑛𝑡𝑒𝑟𝑣𝑎𝑙
DEFINITIONS OF TERMS
• FREQUENCY DISTRIBUTION
 A frequency distribution is a way of presenting and
organizing the data connected in tabular form using
classes and frequencies.
The most convenient method of organizing the data
is to construct a frequency distribution in order to
describe situations, draw conclusions, or make
inferences about events, the researcher must organize
the data in some meaningful way.
GROUPED FREQUENCY DISTRIBUTION
Lower class limit
 the smallest data value that can be included in
the class.
Upper class limit
 the largest data value that can be included in
the class.
Class boundaries
 are used to separate classes so that there are
no gaps in the frequency distribution.
Class marks
 the midpoint of the classes (average)
𝑙𝑜𝑤𝑒𝑟 𝑙𝑖𝑚𝑖𝑡 + 𝑢𝑝𝑝𝑒𝑟 𝑙𝑖𝑚𝑖𝑡
GROUPED FREQUENCY DISTRIBUTION
Class width
 the difference between two consecutive lower class
limits
Cumulative frequency
 classes are increasing order is the sum of
the frequencies for that class and all
previous class.
BASIC TYPES OF FREQUENCY
DISTRIBUTION
UNGROUPED FREQUENCY
DISTRIBUTION
Classifies a given data
set (usually n≤30) under
a specific category or class.
Frequencies of each data is
treated as individual data
points or a discrete data
GROUPED FREQUENCY
DISTRIBUTION
Having an interval or a
ratio –level data, and
beyond the sample size
of 30.
Frequencies of each data
points are clustered in a
specific class interval.
EXAMPLES
UNGROUPED FREQUENCY
DISTRIBUTION
AGE TALLY FREQUENCY
19
18
17
16
15
14
GROUPED FREQUENCY
DISTRIBUTION
CLASS TALLY FREQUENCY
95-99
90-94
85-89
80-84
75-79
70-74
Example1
Scores of 15 students in Mathematics I quiz consist of 25
items. The highest score is 25 and the lowest score is 10.
Here are the scores: 25, 20, 18, 18,17, 15, 15, 15, 14,
14, 13, 12, 12, 10, 10. Find the mean in the following
scores. X (Scores)
25 14
20 14
18 13
18 12
17 12
15 10
15 10
15
𝑋 =
𝑥
𝑁
𝑋 =
228
15
𝑋 =15.2
UNGROUPED FREQUENCY DISTRIBUTION
• Twenty-five positive cases
of COVID-19 were given a
blood test to determine
their blood type. The data
set is as follows:
•A B B AB O
•O O B AB B
•B B O A O
•A O O O AB
•AB A O B A
CLASS TALLY FREQUENC
Y
A
B
O
AB
5
7
9
4
Total (N) =
25
STEPS IN CONSTRUCTING FDT
1.Arrange the data in ascending order.
2.Determine the range.
3.Decide the class size or the number of classes.
4.Divide the range by the class size to identify
the class interval.
5.Construct a frequency distribution table.
6. Tally and count the observations under each
classes.
EXAMPLE #2 GROUPED FREQUENCY
DISTRIBUTION
Step.1
Arrange the score from lowest to
highest.
The following are the scores obtained by 40
students of BSIT in 100 item Mathematics quiz.
40 41 42 44 45 46 47 48
49 50 51 52 53 54 55 56
57 58 59 60 61 61 62 63
64 64 65 65 65 66 66 70
75 75 76 76 82 84 92 98
EXAMPLE #2 GROUPED FREQUENCY
DISTRIBUTION
Step.2
Determine the range.
The following are the scores obtained by 40
students of Grade 10 in 100 item MMW quiz.
Range= Highest score-
Lowest score
Range=98-40
R= 58
40 41 42 44 45 46 47 48
49 50 51 52 53 54 55 56
57 58 59 60 61 61 62 63
64 64 65 65 65 66 66 70
75 75 76 76 82 84 92 98
EXAMPLE #2 GROUPED FREQUENCY
DISTRIBUTION
The following are the scores obtained by 40
students of Grade 10 in 100 item MMW quiz.
Sturge rule:
Step.3
Determine the class size
-A rule for determining
the desirable number of groups
into which a distribution of
observations should be
classified.
K=1+ 3.322logN
K=1+ 3.322log(40)
K=6.322 round
up
K= 7
40 41 42 44 45 46 47 48
49 50 51 52 53 54 55 56
57 58 59 60 61 61 62 63
64 64 65 65 65 66 66 70
75 75 76 76 82 84 92 98
EXAMPLE #2 GROUPED FREQUENCY
DISTRIBUTION
The following are the scores obtained by 40
students of Grade 10 in 100 item MMW quiz.
𝑪𝒘 = 𝒊 =
𝑹
𝑲
Step.4
Find the class width.
R=58,
K=7
𝑪𝒘 =
𝟓𝟖
𝟕
𝑪𝒘 =8.286 round
up
𝑪𝒘 = 9
40 41 42 44 45 46 47 48
49 50 51 52 53 54 55 56
57 58 59 60 61 61 62 63
64 64 65 65 65 66 66 70
75 75 76 76 82 84 92 98
The following are the scores obtained by 40
students of Grade 10 in 100 item MMW quiz.
Step.5
Select as starting point either the lowest score or the lower class limits. Add
the class width to the starting point to get the second lower class limits. Then enter
the upper class limits.
Class
Interval
Tally
Frequenc
y (f)
Class
mark (x)
94-102 I 1 98
85-93 I 1 89
76-84 IIII 4 80
67-75 III 3 71
58-66 IIIII-IIIII-
IIII
14 62
49-57 IIIII-IIII 9 53
40- 48 IIIII-III 8 44
𝑖 = 9
Class width (𝑪𝒘 = 𝒊) =9
number of classes (K)=7
40 41 42 44 45 46 47 48
49 50 51 52 53 54 55 56
57 58 59 60 61 61 62 63
64 64 65 65 65 66 66 70
75 75 76 76 82 84 92 98
EXAMPLE #1
Scores of 40 students of BS-Criminology in MMW
exam. Construct a frequency distribution table using
the class size of 6.
EXAMPLE #1
Scores of 40 students of BS-Criminology in MMW
exam. Construct a frequency distribution table using
the class size of 6.
EXAMPLE #1
Scores of 40 students of BS-Criminology in
MMW exam. Construct a frequency
distribution table using the class size of 6.
R= HS-LS K=6 𝒊 =
𝑹
𝑲
R= 50-9 𝐍𝐨𝐭𝐞: 𝐂𝐒 = 𝒊 𝒊 =
𝟒𝟏
𝟔
R= 41 𝒊 = 𝟔. 𝟖𝟑 = 𝟕
EXAMPLE #1
Scores Tally Frequen
cy
Class Boundaries
(CB)
Class
Mark
(CM)
𝐿𝐶𝐿 + 𝑈𝐶𝐿
2
Less than
Cumulati
ve
Frequenc
y (<Cf)
(f+Cf)
LCB
(LCL-
0.5)
UCB
(UCL+0.
5)
44-50
37-43
30-36
23-29
16-22
9-15
i= 7
EXAMPLE #1
Scores Tally Frequen
cy
Class Boundaries
(CB)
Class
Mark
(CM)
𝐿𝐶𝐿 + 𝑈𝐶𝐿
2
Less than
Cumulati
ve
Frequenc
y (<Cf)
(f+Cf
LCB
(LCL-
0.5)
UCB
(UCL+0.
5)
44-50 IIII 4
37-43 IIII-I 6
30-36 IIII-II 7
23-29 IIII-IIII-I 11
16-22 IIII-IIII-I 11
9-15 1 1
i= 7 n=40
EXAMPLE #1
Scores Tally Frequen
cy
Class Boundaries
(CB)
Class
Mark
(CM)
𝐿𝐶𝐿 + 𝑈𝐶𝐿
2
Less than
Cumulati
ve
Frequenc
y (<Cf)
(f+Cf
LCB
(LCL-
0.5)
UCB
(UCL+0.
5)
44-50 IIII 4 43.5
37-43 IIII-I 6 36.5
30-36 IIII-II 7 29.5
23-29 IIII-IIII-I 11 22.5
16-22 IIII-IIII-I 11 15.5
9-15 1 1 8.5
i= 7 n=40
EXAMPLE #1
Scores Tally Frequen
cy
Class Boundaries
(CB)
Class
Mark
(CM)
𝐿𝐶𝐿 + 𝑈𝐶𝐿
2
Less than
Cumulati
ve
Frequenc
y (<Cf)
(f+Cf
LCB
(LCL-
0.5)
UCB
(UCL+0.
5)
44-50 IIII 4 43.5 50.5
37-43 IIII-I 6 36.5 43.5
30-36 IIII-II 7 29.5 36.5
23-29 IIII-IIII-I 11 22.5 29.5
16-22 IIII-IIII-I 11 15.5 22.5
9-15 1 1 8.5 15.5
i= 7 n=40
EXAMPLE #1
Scores Tally Frequen
cy
Class Boundaries
(CB)
Class
Mark
(CM)
𝐿𝐶𝐿 + 𝑈𝐶𝐿
2
Less than
Cumulati
ve
Frequenc
y (<Cf)
(f+Cf)
LCB
(LCL-
0.5)
UCB
(UCL+0.
5)
44-50 IIII 4 43.5 55.5 47
37-43 IIII-I 6 36.5 43.5 40
30-36 IIII-II 7 29.5 36.5 33
23-29 IIII-IIII-I 11 22.5 23.5 26
16-22 IIII-IIII-I 11 15.5 22.5 19
9-15 1 1 8.5 15.5 12
i= 7 n=40
EXAMPLE #1
Scores Tally Frequen
cy
Class Boundaries
(CB)
Class
Mark
(CM)
𝐿𝐶𝐿 + 𝑈𝐶𝐿
2
Cumulati
ve
Frequenc
y (Cf)
(f+Cf)
LCB
(LCL-
0.5)
UCB
(UCL+0.
5)
44-50 IIII 4 43.5 55.5 47 40
37-43 IIII-I 6 36.5 43.5 40 36
30-36 IIII-II 7 29.5 36.5 34 30
23-29 IIII-IIII-I 11 22.5 23.5 26 23
16-22 IIII-IIII-I 11 15.5 22.5 19 12
9-15 1 1 8.5 15.5 12 1
i= 7 n=40
EVALUATION
Construct the problem using frequency
distribution.
Given 50 multiple choice items in their final
test in English, the score of the students are
the following:
EXAMPLE #3 GROUPED FREQUENCY
DISTRIBUTION
Step.1
Arrange the score from lowest to
highest.
Construct a frequency distribution table given
the set of data.
Ages of people going to Boracay
14 29 43
17 32 44
21 34 47
21 35 52
22 35 53
25 36 54
26 37 55
27 39 60
28 41 60
28 42 63
Answer the following:
1. Construct a frequency distribution table
given the set of data using 6 classes.

More Related Content

Similar to Frequency Distribution (Class-interval- Tally).pptx

MEASURES-OF-CENTRAL-TENDENCY-lecture-edited.pptx
MEASURES-OF-CENTRAL-TENDENCY-lecture-edited.pptxMEASURES-OF-CENTRAL-TENDENCY-lecture-edited.pptx
MEASURES-OF-CENTRAL-TENDENCY-lecture-edited.pptxJhayMarkMaltoLacsam
 
Utilization-of-assessment-data-assessmentinLearning1.pptx
Utilization-of-assessment-data-assessmentinLearning1.pptxUtilization-of-assessment-data-assessmentinLearning1.pptx
Utilization-of-assessment-data-assessmentinLearning1.pptxEdeleneGetes
 
CLASSIFICATION AND TABULATION in Biostatic
CLASSIFICATION AND TABULATION in BiostaticCLASSIFICATION AND TABULATION in Biostatic
CLASSIFICATION AND TABULATION in BiostaticMuhammad Amir Sohail
 
Chapter 3: Prsentation of Data
Chapter 3: Prsentation of DataChapter 3: Prsentation of Data
Chapter 3: Prsentation of DataAndrilyn Alcantara
 
Education 309 – Statistics for Educational Research
Education 309 – Statistics for Educational ResearchEducation 309 – Statistics for Educational Research
Education 309 – Statistics for Educational ResearchSzarah Blaisze
 
Jrhighppt.ppt about frequency distribution
Jrhighppt.ppt about frequency distributionJrhighppt.ppt about frequency distribution
Jrhighppt.ppt about frequency distributionCherelynAceboOchavez
 
Day2 session i&amp;ii - spss
Day2 session i&amp;ii - spssDay2 session i&amp;ii - spss
Day2 session i&amp;ii - spssabir hossain
 
Biostatistics Measures of central tendency
Biostatistics Measures of central tendency Biostatistics Measures of central tendency
Biostatistics Measures of central tendency HARINATHA REDDY ASWARTHA
 
Frequency Distribution Table 3
Frequency Distribution Table 3Frequency Distribution Table 3
Frequency Distribution Table 3AkkiMaruthi2
 
frequency distribution table 3
frequency distribution table 3frequency distribution table 3
frequency distribution table 3AkkiMaruthi2
 
Frequency distribution, central tendency, measures of dispersion
Frequency distribution, central tendency, measures of dispersionFrequency distribution, central tendency, measures of dispersion
Frequency distribution, central tendency, measures of dispersionDhwani Shah
 
analytical representation of data
 analytical representation of data analytical representation of data
analytical representation of dataUnsa Shakir
 
frequency distribution
 frequency distribution frequency distribution
frequency distributionUnsa Shakir
 
Measures of Central Tendancy
Measures of Central TendancyMeasures of Central Tendancy
Measures of Central TendancyMARIAPPANM4
 
Chapter 3 Summary Measures_Complete-1.pdf
Chapter 3 Summary Measures_Complete-1.pdfChapter 3 Summary Measures_Complete-1.pdf
Chapter 3 Summary Measures_Complete-1.pdfCalhyneJose
 
lesson 3 presentation of data and frequency distribution
lesson 3 presentation of data and frequency distributionlesson 3 presentation of data and frequency distribution
lesson 3 presentation of data and frequency distributionNerz Baldres
 

Similar to Frequency Distribution (Class-interval- Tally).pptx (20)

STATISTICS
STATISTICSSTATISTICS
STATISTICS
 
MEASURES-OF-CENTRAL-TENDENCY-lecture-edited.pptx
MEASURES-OF-CENTRAL-TENDENCY-lecture-edited.pptxMEASURES-OF-CENTRAL-TENDENCY-lecture-edited.pptx
MEASURES-OF-CENTRAL-TENDENCY-lecture-edited.pptx
 
Utilization-of-assessment-data-assessmentinLearning1.pptx
Utilization-of-assessment-data-assessmentinLearning1.pptxUtilization-of-assessment-data-assessmentinLearning1.pptx
Utilization-of-assessment-data-assessmentinLearning1.pptx
 
CLASSIFICATION AND TABULATION in Biostatic
CLASSIFICATION AND TABULATION in BiostaticCLASSIFICATION AND TABULATION in Biostatic
CLASSIFICATION AND TABULATION in Biostatic
 
Chapter 3: Prsentation of Data
Chapter 3: Prsentation of DataChapter 3: Prsentation of Data
Chapter 3: Prsentation of Data
 
Education 309 – Statistics for Educational Research
Education 309 – Statistics for Educational ResearchEducation 309 – Statistics for Educational Research
Education 309 – Statistics for Educational Research
 
Jrhighppt.ppt about frequency distribution
Jrhighppt.ppt about frequency distributionJrhighppt.ppt about frequency distribution
Jrhighppt.ppt about frequency distribution
 
Assessment compiled
Assessment compiledAssessment compiled
Assessment compiled
 
Day2 session i&amp;ii - spss
Day2 session i&amp;ii - spssDay2 session i&amp;ii - spss
Day2 session i&amp;ii - spss
 
Biostatistics Measures of central tendency
Biostatistics Measures of central tendency Biostatistics Measures of central tendency
Biostatistics Measures of central tendency
 
Frequency Distribution Table 3
Frequency Distribution Table 3Frequency Distribution Table 3
Frequency Distribution Table 3
 
frequency distribution table 3
frequency distribution table 3frequency distribution table 3
frequency distribution table 3
 
Practice test1 solution
Practice test1 solutionPractice test1 solution
Practice test1 solution
 
Frequency distribution, central tendency, measures of dispersion
Frequency distribution, central tendency, measures of dispersionFrequency distribution, central tendency, measures of dispersion
Frequency distribution, central tendency, measures of dispersion
 
analytical representation of data
 analytical representation of data analytical representation of data
analytical representation of data
 
frequency distribution
 frequency distribution frequency distribution
frequency distribution
 
WEEK 2 QUARTER 4 MATH 10.pptx
WEEK 2 QUARTER 4 MATH 10.pptxWEEK 2 QUARTER 4 MATH 10.pptx
WEEK 2 QUARTER 4 MATH 10.pptx
 
Measures of Central Tendancy
Measures of Central TendancyMeasures of Central Tendancy
Measures of Central Tendancy
 
Chapter 3 Summary Measures_Complete-1.pdf
Chapter 3 Summary Measures_Complete-1.pdfChapter 3 Summary Measures_Complete-1.pdf
Chapter 3 Summary Measures_Complete-1.pdf
 
lesson 3 presentation of data and frequency distribution
lesson 3 presentation of data and frequency distributionlesson 3 presentation of data and frequency distribution
lesson 3 presentation of data and frequency distribution
 

More from AlwinCAsuncion

GRADE11-SENIOR HIGH SCHOOL RESEARCH PROCESS.pptx
GRADE11-SENIOR HIGH SCHOOL RESEARCH PROCESS.pptxGRADE11-SENIOR HIGH SCHOOL RESEARCH PROCESS.pptx
GRADE11-SENIOR HIGH SCHOOL RESEARCH PROCESS.pptxAlwinCAsuncion
 
Grade 11-Strand(Concept of functions).pptx
Grade 11-Strand(Concept of functions).pptxGrade 11-Strand(Concept of functions).pptx
Grade 11-Strand(Concept of functions).pptxAlwinCAsuncion
 
Grade 11 STEM (2023~2024) Hyperbolas.pptx
Grade 11 STEM (2023~2024) Hyperbolas.pptxGrade 11 STEM (2023~2024) Hyperbolas.pptx
Grade 11 STEM (2023~2024) Hyperbolas.pptxAlwinCAsuncion
 
Grade 11- Concept of functions rev.1.pptx
Grade 11- Concept of functions rev.1.pptxGrade 11- Concept of functions rev.1.pptx
Grade 11- Concept of functions rev.1.pptxAlwinCAsuncion
 
Practical Research 1:Nature-of-Research-and-Inquiry.pptx
Practical Research 1:Nature-of-Research-and-Inquiry.pptxPractical Research 1:Nature-of-Research-and-Inquiry.pptx
Practical Research 1:Nature-of-Research-and-Inquiry.pptxAlwinCAsuncion
 
Week 2-3 Evolution of Philippine Art.pptx
Week 2-3 Evolution of Philippine Art.pptxWeek 2-3 Evolution of Philippine Art.pptx
Week 2-3 Evolution of Philippine Art.pptxAlwinCAsuncion
 
Week 2-3 Evolution of Philippine Art.pptx
Week 2-3 Evolution of Philippine Art.pptxWeek 2-3 Evolution of Philippine Art.pptx
Week 2-3 Evolution of Philippine Art.pptxAlwinCAsuncion
 

More from AlwinCAsuncion (7)

GRADE11-SENIOR HIGH SCHOOL RESEARCH PROCESS.pptx
GRADE11-SENIOR HIGH SCHOOL RESEARCH PROCESS.pptxGRADE11-SENIOR HIGH SCHOOL RESEARCH PROCESS.pptx
GRADE11-SENIOR HIGH SCHOOL RESEARCH PROCESS.pptx
 
Grade 11-Strand(Concept of functions).pptx
Grade 11-Strand(Concept of functions).pptxGrade 11-Strand(Concept of functions).pptx
Grade 11-Strand(Concept of functions).pptx
 
Grade 11 STEM (2023~2024) Hyperbolas.pptx
Grade 11 STEM (2023~2024) Hyperbolas.pptxGrade 11 STEM (2023~2024) Hyperbolas.pptx
Grade 11 STEM (2023~2024) Hyperbolas.pptx
 
Grade 11- Concept of functions rev.1.pptx
Grade 11- Concept of functions rev.1.pptxGrade 11- Concept of functions rev.1.pptx
Grade 11- Concept of functions rev.1.pptx
 
Practical Research 1:Nature-of-Research-and-Inquiry.pptx
Practical Research 1:Nature-of-Research-and-Inquiry.pptxPractical Research 1:Nature-of-Research-and-Inquiry.pptx
Practical Research 1:Nature-of-Research-and-Inquiry.pptx
 
Week 2-3 Evolution of Philippine Art.pptx
Week 2-3 Evolution of Philippine Art.pptxWeek 2-3 Evolution of Philippine Art.pptx
Week 2-3 Evolution of Philippine Art.pptx
 
Week 2-3 Evolution of Philippine Art.pptx
Week 2-3 Evolution of Philippine Art.pptxWeek 2-3 Evolution of Philippine Art.pptx
Week 2-3 Evolution of Philippine Art.pptx
 

Recently uploaded

Keynote by Prof. Wurzer at Nordex about IP-design
Keynote by Prof. Wurzer at Nordex about IP-designKeynote by Prof. Wurzer at Nordex about IP-design
Keynote by Prof. Wurzer at Nordex about IP-designMIPLM
 
ENGLISH 7_Q4_LESSON 2_ Employing a Variety of Strategies for Effective Interp...
ENGLISH 7_Q4_LESSON 2_ Employing a Variety of Strategies for Effective Interp...ENGLISH 7_Q4_LESSON 2_ Employing a Variety of Strategies for Effective Interp...
ENGLISH 7_Q4_LESSON 2_ Employing a Variety of Strategies for Effective Interp...JhezDiaz1
 
Like-prefer-love -hate+verb+ing & silent letters & citizenship text.pdf
Like-prefer-love -hate+verb+ing & silent letters & citizenship text.pdfLike-prefer-love -hate+verb+ing & silent letters & citizenship text.pdf
Like-prefer-love -hate+verb+ing & silent letters & citizenship text.pdfMr Bounab Samir
 
AMERICAN LANGUAGE HUB_Level2_Student'sBook_Answerkey.pdf
AMERICAN LANGUAGE HUB_Level2_Student'sBook_Answerkey.pdfAMERICAN LANGUAGE HUB_Level2_Student'sBook_Answerkey.pdf
AMERICAN LANGUAGE HUB_Level2_Student'sBook_Answerkey.pdfphamnguyenenglishnb
 
Full Stack Web Development Course for Beginners
Full Stack Web Development Course  for BeginnersFull Stack Web Development Course  for Beginners
Full Stack Web Development Course for BeginnersSabitha Banu
 
Field Attribute Index Feature in Odoo 17
Field Attribute Index Feature in Odoo 17Field Attribute Index Feature in Odoo 17
Field Attribute Index Feature in Odoo 17Celine George
 
Alper Gobel In Media Res Media Component
Alper Gobel In Media Res Media ComponentAlper Gobel In Media Res Media Component
Alper Gobel In Media Res Media ComponentInMediaRes1
 
Roles & Responsibilities in Pharmacovigilance
Roles & Responsibilities in PharmacovigilanceRoles & Responsibilities in Pharmacovigilance
Roles & Responsibilities in PharmacovigilanceSamikshaHamane
 
Earth Day Presentation wow hello nice great
Earth Day Presentation wow hello nice greatEarth Day Presentation wow hello nice great
Earth Day Presentation wow hello nice greatYousafMalik24
 
ECONOMIC CONTEXT - LONG FORM TV DRAMA - PPT
ECONOMIC CONTEXT - LONG FORM TV DRAMA - PPTECONOMIC CONTEXT - LONG FORM TV DRAMA - PPT
ECONOMIC CONTEXT - LONG FORM TV DRAMA - PPTiammrhaywood
 
Influencing policy (training slides from Fast Track Impact)
Influencing policy (training slides from Fast Track Impact)Influencing policy (training slides from Fast Track Impact)
Influencing policy (training slides from Fast Track Impact)Mark Reed
 
What is Model Inheritance in Odoo 17 ERP
What is Model Inheritance in Odoo 17 ERPWhat is Model Inheritance in Odoo 17 ERP
What is Model Inheritance in Odoo 17 ERPCeline George
 
Introduction to AI in Higher Education_draft.pptx
Introduction to AI in Higher Education_draft.pptxIntroduction to AI in Higher Education_draft.pptx
Introduction to AI in Higher Education_draft.pptxpboyjonauth
 
Gas measurement O2,Co2,& ph) 04/2024.pptx
Gas measurement O2,Co2,& ph) 04/2024.pptxGas measurement O2,Co2,& ph) 04/2024.pptx
Gas measurement O2,Co2,& ph) 04/2024.pptxDr.Ibrahim Hassaan
 
Introduction to ArtificiaI Intelligence in Higher Education
Introduction to ArtificiaI Intelligence in Higher EducationIntroduction to ArtificiaI Intelligence in Higher Education
Introduction to ArtificiaI Intelligence in Higher Educationpboyjonauth
 

Recently uploaded (20)

Keynote by Prof. Wurzer at Nordex about IP-design
Keynote by Prof. Wurzer at Nordex about IP-designKeynote by Prof. Wurzer at Nordex about IP-design
Keynote by Prof. Wurzer at Nordex about IP-design
 
ENGLISH 7_Q4_LESSON 2_ Employing a Variety of Strategies for Effective Interp...
ENGLISH 7_Q4_LESSON 2_ Employing a Variety of Strategies for Effective Interp...ENGLISH 7_Q4_LESSON 2_ Employing a Variety of Strategies for Effective Interp...
ENGLISH 7_Q4_LESSON 2_ Employing a Variety of Strategies for Effective Interp...
 
Model Call Girl in Tilak Nagar Delhi reach out to us at 🔝9953056974🔝
Model Call Girl in Tilak Nagar Delhi reach out to us at 🔝9953056974🔝Model Call Girl in Tilak Nagar Delhi reach out to us at 🔝9953056974🔝
Model Call Girl in Tilak Nagar Delhi reach out to us at 🔝9953056974🔝
 
Like-prefer-love -hate+verb+ing & silent letters & citizenship text.pdf
Like-prefer-love -hate+verb+ing & silent letters & citizenship text.pdfLike-prefer-love -hate+verb+ing & silent letters & citizenship text.pdf
Like-prefer-love -hate+verb+ing & silent letters & citizenship text.pdf
 
Model Call Girl in Bikash Puri Delhi reach out to us at 🔝9953056974🔝
Model Call Girl in Bikash Puri  Delhi reach out to us at 🔝9953056974🔝Model Call Girl in Bikash Puri  Delhi reach out to us at 🔝9953056974🔝
Model Call Girl in Bikash Puri Delhi reach out to us at 🔝9953056974🔝
 
AMERICAN LANGUAGE HUB_Level2_Student'sBook_Answerkey.pdf
AMERICAN LANGUAGE HUB_Level2_Student'sBook_Answerkey.pdfAMERICAN LANGUAGE HUB_Level2_Student'sBook_Answerkey.pdf
AMERICAN LANGUAGE HUB_Level2_Student'sBook_Answerkey.pdf
 
Full Stack Web Development Course for Beginners
Full Stack Web Development Course  for BeginnersFull Stack Web Development Course  for Beginners
Full Stack Web Development Course for Beginners
 
Field Attribute Index Feature in Odoo 17
Field Attribute Index Feature in Odoo 17Field Attribute Index Feature in Odoo 17
Field Attribute Index Feature in Odoo 17
 
9953330565 Low Rate Call Girls In Rohini Delhi NCR
9953330565 Low Rate Call Girls In Rohini  Delhi NCR9953330565 Low Rate Call Girls In Rohini  Delhi NCR
9953330565 Low Rate Call Girls In Rohini Delhi NCR
 
Alper Gobel In Media Res Media Component
Alper Gobel In Media Res Media ComponentAlper Gobel In Media Res Media Component
Alper Gobel In Media Res Media Component
 
Roles & Responsibilities in Pharmacovigilance
Roles & Responsibilities in PharmacovigilanceRoles & Responsibilities in Pharmacovigilance
Roles & Responsibilities in Pharmacovigilance
 
Earth Day Presentation wow hello nice great
Earth Day Presentation wow hello nice greatEarth Day Presentation wow hello nice great
Earth Day Presentation wow hello nice great
 
ECONOMIC CONTEXT - LONG FORM TV DRAMA - PPT
ECONOMIC CONTEXT - LONG FORM TV DRAMA - PPTECONOMIC CONTEXT - LONG FORM TV DRAMA - PPT
ECONOMIC CONTEXT - LONG FORM TV DRAMA - PPT
 
Influencing policy (training slides from Fast Track Impact)
Influencing policy (training slides from Fast Track Impact)Influencing policy (training slides from Fast Track Impact)
Influencing policy (training slides from Fast Track Impact)
 
Raw materials used in Herbal Cosmetics.pptx
Raw materials used in Herbal Cosmetics.pptxRaw materials used in Herbal Cosmetics.pptx
Raw materials used in Herbal Cosmetics.pptx
 
TataKelola dan KamSiber Kecerdasan Buatan v022.pdf
TataKelola dan KamSiber Kecerdasan Buatan v022.pdfTataKelola dan KamSiber Kecerdasan Buatan v022.pdf
TataKelola dan KamSiber Kecerdasan Buatan v022.pdf
 
What is Model Inheritance in Odoo 17 ERP
What is Model Inheritance in Odoo 17 ERPWhat is Model Inheritance in Odoo 17 ERP
What is Model Inheritance in Odoo 17 ERP
 
Introduction to AI in Higher Education_draft.pptx
Introduction to AI in Higher Education_draft.pptxIntroduction to AI in Higher Education_draft.pptx
Introduction to AI in Higher Education_draft.pptx
 
Gas measurement O2,Co2,& ph) 04/2024.pptx
Gas measurement O2,Co2,& ph) 04/2024.pptxGas measurement O2,Co2,& ph) 04/2024.pptx
Gas measurement O2,Co2,& ph) 04/2024.pptx
 
Introduction to ArtificiaI Intelligence in Higher Education
Introduction to ArtificiaI Intelligence in Higher EducationIntroduction to ArtificiaI Intelligence in Higher Education
Introduction to ArtificiaI Intelligence in Higher Education
 

Frequency Distribution (Class-interval- Tally).pptx

  • 2. DEFINITIONS OF TERMS • MEAN (Ungrouped Data)  is the average of all the elements of a set of data and is denoted by 𝑋 = 𝑥1 + 𝑥2 + 𝑥3 + 𝑥4 … 𝑥𝑛−1 + 𝑥𝑛 𝑁 = 𝑥 𝑁 Whereas, 𝑋= Mean 𝑥= Sum of all values in a data 𝑁=Total number of elements in a given data
  • 3. MEDIAN (UNGROUPED)  Is usually denoted by 𝑥. By definition, median is the value at the middle when all the elements in a given set of data are arranged in ascending order. NOTE: If n is odd number, select the middle data value 𝑥= 𝑛+1 2 If n is even number, find the mean of the two middle values.
  • 4. MEDIAN OF A GROUPED DATA 𝑥 = 𝐶𝑙𝑏 + 𝑖 𝑁 2 −< 𝑐𝑓𝑏 𝑓𝑐 𝑥=Median 𝐶𝑙𝑏= Lower class boundary 𝑓𝑐= Median Class Frequency 𝑐𝑓𝑏= Cumulative frequency before the median class MEDIAN CLASS 𝑀 = 𝑁 2 𝑖= Class interval n= Total number of observation
  • 5. MODE (UNGROUPED)  defined as the element in a set of data that has the greatest number of frequencies. It is donated by 𝑋. The value that occurs most often in a data set. 𝑋= Most frequent Different types of mode: Unimodal Bimodal Multimodal No mode
  • 6. MODE (GROUPED)  𝑥 = 𝐶𝐵𝑙 + ∆𝑓𝑏 ∆𝑓𝑏+∆𝑓𝑎 𝑖 Whereas: 𝑥 = 𝑀𝑜𝑑𝑒 𝐶𝐵𝑙 = 𝐿𝑜𝑤𝑒𝑟 𝑐𝑙𝑎𝑠𝑠 𝑏𝑜𝑢𝑛𝑑𝑎𝑟𝑦 ∆𝑓𝑏 = 𝑀𝑜𝑑𝑎𝑙 𝑐𝑙𝑎𝑠𝑠 𝑓𝑟𝑒𝑞𝑢𝑒𝑛𝑐𝑦 𝑚𝑖𝑛𝑢𝑠 𝑓𝑟𝑒𝑞𝑢𝑒𝑛𝑐𝑦 𝑏𝑒𝑓𝑜𝑟𝑒 ∆𝑓𝑎 = 𝑀𝑜𝑑𝑎𝑙 𝑐𝑙𝑎𝑠𝑠 𝑓𝑟𝑒𝑞𝑢𝑒𝑛𝑐𝑦 𝑚𝑖𝑛𝑢𝑠 𝑓𝑟𝑒𝑞𝑢𝑒𝑛𝑐𝑦 𝑎𝑓𝑡𝑒𝑟 𝑖 = 𝐶𝑙𝑎𝑠𝑠 𝑖𝑛𝑡𝑒𝑟𝑣𝑎𝑙
  • 7. DEFINITIONS OF TERMS • FREQUENCY DISTRIBUTION  A frequency distribution is a way of presenting and organizing the data connected in tabular form using classes and frequencies. The most convenient method of organizing the data is to construct a frequency distribution in order to describe situations, draw conclusions, or make inferences about events, the researcher must organize the data in some meaningful way.
  • 8. GROUPED FREQUENCY DISTRIBUTION Lower class limit  the smallest data value that can be included in the class. Upper class limit  the largest data value that can be included in the class. Class boundaries  are used to separate classes so that there are no gaps in the frequency distribution. Class marks  the midpoint of the classes (average) 𝑙𝑜𝑤𝑒𝑟 𝑙𝑖𝑚𝑖𝑡 + 𝑢𝑝𝑝𝑒𝑟 𝑙𝑖𝑚𝑖𝑡
  • 9. GROUPED FREQUENCY DISTRIBUTION Class width  the difference between two consecutive lower class limits Cumulative frequency  classes are increasing order is the sum of the frequencies for that class and all previous class.
  • 10. BASIC TYPES OF FREQUENCY DISTRIBUTION UNGROUPED FREQUENCY DISTRIBUTION Classifies a given data set (usually n≤30) under a specific category or class. Frequencies of each data is treated as individual data points or a discrete data GROUPED FREQUENCY DISTRIBUTION Having an interval or a ratio –level data, and beyond the sample size of 30. Frequencies of each data points are clustered in a specific class interval.
  • 11. EXAMPLES UNGROUPED FREQUENCY DISTRIBUTION AGE TALLY FREQUENCY 19 18 17 16 15 14 GROUPED FREQUENCY DISTRIBUTION CLASS TALLY FREQUENCY 95-99 90-94 85-89 80-84 75-79 70-74
  • 12. Example1 Scores of 15 students in Mathematics I quiz consist of 25 items. The highest score is 25 and the lowest score is 10. Here are the scores: 25, 20, 18, 18,17, 15, 15, 15, 14, 14, 13, 12, 12, 10, 10. Find the mean in the following scores. X (Scores) 25 14 20 14 18 13 18 12 17 12 15 10 15 10 15 𝑋 = 𝑥 𝑁 𝑋 = 228 15 𝑋 =15.2
  • 13. UNGROUPED FREQUENCY DISTRIBUTION • Twenty-five positive cases of COVID-19 were given a blood test to determine their blood type. The data set is as follows: •A B B AB O •O O B AB B •B B O A O •A O O O AB •AB A O B A CLASS TALLY FREQUENC Y A B O AB 5 7 9 4 Total (N) = 25
  • 14. STEPS IN CONSTRUCTING FDT 1.Arrange the data in ascending order. 2.Determine the range. 3.Decide the class size or the number of classes. 4.Divide the range by the class size to identify the class interval. 5.Construct a frequency distribution table. 6. Tally and count the observations under each classes.
  • 15. EXAMPLE #2 GROUPED FREQUENCY DISTRIBUTION Step.1 Arrange the score from lowest to highest. The following are the scores obtained by 40 students of BSIT in 100 item Mathematics quiz. 40 41 42 44 45 46 47 48 49 50 51 52 53 54 55 56 57 58 59 60 61 61 62 63 64 64 65 65 65 66 66 70 75 75 76 76 82 84 92 98
  • 16. EXAMPLE #2 GROUPED FREQUENCY DISTRIBUTION Step.2 Determine the range. The following are the scores obtained by 40 students of Grade 10 in 100 item MMW quiz. Range= Highest score- Lowest score Range=98-40 R= 58 40 41 42 44 45 46 47 48 49 50 51 52 53 54 55 56 57 58 59 60 61 61 62 63 64 64 65 65 65 66 66 70 75 75 76 76 82 84 92 98
  • 17. EXAMPLE #2 GROUPED FREQUENCY DISTRIBUTION The following are the scores obtained by 40 students of Grade 10 in 100 item MMW quiz. Sturge rule: Step.3 Determine the class size -A rule for determining the desirable number of groups into which a distribution of observations should be classified. K=1+ 3.322logN K=1+ 3.322log(40) K=6.322 round up K= 7 40 41 42 44 45 46 47 48 49 50 51 52 53 54 55 56 57 58 59 60 61 61 62 63 64 64 65 65 65 66 66 70 75 75 76 76 82 84 92 98
  • 18. EXAMPLE #2 GROUPED FREQUENCY DISTRIBUTION The following are the scores obtained by 40 students of Grade 10 in 100 item MMW quiz. 𝑪𝒘 = 𝒊 = 𝑹 𝑲 Step.4 Find the class width. R=58, K=7 𝑪𝒘 = 𝟓𝟖 𝟕 𝑪𝒘 =8.286 round up 𝑪𝒘 = 9 40 41 42 44 45 46 47 48 49 50 51 52 53 54 55 56 57 58 59 60 61 61 62 63 64 64 65 65 65 66 66 70 75 75 76 76 82 84 92 98
  • 19. The following are the scores obtained by 40 students of Grade 10 in 100 item MMW quiz. Step.5 Select as starting point either the lowest score or the lower class limits. Add the class width to the starting point to get the second lower class limits. Then enter the upper class limits. Class Interval Tally Frequenc y (f) Class mark (x) 94-102 I 1 98 85-93 I 1 89 76-84 IIII 4 80 67-75 III 3 71 58-66 IIIII-IIIII- IIII 14 62 49-57 IIIII-IIII 9 53 40- 48 IIIII-III 8 44 𝑖 = 9 Class width (𝑪𝒘 = 𝒊) =9 number of classes (K)=7 40 41 42 44 45 46 47 48 49 50 51 52 53 54 55 56 57 58 59 60 61 61 62 63 64 64 65 65 65 66 66 70 75 75 76 76 82 84 92 98
  • 20. EXAMPLE #1 Scores of 40 students of BS-Criminology in MMW exam. Construct a frequency distribution table using the class size of 6.
  • 21. EXAMPLE #1 Scores of 40 students of BS-Criminology in MMW exam. Construct a frequency distribution table using the class size of 6.
  • 22. EXAMPLE #1 Scores of 40 students of BS-Criminology in MMW exam. Construct a frequency distribution table using the class size of 6. R= HS-LS K=6 𝒊 = 𝑹 𝑲 R= 50-9 𝐍𝐨𝐭𝐞: 𝐂𝐒 = 𝒊 𝒊 = 𝟒𝟏 𝟔 R= 41 𝒊 = 𝟔. 𝟖𝟑 = 𝟕
  • 23. EXAMPLE #1 Scores Tally Frequen cy Class Boundaries (CB) Class Mark (CM) 𝐿𝐶𝐿 + 𝑈𝐶𝐿 2 Less than Cumulati ve Frequenc y (<Cf) (f+Cf) LCB (LCL- 0.5) UCB (UCL+0. 5) 44-50 37-43 30-36 23-29 16-22 9-15 i= 7
  • 24. EXAMPLE #1 Scores Tally Frequen cy Class Boundaries (CB) Class Mark (CM) 𝐿𝐶𝐿 + 𝑈𝐶𝐿 2 Less than Cumulati ve Frequenc y (<Cf) (f+Cf LCB (LCL- 0.5) UCB (UCL+0. 5) 44-50 IIII 4 37-43 IIII-I 6 30-36 IIII-II 7 23-29 IIII-IIII-I 11 16-22 IIII-IIII-I 11 9-15 1 1 i= 7 n=40
  • 25. EXAMPLE #1 Scores Tally Frequen cy Class Boundaries (CB) Class Mark (CM) 𝐿𝐶𝐿 + 𝑈𝐶𝐿 2 Less than Cumulati ve Frequenc y (<Cf) (f+Cf LCB (LCL- 0.5) UCB (UCL+0. 5) 44-50 IIII 4 43.5 37-43 IIII-I 6 36.5 30-36 IIII-II 7 29.5 23-29 IIII-IIII-I 11 22.5 16-22 IIII-IIII-I 11 15.5 9-15 1 1 8.5 i= 7 n=40
  • 26. EXAMPLE #1 Scores Tally Frequen cy Class Boundaries (CB) Class Mark (CM) 𝐿𝐶𝐿 + 𝑈𝐶𝐿 2 Less than Cumulati ve Frequenc y (<Cf) (f+Cf LCB (LCL- 0.5) UCB (UCL+0. 5) 44-50 IIII 4 43.5 50.5 37-43 IIII-I 6 36.5 43.5 30-36 IIII-II 7 29.5 36.5 23-29 IIII-IIII-I 11 22.5 29.5 16-22 IIII-IIII-I 11 15.5 22.5 9-15 1 1 8.5 15.5 i= 7 n=40
  • 27. EXAMPLE #1 Scores Tally Frequen cy Class Boundaries (CB) Class Mark (CM) 𝐿𝐶𝐿 + 𝑈𝐶𝐿 2 Less than Cumulati ve Frequenc y (<Cf) (f+Cf) LCB (LCL- 0.5) UCB (UCL+0. 5) 44-50 IIII 4 43.5 55.5 47 37-43 IIII-I 6 36.5 43.5 40 30-36 IIII-II 7 29.5 36.5 33 23-29 IIII-IIII-I 11 22.5 23.5 26 16-22 IIII-IIII-I 11 15.5 22.5 19 9-15 1 1 8.5 15.5 12 i= 7 n=40
  • 28. EXAMPLE #1 Scores Tally Frequen cy Class Boundaries (CB) Class Mark (CM) 𝐿𝐶𝐿 + 𝑈𝐶𝐿 2 Cumulati ve Frequenc y (Cf) (f+Cf) LCB (LCL- 0.5) UCB (UCL+0. 5) 44-50 IIII 4 43.5 55.5 47 40 37-43 IIII-I 6 36.5 43.5 40 36 30-36 IIII-II 7 29.5 36.5 34 30 23-29 IIII-IIII-I 11 22.5 23.5 26 23 16-22 IIII-IIII-I 11 15.5 22.5 19 12 9-15 1 1 8.5 15.5 12 1 i= 7 n=40
  • 30. Construct the problem using frequency distribution. Given 50 multiple choice items in their final test in English, the score of the students are the following:
  • 31. EXAMPLE #3 GROUPED FREQUENCY DISTRIBUTION Step.1 Arrange the score from lowest to highest. Construct a frequency distribution table given the set of data. Ages of people going to Boracay 14 29 43 17 32 44 21 34 47 21 35 52 22 35 53 25 36 54 26 37 55 27 39 60 28 41 60 28 42 63
  • 32. Answer the following: 1. Construct a frequency distribution table given the set of data using 6 classes.

Editor's Notes

  1. Measures of Central tendency is a value that describes to which a set of data be likely to fall.