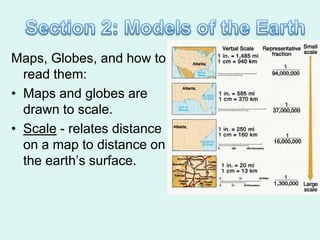
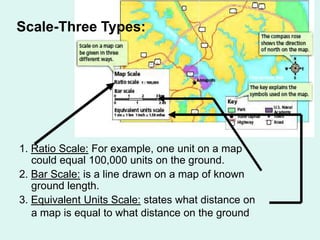
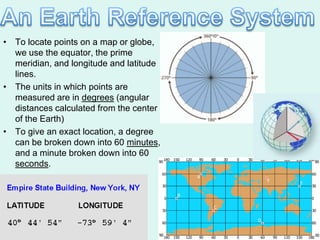
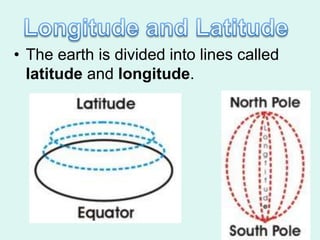
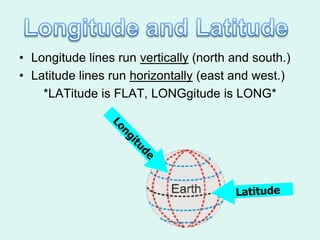
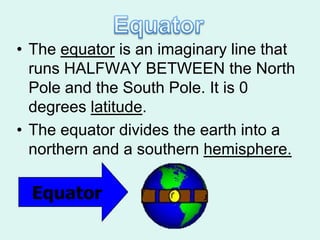
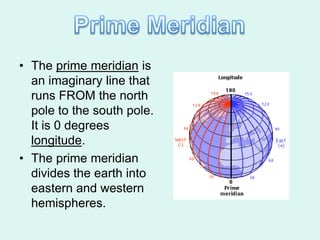
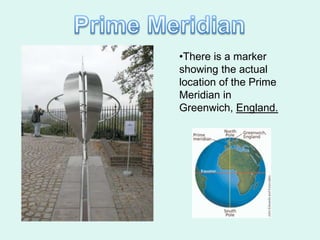
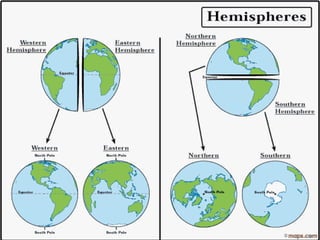
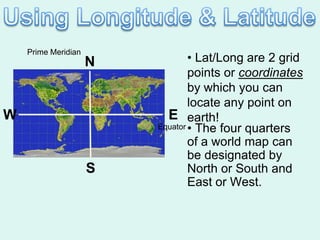
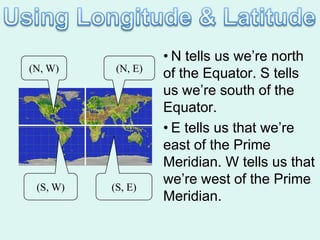
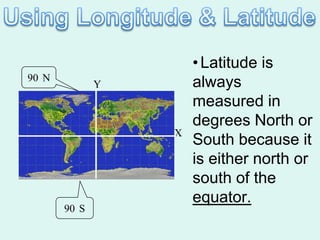
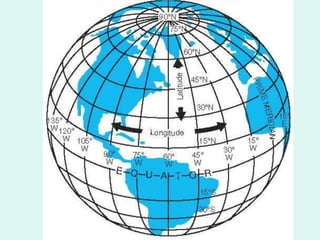
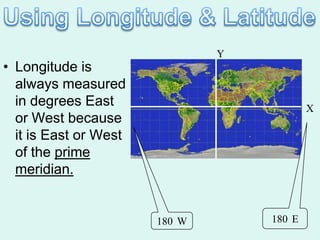
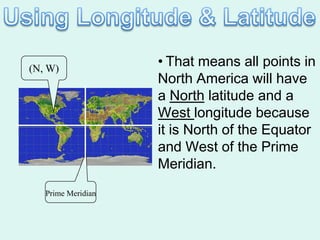
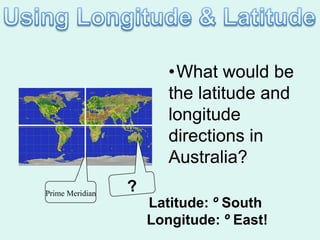
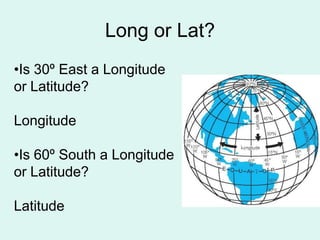
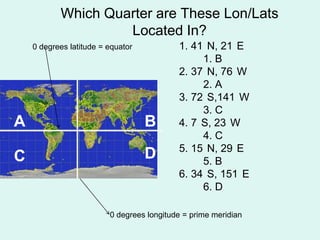
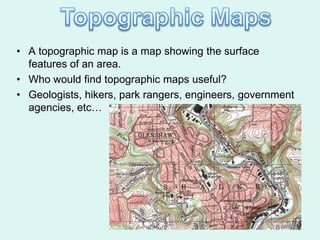
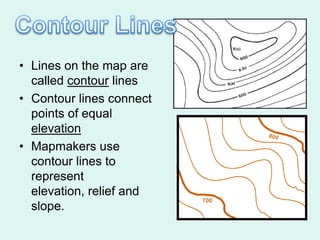
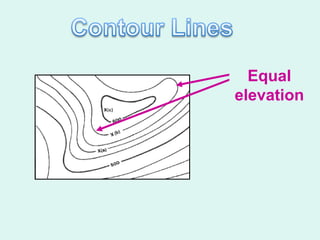
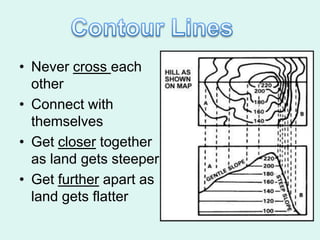
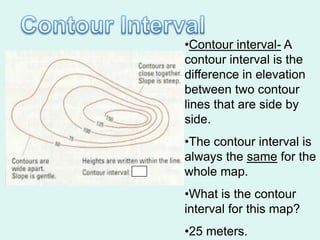
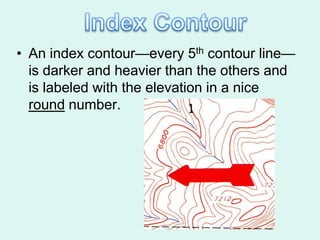
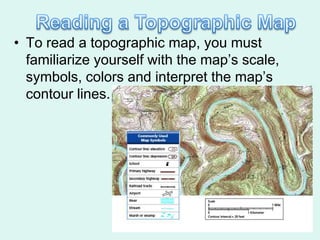
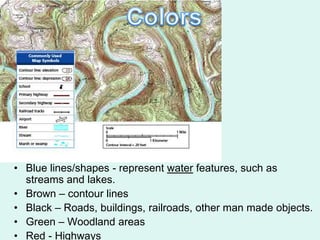
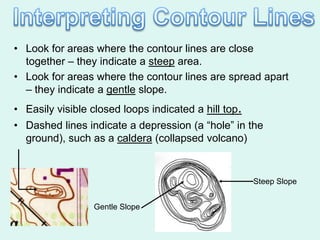
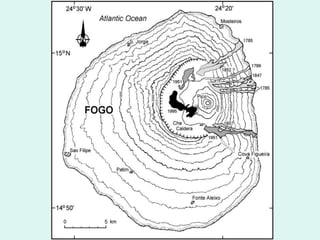
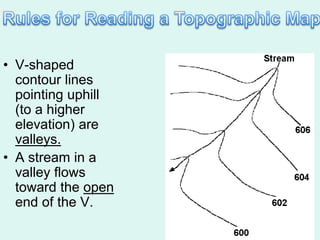
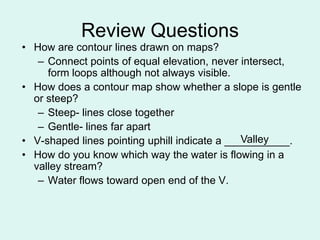
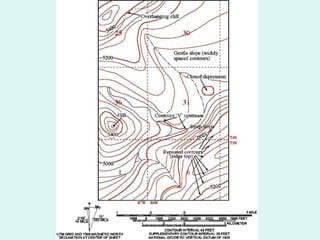
Maps, Globes, and how to
  read them:
• Maps and globes are
  drawn to scale.
• Scale - relates distance
  on a map to distance on
  the earth’s surface.
Scale-Three Types:


1. Ratio Scale: For example, one unit on a map
   could equal 100,000 units on the ground.
2. Bar Scale: is a line drawn on a map of known
   ground length.
3. Equivalent Units Scale: states what distance on
   a map is equal to what distance on the ground
• To locate points on a map or globe,
  we use the equator, the prime
  meridian, and longitude and latitude
  lines.
• The units in which points are
  measured are in degrees (angular
  distances calculated from the center
  of the Earth)
• To give an exact location, a degree
  can be broken down into 60 minutes,
  and a minute broken down into 60
  seconds.
• The earth is divided into lines called
  latitude and longitude.
• Longitude lines run vertically (north and south.)
• Latitude lines run horizontally (east and west.)
    *LATitude is FLAT, LONGgitude is LONG*
• The equator is an imaginary line that
  runs HALFWAY BETWEEN the North
  Pole and the South Pole. It is 0
  degrees latitude.
• The equator divides the earth into a
  northern and a southern hemisphere.

  Equator
• The prime meridian is
  an imaginary line that
  runs FROM the north
  pole to the south pole.
  It is 0 degrees
  longitude.
• The prime meridian
  divides the earth into
  eastern and western
  hemispheres.
•There is a marker
showing the actual
location of the Prime
Meridian in
Greenwich, England.
Prime Meridian
                     N           • Lat/Long are 2 grid
                                 points or coordinates
                                 by which you can
                                 locate any point on
W                          E earth!
                         Equator • The four quarters

                                 of a world map can
                                 be designated by
                     S           North or South and
                                 East or West.
• N tells us we’re north
(N, W)     (N, E)
                    of the Equator. S tells
                    us we’re south of the
                    Equator.
                    • E tells us that we’re
                    east of the Prime
                    Meridian. W tells us that
 (S, W)   (S, E)
                    we’re west of the Prime
                    Meridian.
• Latitude is
90 N
              Y       always
                      measured in
                      degrees North or
                  X
                      South because it
                      is either north or
                      south of the
                      equator.
       90 S
Y
• Longitude is
  always measured
  in degrees East                          X
  or West because
  it is East or West
  of the prime
  meridian.


                       180 W       180 E
(N, W)
                    • That means all points in
                    North America will have
                    a North latitude and a
                    West longitude because
                    it is North of the Equator
                    and West of the Prime
                    Meridian.
   Prime Meridian
•What would be
                    the latitude and
                    longitude
                    directions in
                    Australia?
Prime Meridian
                 Latitude: Âş South
                 Longitude: Âş East!
Long or Lat?
•Is 30º East a Longitude
or Latitude?

Longitude

•Is 60º South a Longitude
or Latitude?

Latitude
Which Quarter are These Lon/Lats
                    Located In?
    0 degrees latitude = equator           1. 41 N, 21 E
                                                1. B
                                           2. 37 N, 76 W
                                                2. A
                                           3. 72 S,141 W
                                                3. C
A                                  B       4. 7 S, 23 W
                                                4. C
                                           5. 15 N, 29 E
C                                  D            5. B
                                           6. 34 S, 151 E
                                                6. D

                         0 degrees longitude = prime meridian
• For centuries, maps were drawn by
  hand.
• Mapmakers determined distances and
  elevation using instruments in a
  process called surveying.
• Now, computers are used to make
  maps.
• Where do computers get the
  information to make maps?
• Satellites that orbit the earth obtain
  information which assists with
  mapping (finding elevation, latitude
  longitude, and ground covering),
  measure environmental change,
  determine urban growth, etc.
• The Landsat satellite program
  began in 1972.
• Landsat satellites collect               Landsat satellite
  information which is used to make
  digital satellite images.
• Landsat satellites record radiation from the
  surface of the earth in different wavelengths of
  the electromagnetic spectrum. Much of this
  radiation we cannot see (ex. infrared).
• Computers create images from the radiation and
  add ―false-color‖ to the wavelengths that we can
  not normally see. We can learn to identify
  specific features by the colors of a satellite
  image.
• Grass, trees, crops-red
• Water-black or blue
• Cities-bluish gray
• GPS (Global
  Positioning System) is
  a system of satellites
  that can be used to
  make maps.
• 3 or 4 satellites are
  needed to pinpoint
  the longitude, latitude,
  and elevation of a
  location.
Space Trash


http://abcnews.go.com/Technology/space-satellite-uars-adrift-
heading-earth/story?id=14534076
• A topographic map is a map showing the surface
  features of an area.
• Who would find topographic maps useful?
• Geologists, hikers, park rangers, engineers, government
  agencies, etc…
• Lines on the map are
  called contour lines
• Contour lines connect
  points of equal
  elevation
• Mapmakers use
  contour lines to
  represent
  elevation, relief and
  slope.
Equal
elevation
• Never cross each
  other
• Connect with
  themselves
• Get closer together
  as land gets steeper
• Get further apart as
  land gets flatter
•Contour interval- A
contour interval is the
difference in elevation
between two contour
lines that are side by
side.
•The contour interval is
always the same for the
whole map.
•What is the contour
interval for this map?
•25 meters.
• An index contour—every 5th contour line—
  is darker and heavier than the others and
  is labeled with the elevation in a nice
  round number.
• To read a topographic map, you must
  familiarize yourself with the map’s scale,
  symbols, colors and interpret the map’s
  contour lines.
• Blue lines/shapes - represent water features, such as
  streams and lakes.
• Brown – contour lines
• Black – Roads, buildings, railroads, other man made objects.
• Green – Woodland areas
• Red - Highways
• Look for areas where the contour lines are close
  together – they indicate a steep area.
• Look for areas where the contour lines are spread apart
  – they indicate a gentle slope.
• Easily visible closed loops indicated a hill top.
• Dashed lines indicate a depression (a ―hole‖ in the
  ground), such as a caldera (collapsed volcano)


                                                      Steep Slope


                 Gentle Slope
• V-shaped
  contour lines
  pointing uphill
  (to a higher
  elevation) are
  valleys.
• A stream in a
  valley flows
  toward the open
  end of the V.
Review Questions
• How are contour lines drawn on maps?
   – Connect points of equal elevation, never intersect,
     form loops although not always visible.
• How does a contour map show whether a slope is gentle
  or steep?
   – Steep- lines close together
   – Gentle- lines far apart
• V-shaped lines pointing uphill indicate a ___________.
                                               Valley
• How do you know which way the water is flowing in a
  valley stream?
   – Water flows toward open end of the V.
Chapter 2 - Mapping

Chapter 2 - Mapping

  • 2.
    Maps, Globes, andhow to read them: • Maps and globes are drawn to scale. • Scale - relates distance on a map to distance on the earth’s surface.
  • 3.
    Scale-Three Types: 1. RatioScale: For example, one unit on a map could equal 100,000 units on the ground. 2. Bar Scale: is a line drawn on a map of known ground length. 3. Equivalent Units Scale: states what distance on a map is equal to what distance on the ground
  • 4.
    • To locatepoints on a map or globe, we use the equator, the prime meridian, and longitude and latitude lines. • The units in which points are measured are in degrees (angular distances calculated from the center of the Earth) • To give an exact location, a degree can be broken down into 60 minutes, and a minute broken down into 60 seconds.
  • 5.
    • The earthis divided into lines called latitude and longitude.
  • 6.
    • Longitude linesrun vertically (north and south.) • Latitude lines run horizontally (east and west.) *LATitude is FLAT, LONGgitude is LONG*
  • 7.
    • The equatoris an imaginary line that runs HALFWAY BETWEEN the North Pole and the South Pole. It is 0 degrees latitude. • The equator divides the earth into a northern and a southern hemisphere. Equator
  • 8.
    • The primemeridian is an imaginary line that runs FROM the north pole to the south pole. It is 0 degrees longitude. • The prime meridian divides the earth into eastern and western hemispheres.
  • 9.
    •There is amarker showing the actual location of the Prime Meridian in Greenwich, England.
  • 11.
    Prime Meridian N • Lat/Long are 2 grid points or coordinates by which you can locate any point on W E earth! Equator • The four quarters of a world map can be designated by S North or South and East or West.
  • 12.
    • N tellsus we’re north (N, W) (N, E) of the Equator. S tells us we’re south of the Equator. • E tells us that we’re east of the Prime Meridian. W tells us that (S, W) (S, E) we’re west of the Prime Meridian.
  • 13.
    • Latitude is 90N Y always measured in degrees North or X South because it is either north or south of the equator. 90 S
  • 15.
    Y • Longitude is always measured in degrees East X or West because it is East or West of the prime meridian. 180 W 180 E
  • 16.
    (N, W) • That means all points in North America will have a North latitude and a West longitude because it is North of the Equator and West of the Prime Meridian. Prime Meridian
  • 17.
    •What would be the latitude and longitude directions in Australia? Prime Meridian Latitude: º South Longitude: º East!
  • 18.
    Long or Lat? •Is30º East a Longitude or Latitude? Longitude •Is 60º South a Longitude or Latitude? Latitude
  • 19.
    Which Quarter areThese Lon/Lats Located In? 0 degrees latitude = equator 1. 41 N, 21 E 1. B 2. 37 N, 76 W 2. A 3. 72 S,141 W 3. C A B 4. 7 S, 23 W 4. C 5. 15 N, 29 E C D 5. B 6. 34 S, 151 E 6. D 0 degrees longitude = prime meridian
  • 20.
    • For centuries,maps were drawn by hand. • Mapmakers determined distances and elevation using instruments in a process called surveying. • Now, computers are used to make maps. • Where do computers get the information to make maps?
  • 21.
    • Satellites thatorbit the earth obtain information which assists with mapping (finding elevation, latitude longitude, and ground covering), measure environmental change, determine urban growth, etc. • The Landsat satellite program began in 1972. • Landsat satellites collect Landsat satellite information which is used to make digital satellite images.
  • 23.
    • Landsat satellitesrecord radiation from the surface of the earth in different wavelengths of the electromagnetic spectrum. Much of this radiation we cannot see (ex. infrared). • Computers create images from the radiation and add ―false-color‖ to the wavelengths that we can not normally see. We can learn to identify specific features by the colors of a satellite image. • Grass, trees, crops-red • Water-black or blue • Cities-bluish gray
  • 24.
    • GPS (Global Positioning System) is a system of satellites that can be used to make maps. • 3 or 4 satellites are needed to pinpoint the longitude, latitude, and elevation of a location.
  • 25.
  • 28.
    • A topographicmap is a map showing the surface features of an area. • Who would find topographic maps useful? • Geologists, hikers, park rangers, engineers, government agencies, etc…
  • 29.
    • Lines onthe map are called contour lines • Contour lines connect points of equal elevation • Mapmakers use contour lines to represent elevation, relief and slope.
  • 30.
  • 31.
    • Never crosseach other • Connect with themselves • Get closer together as land gets steeper • Get further apart as land gets flatter
  • 32.
    •Contour interval- A contourinterval is the difference in elevation between two contour lines that are side by side. •The contour interval is always the same for the whole map. •What is the contour interval for this map? •25 meters.
  • 33.
    • An indexcontour—every 5th contour line— is darker and heavier than the others and is labeled with the elevation in a nice round number.
  • 34.
    • To reada topographic map, you must familiarize yourself with the map’s scale, symbols, colors and interpret the map’s contour lines.
  • 35.
    • Blue lines/shapes- represent water features, such as streams and lakes. • Brown – contour lines • Black – Roads, buildings, railroads, other man made objects. • Green – Woodland areas • Red - Highways
  • 36.
    • Look forareas where the contour lines are close together – they indicate a steep area. • Look for areas where the contour lines are spread apart – they indicate a gentle slope. • Easily visible closed loops indicated a hill top. • Dashed lines indicate a depression (a ―hole‖ in the ground), such as a caldera (collapsed volcano) Steep Slope Gentle Slope
  • 38.
    • V-shaped contour lines pointing uphill (to a higher elevation) are valleys. • A stream in a valley flows toward the open end of the V.
  • 39.
    Review Questions • Howare contour lines drawn on maps? – Connect points of equal elevation, never intersect, form loops although not always visible. • How does a contour map show whether a slope is gentle or steep? – Steep- lines close together – Gentle- lines far apart • V-shaped lines pointing uphill indicate a ___________. Valley • How do you know which way the water is flowing in a valley stream? – Water flows toward open end of the V.