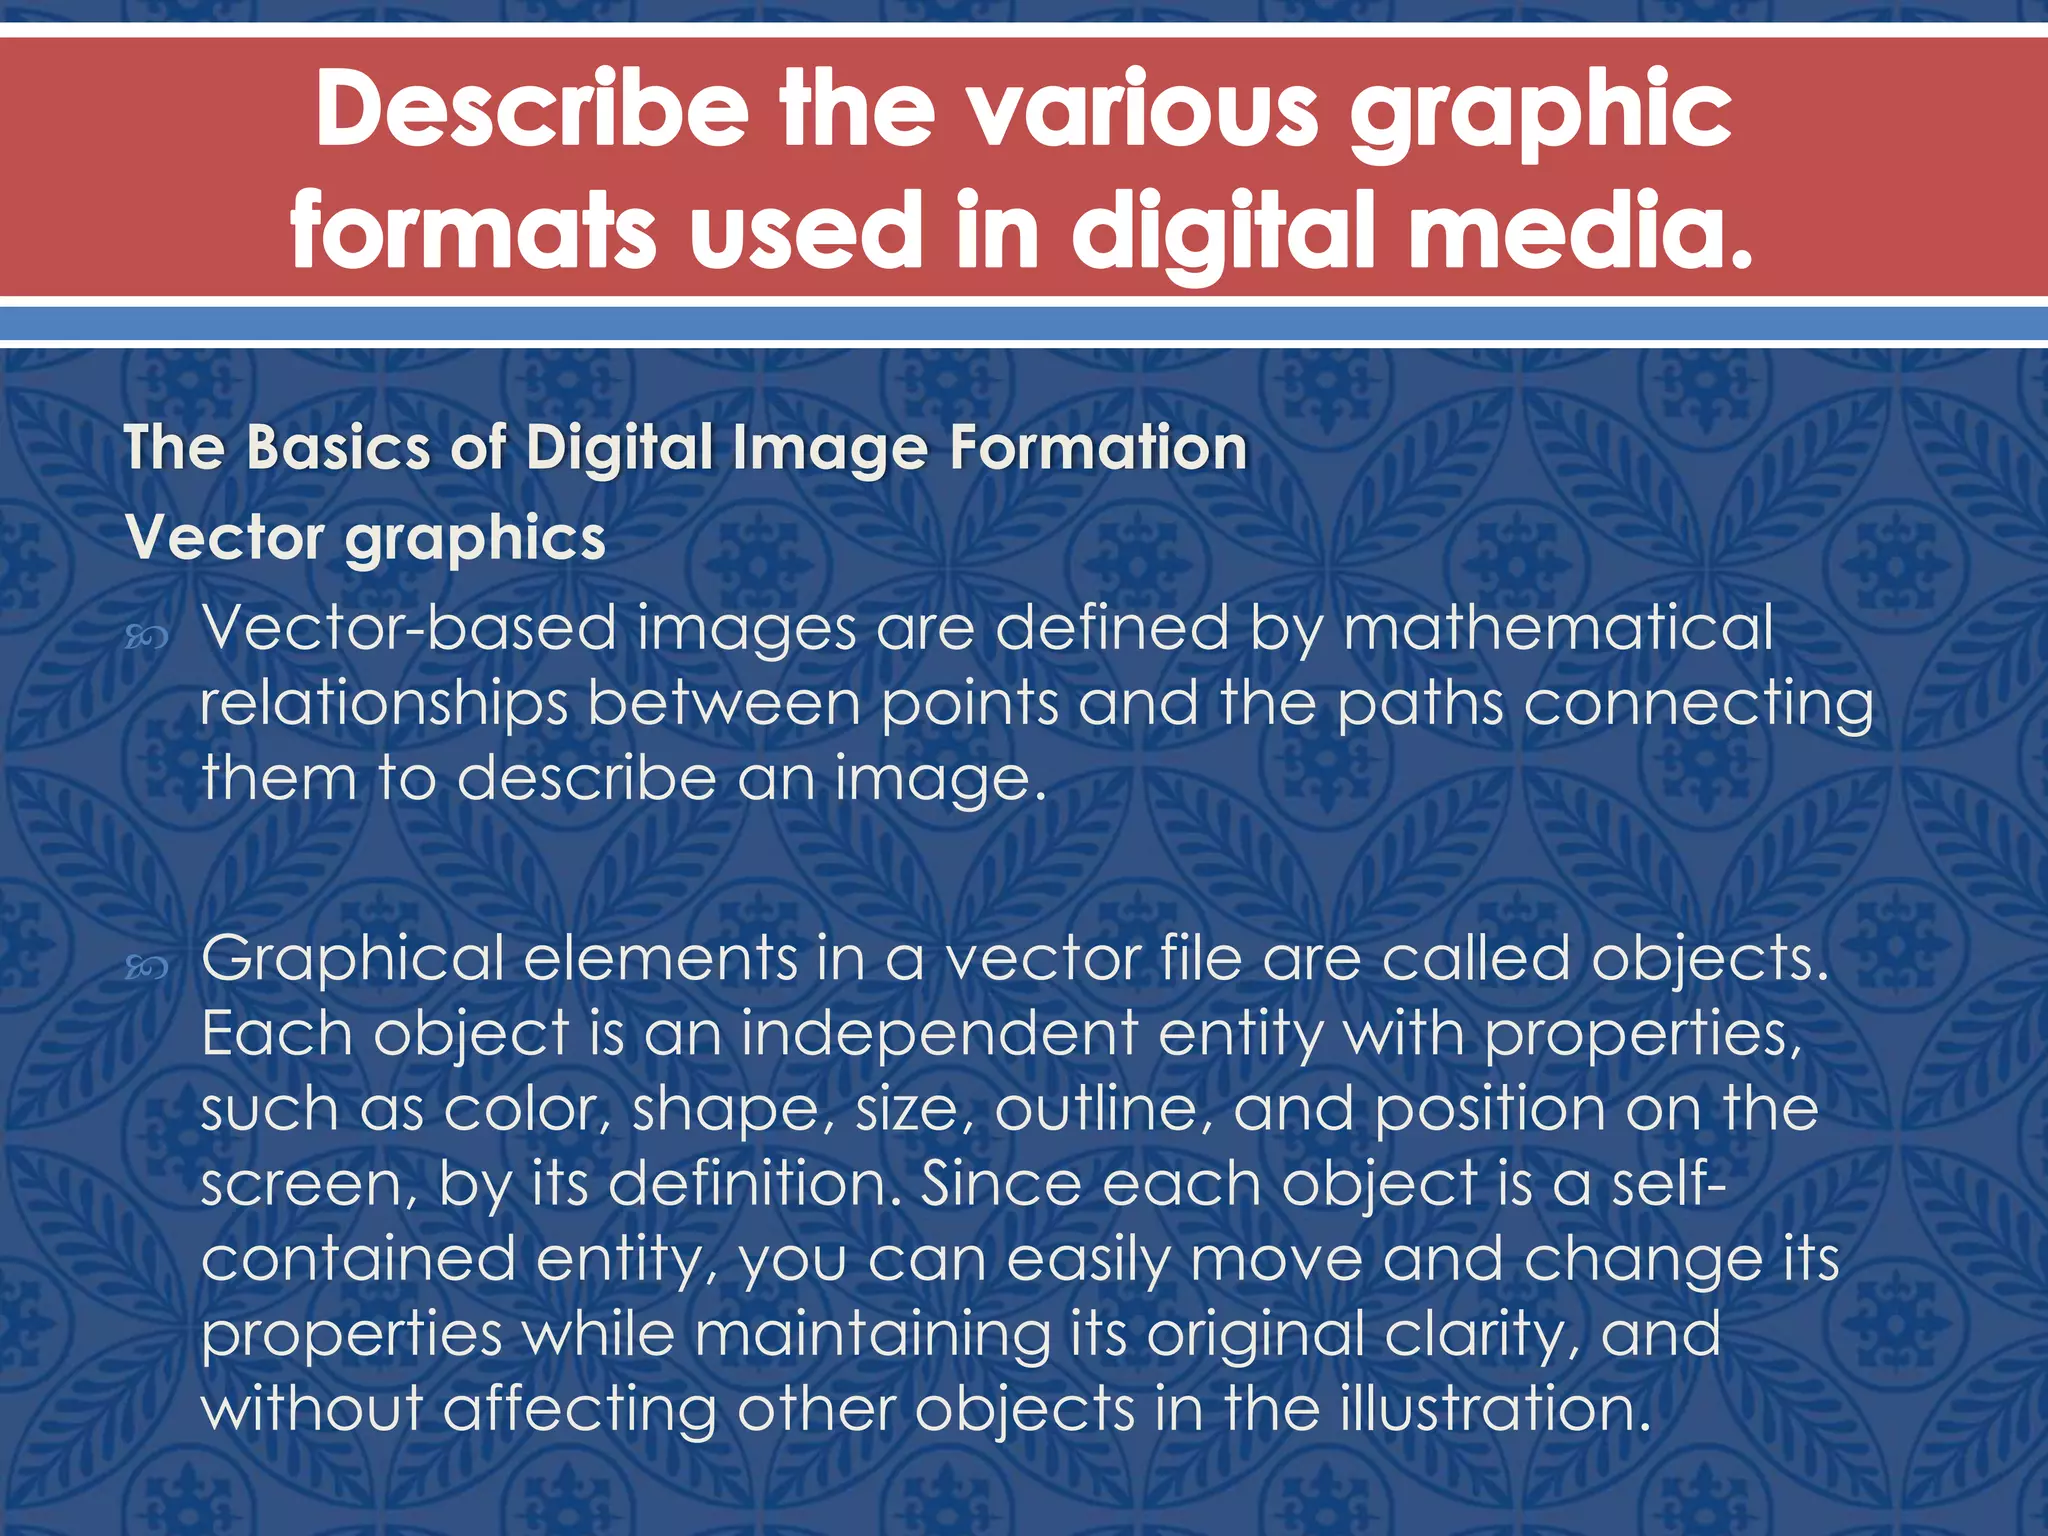
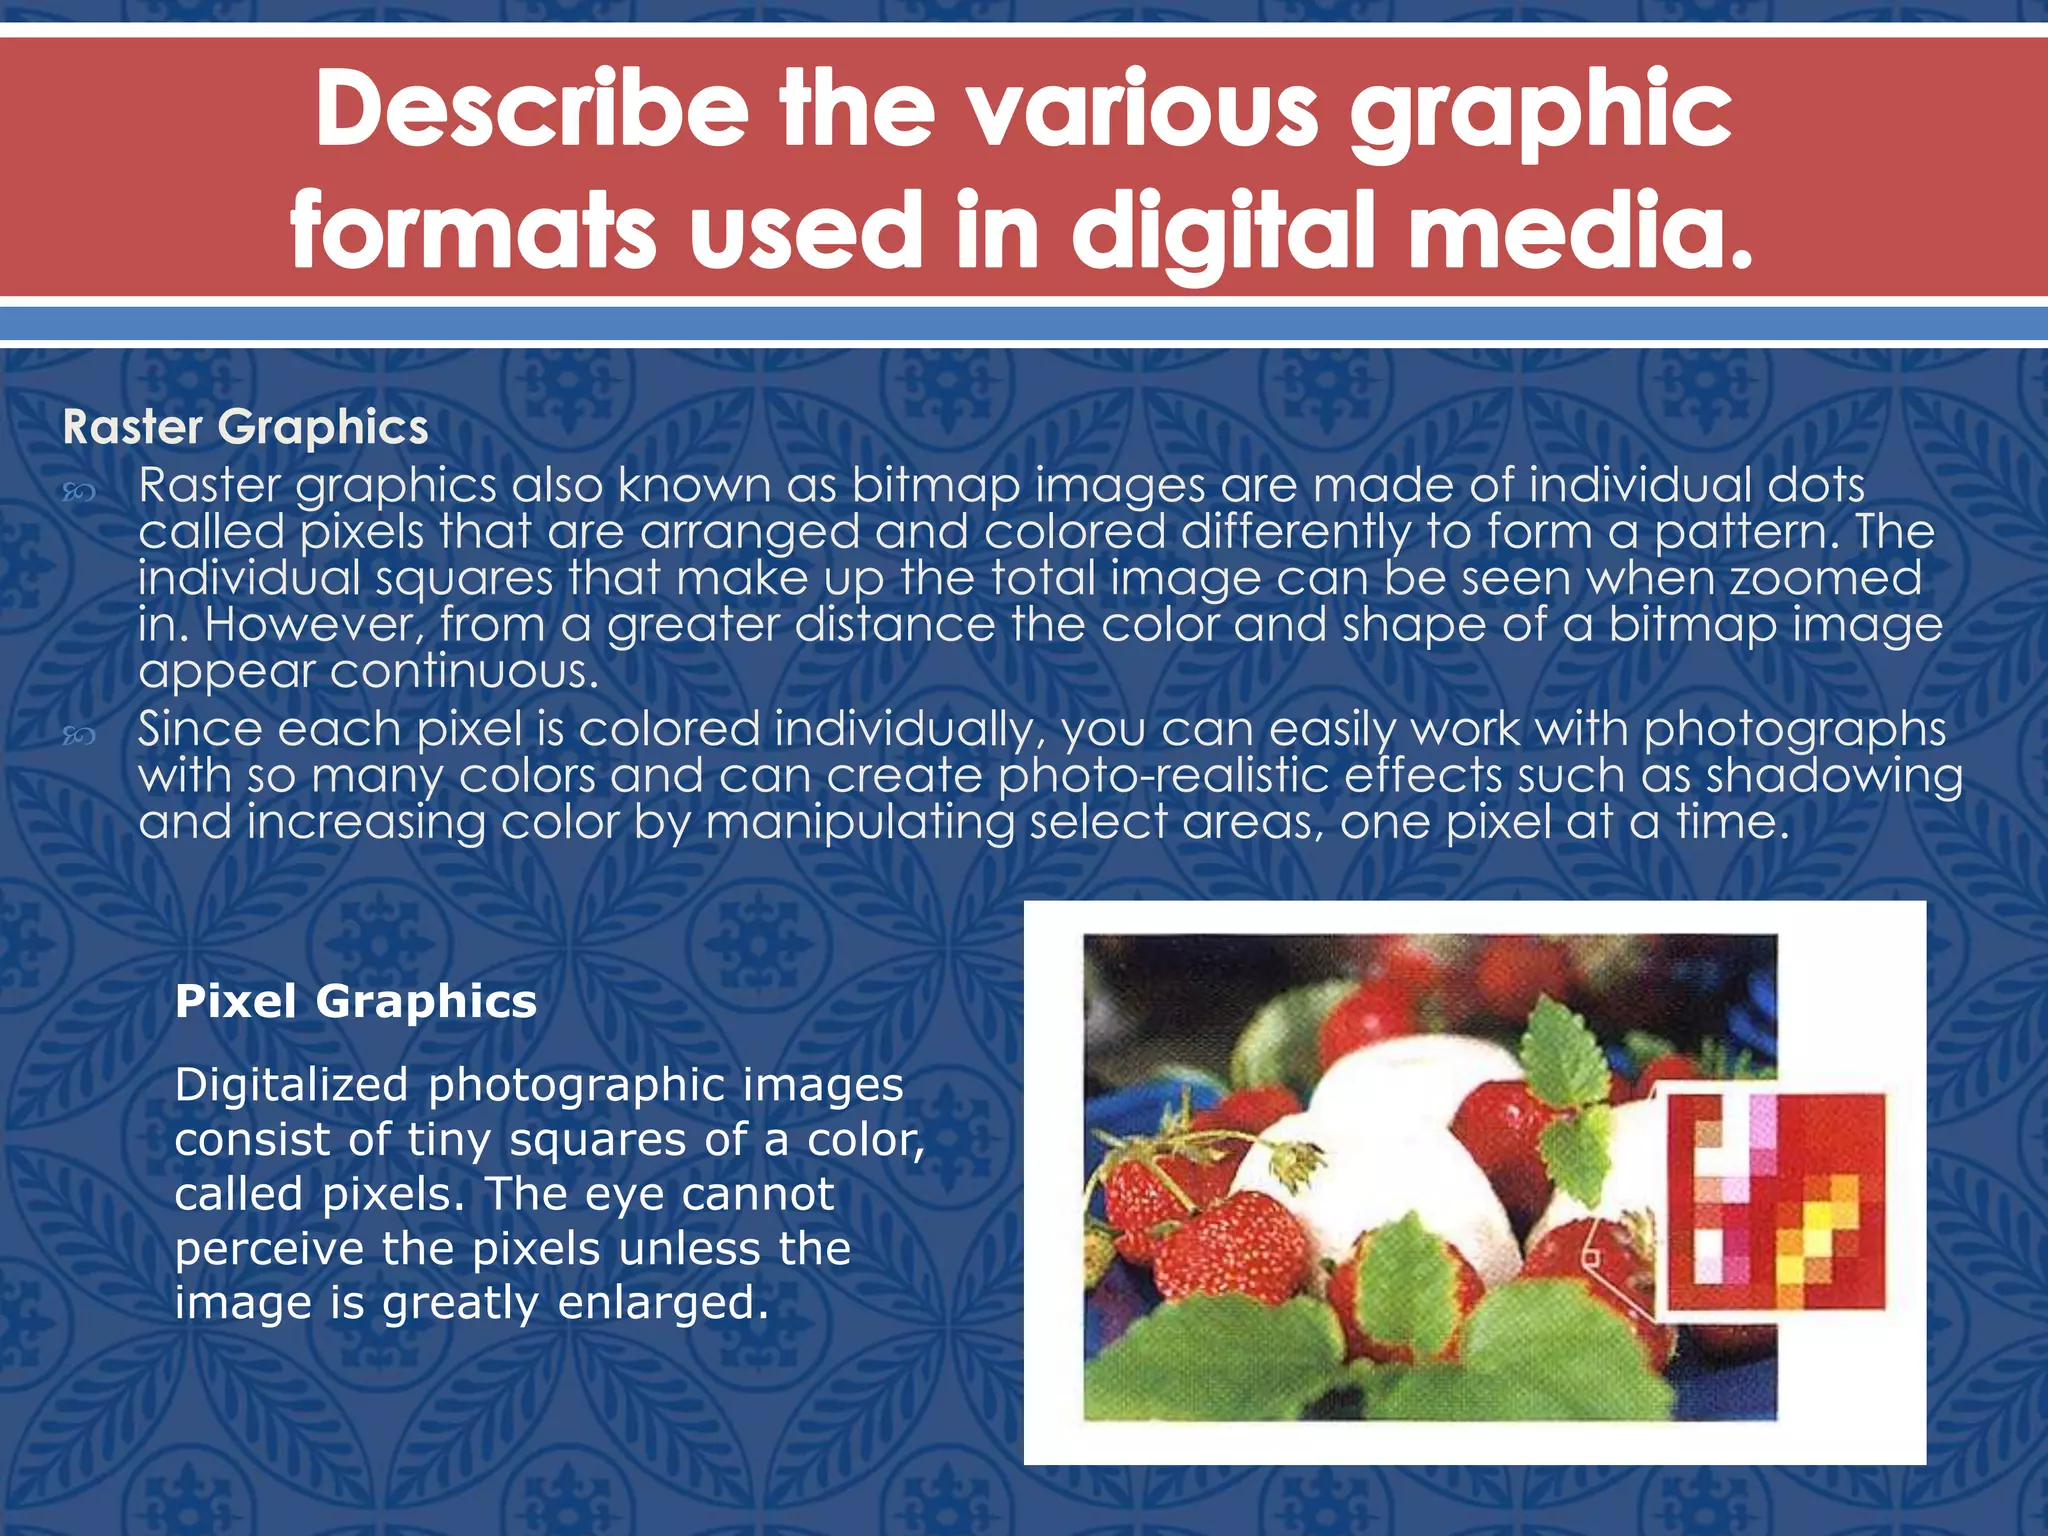
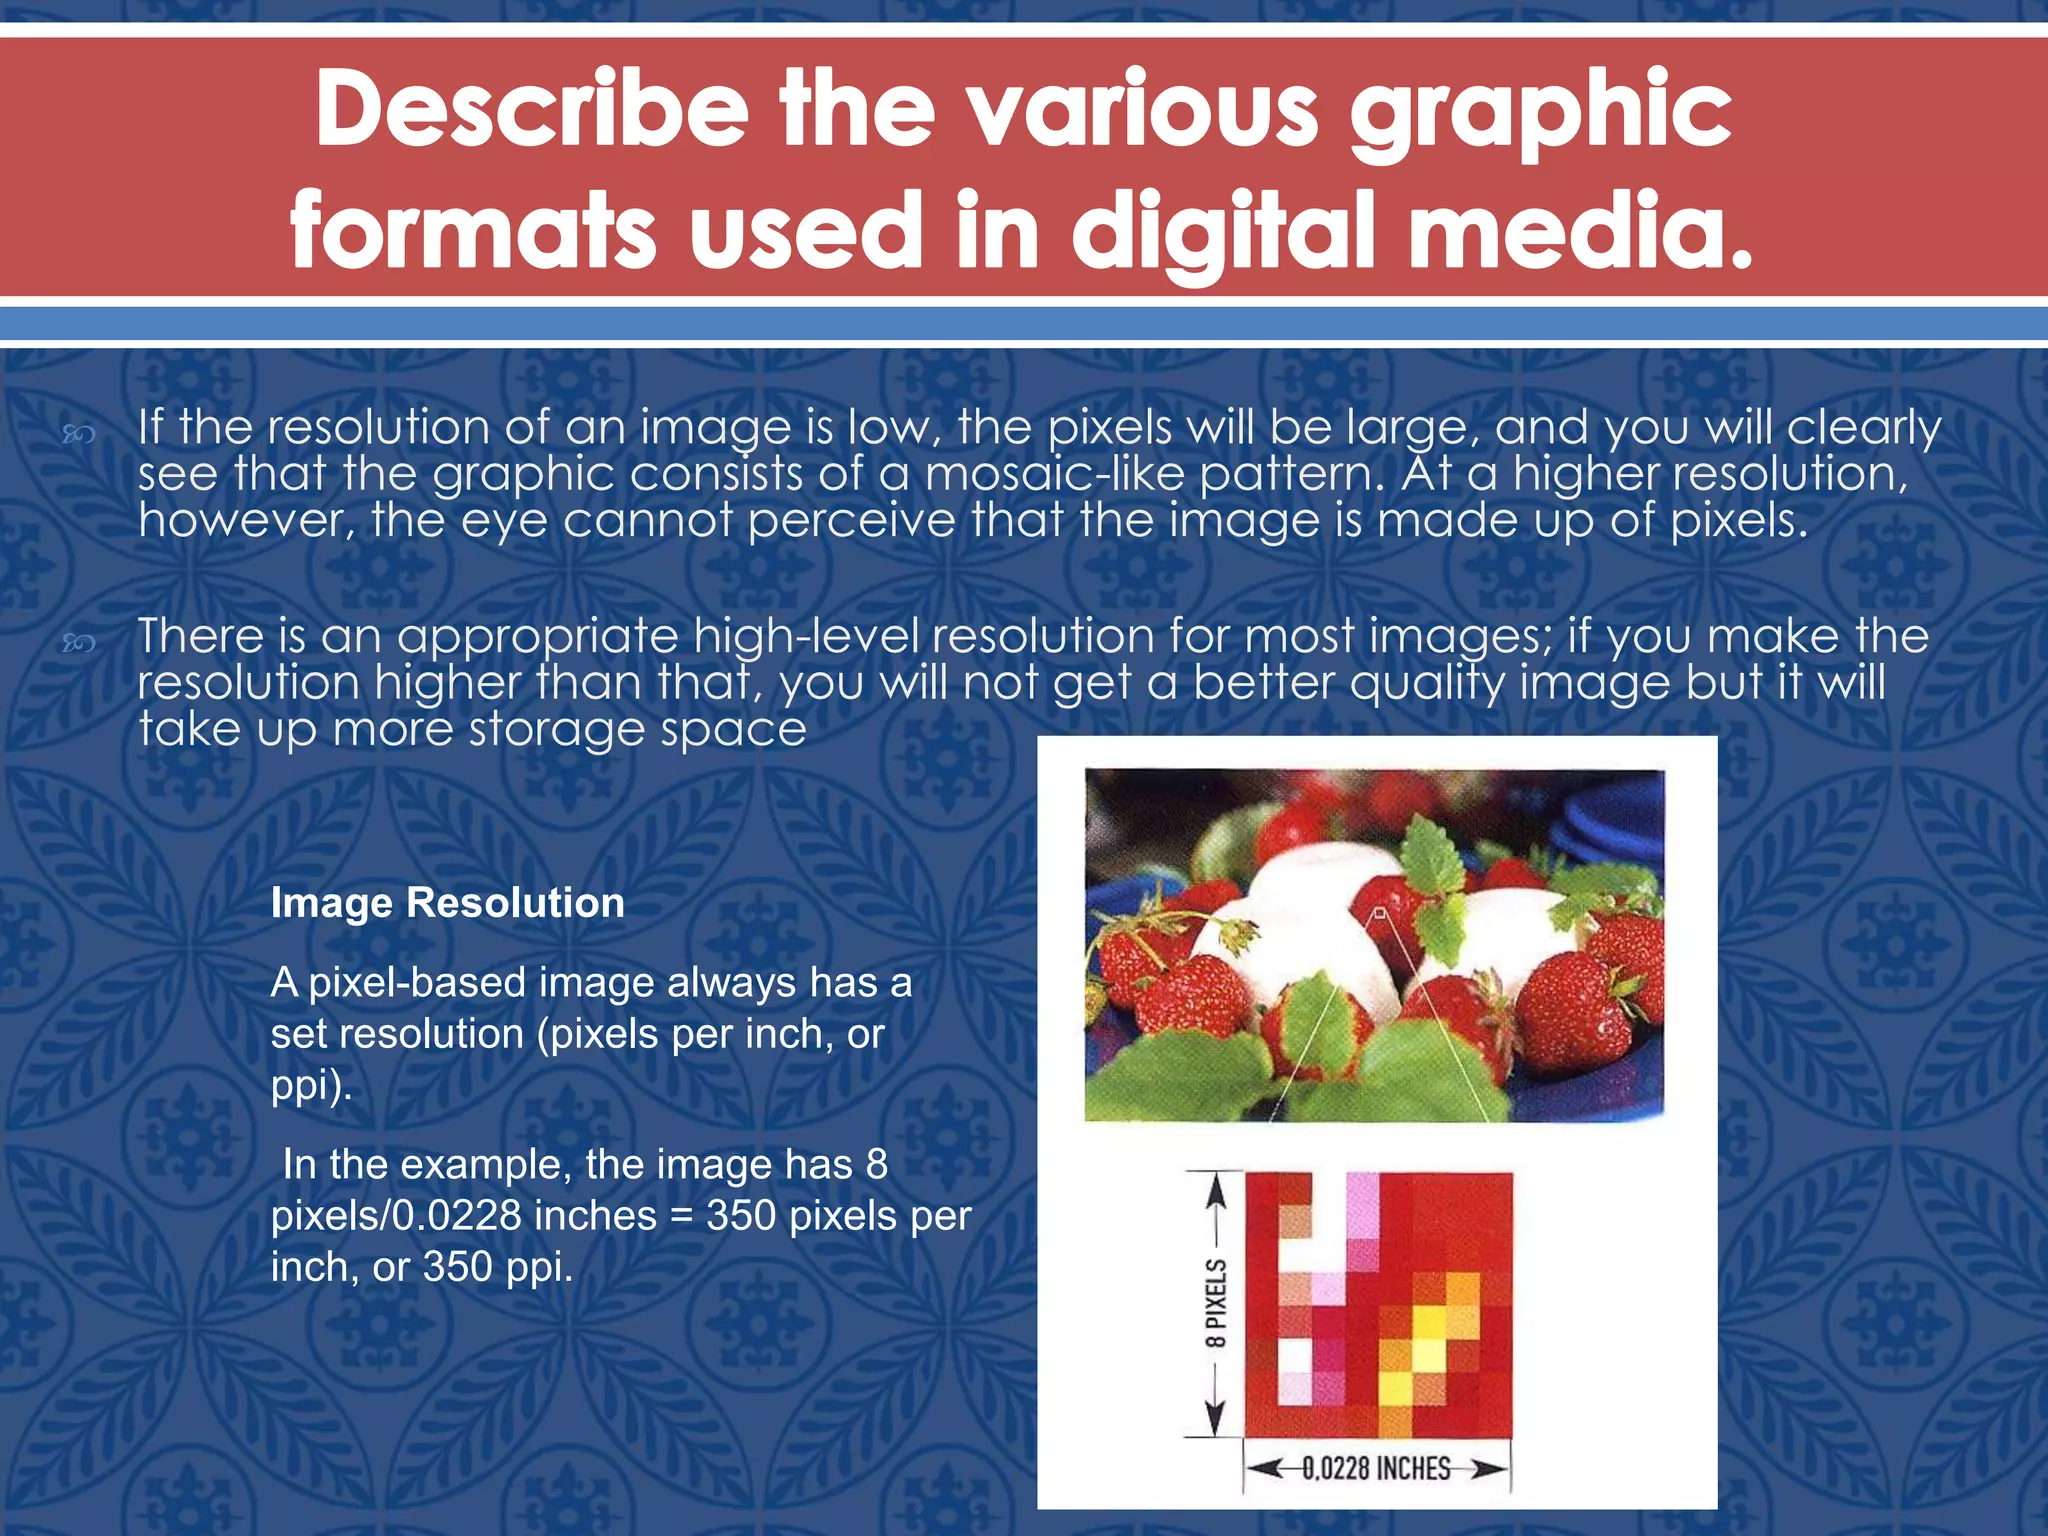
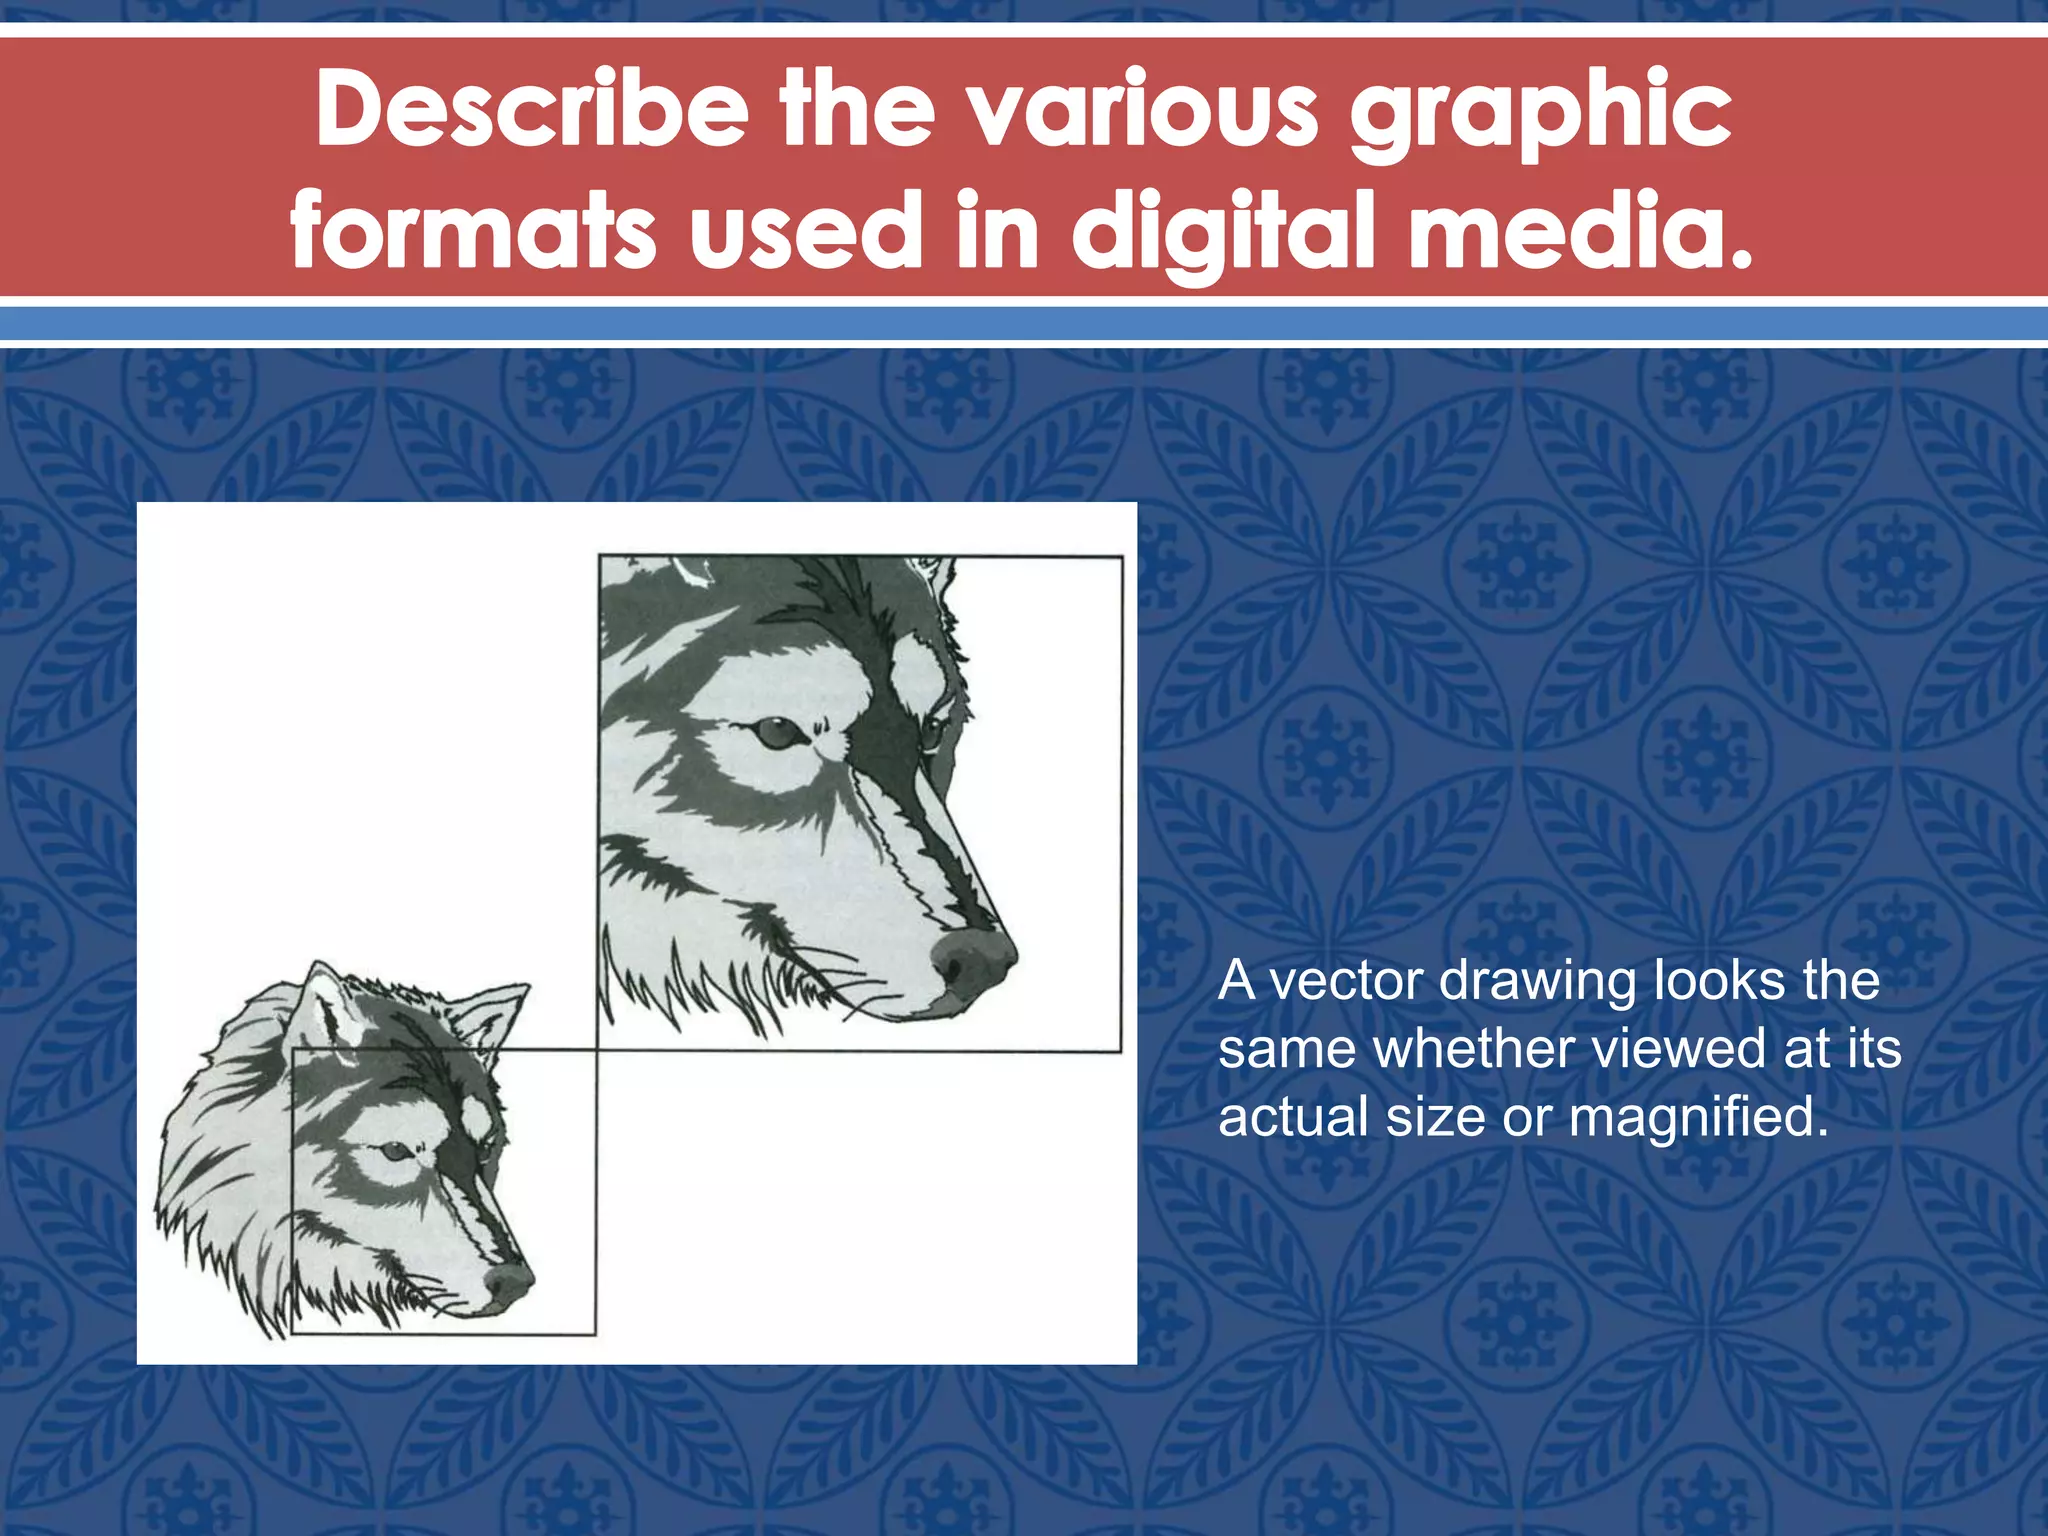
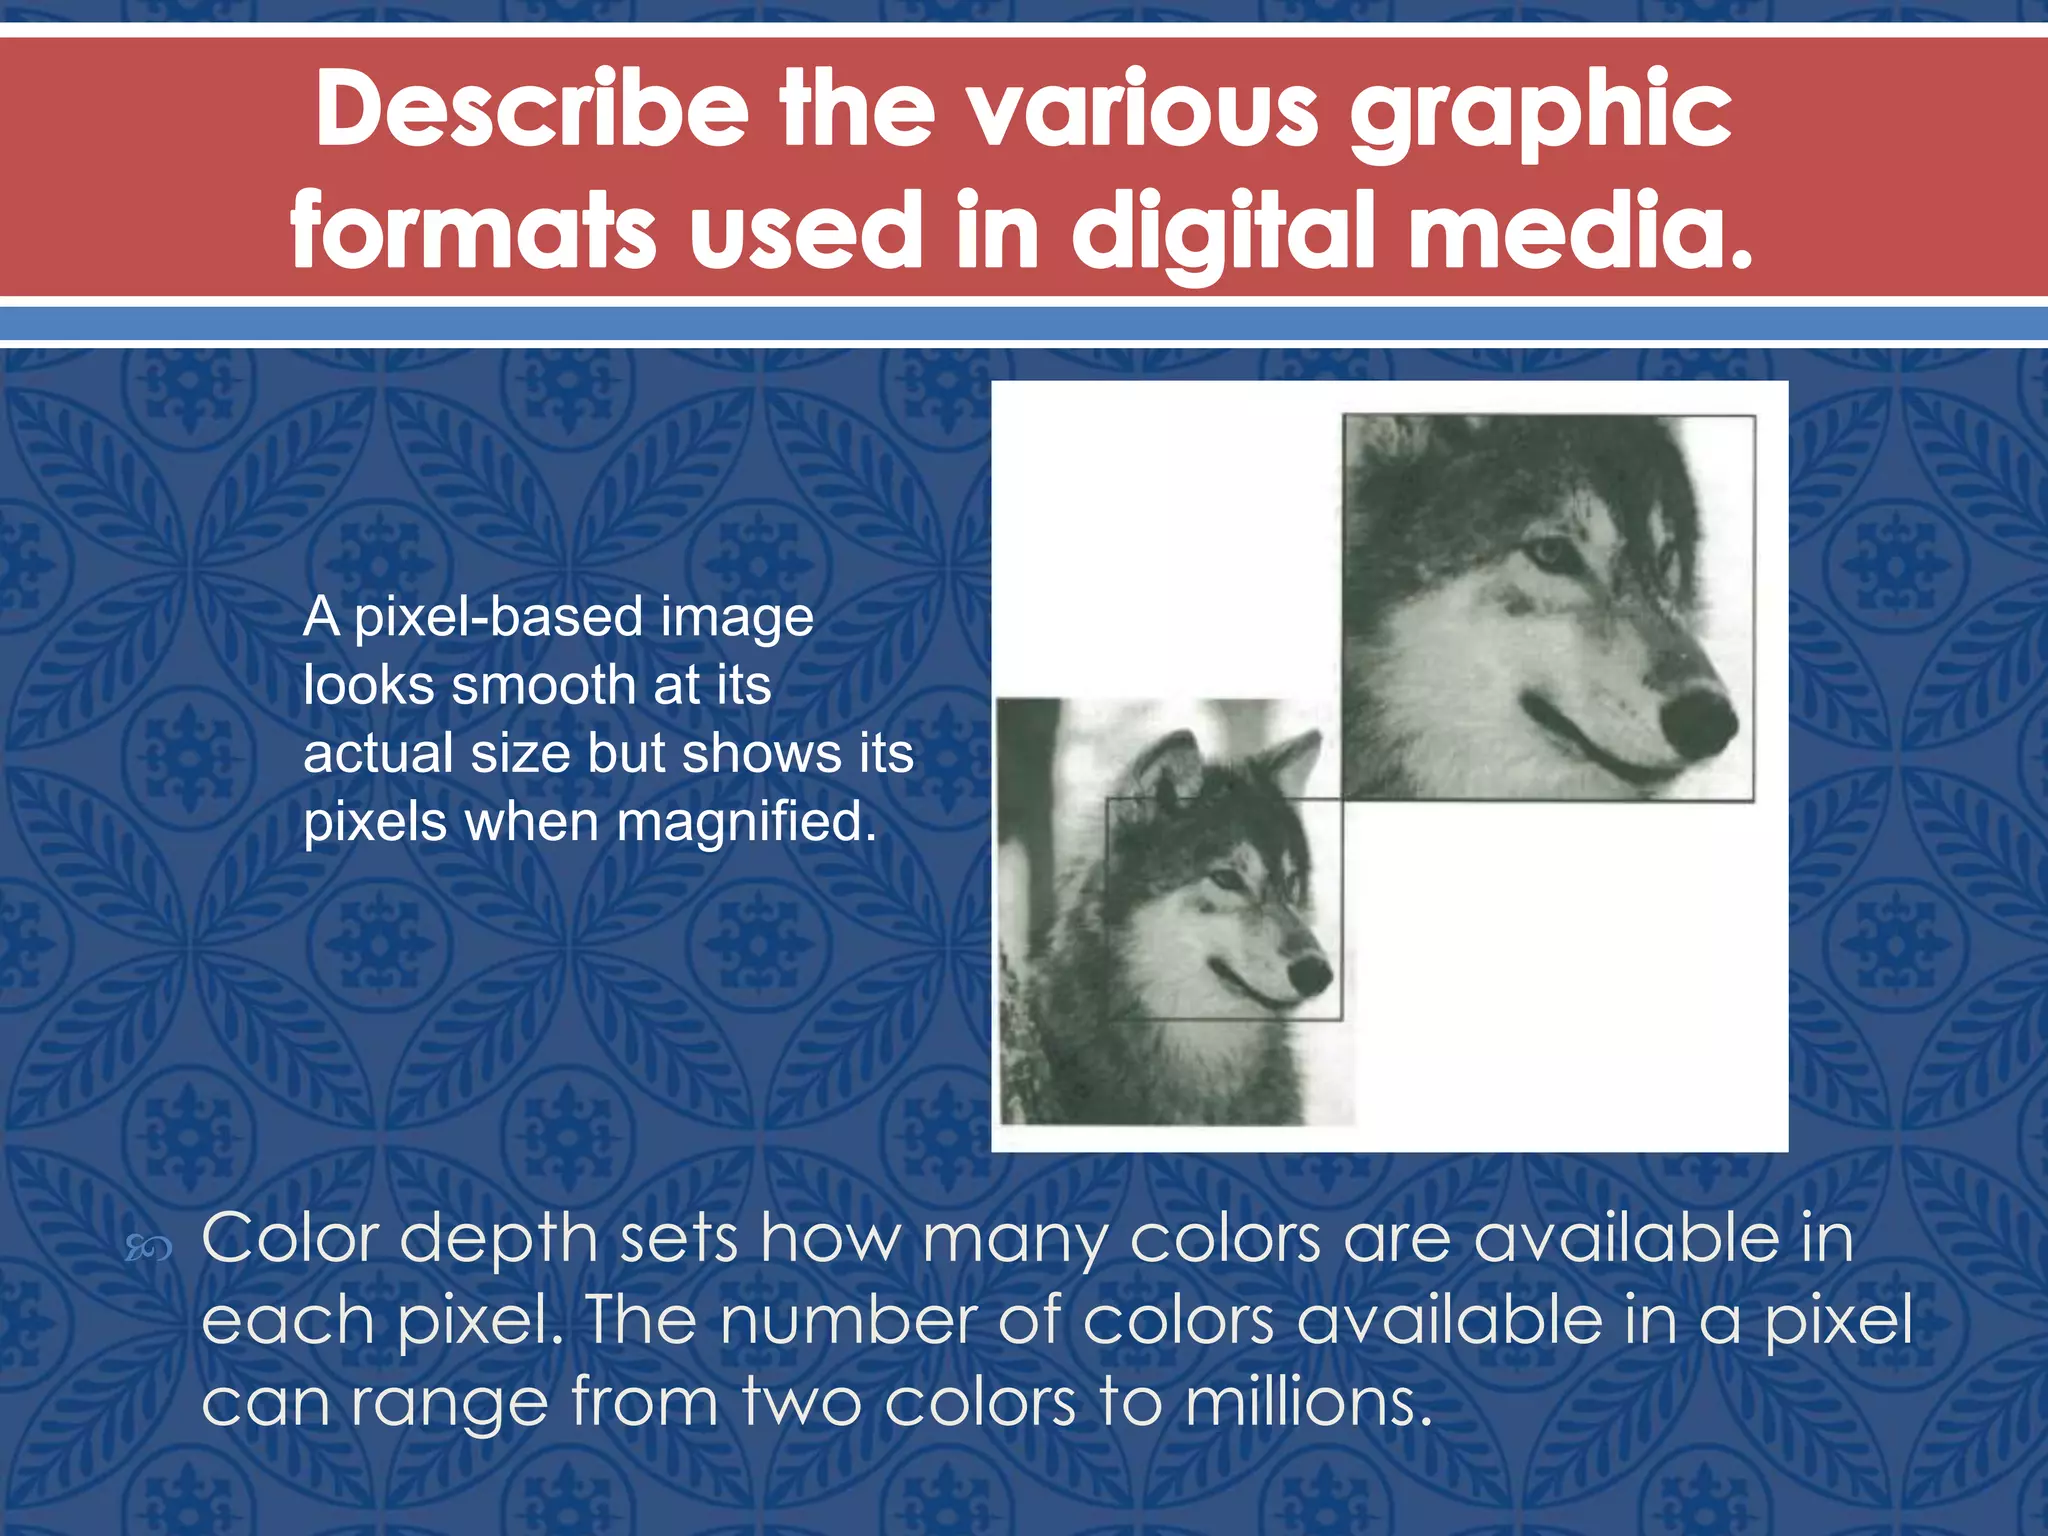
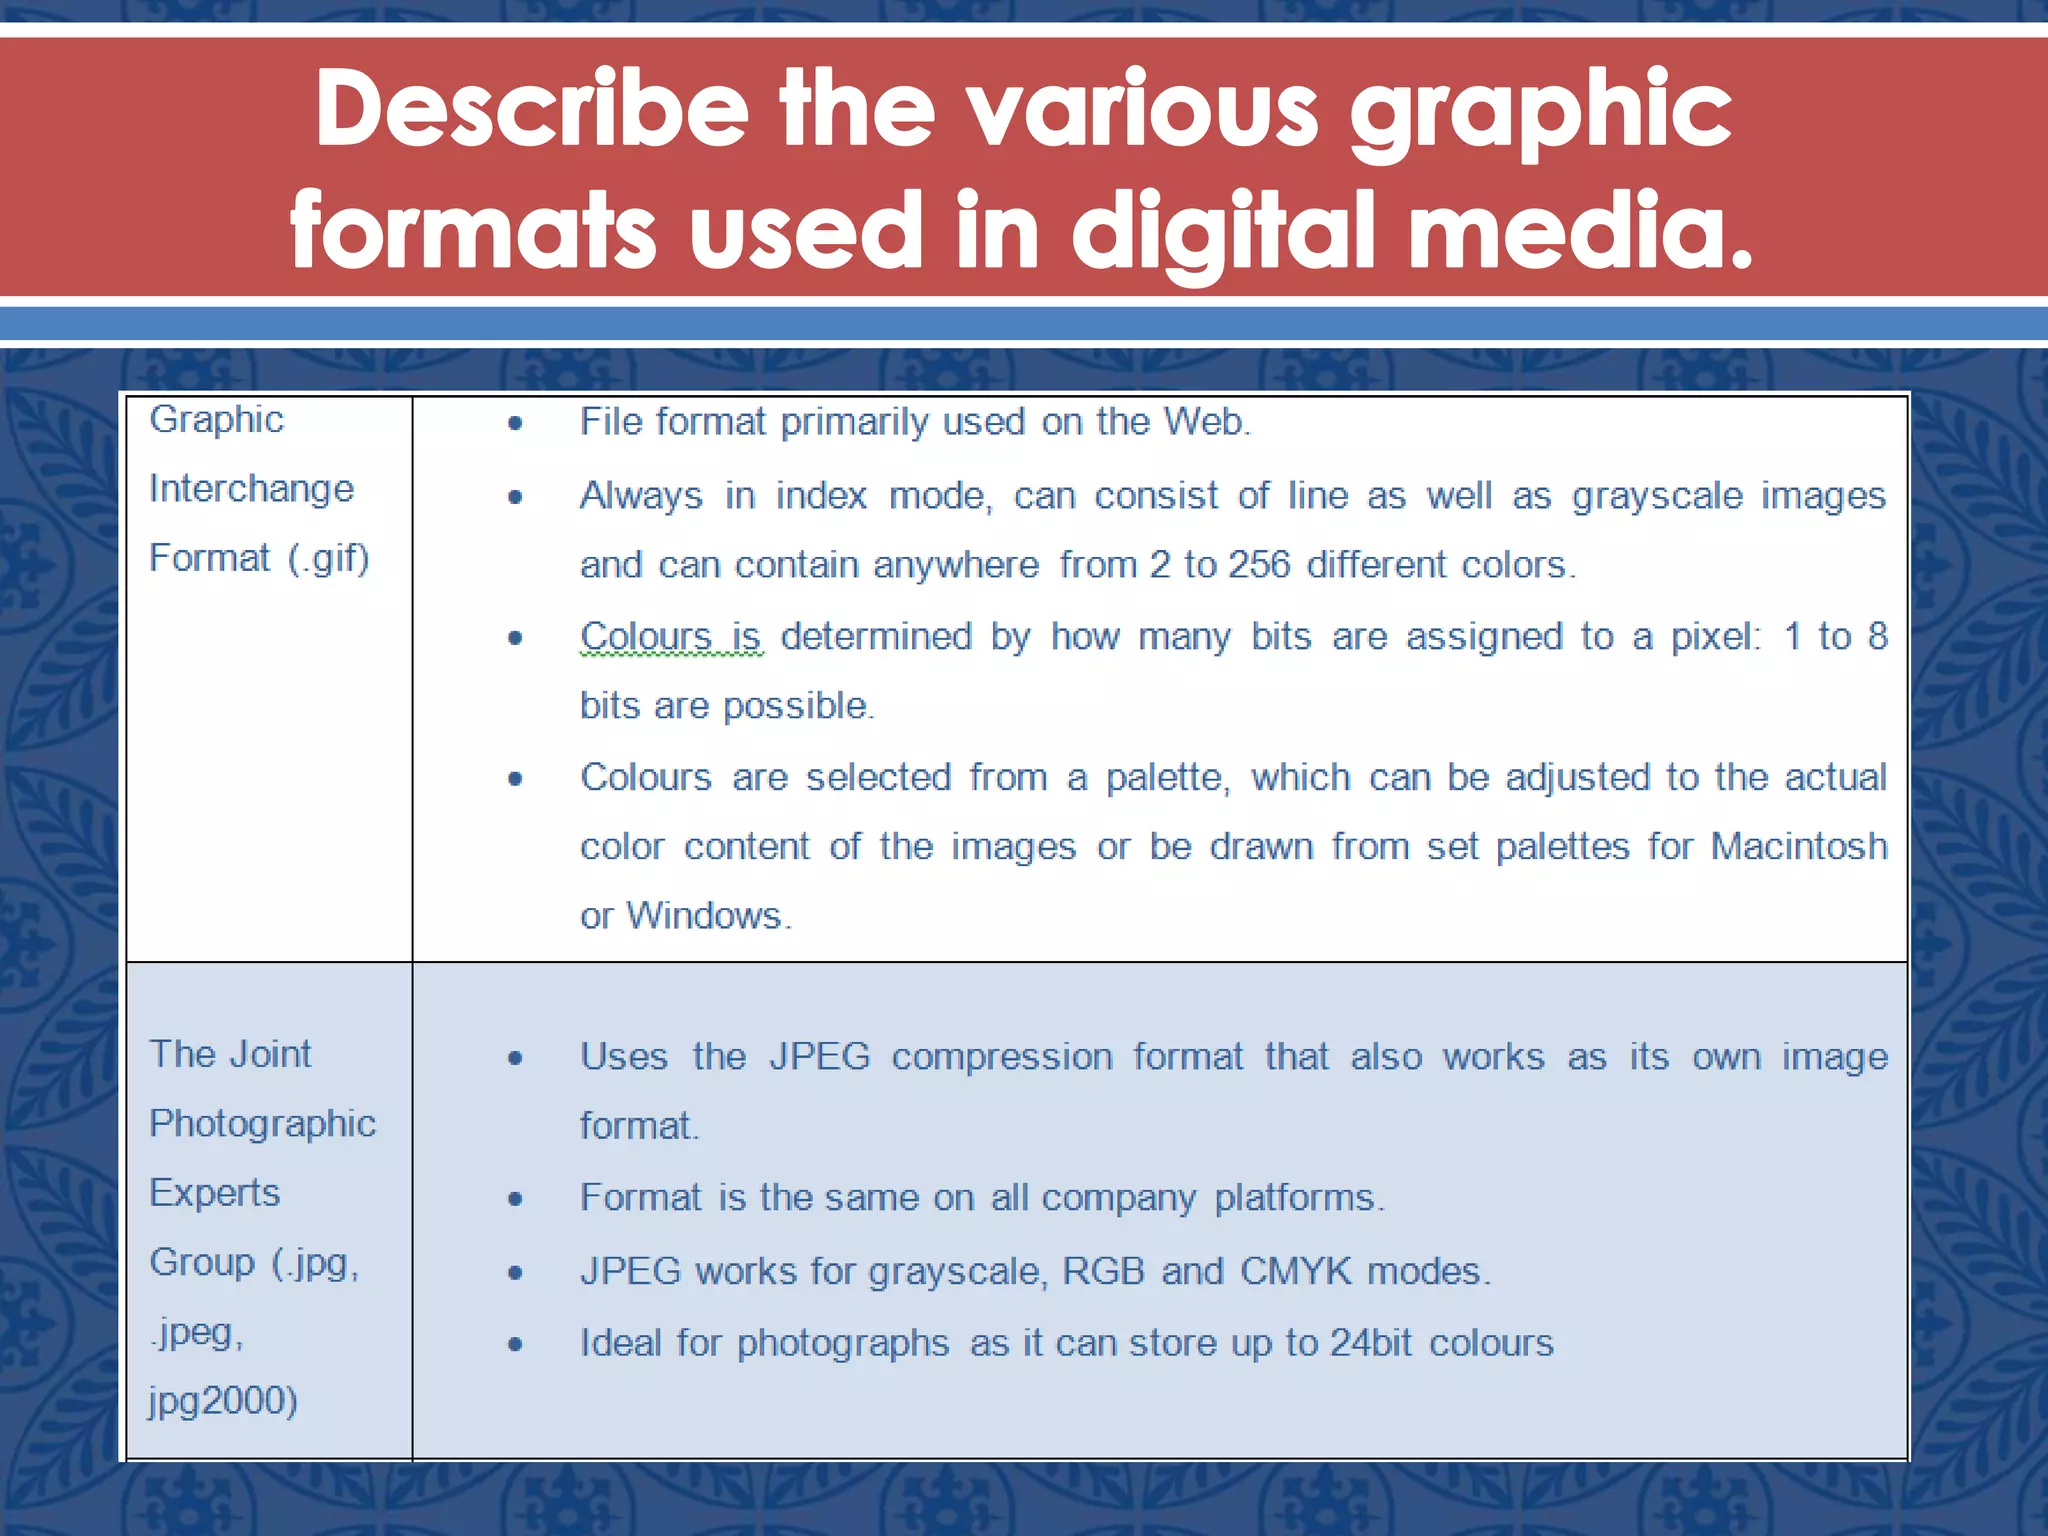
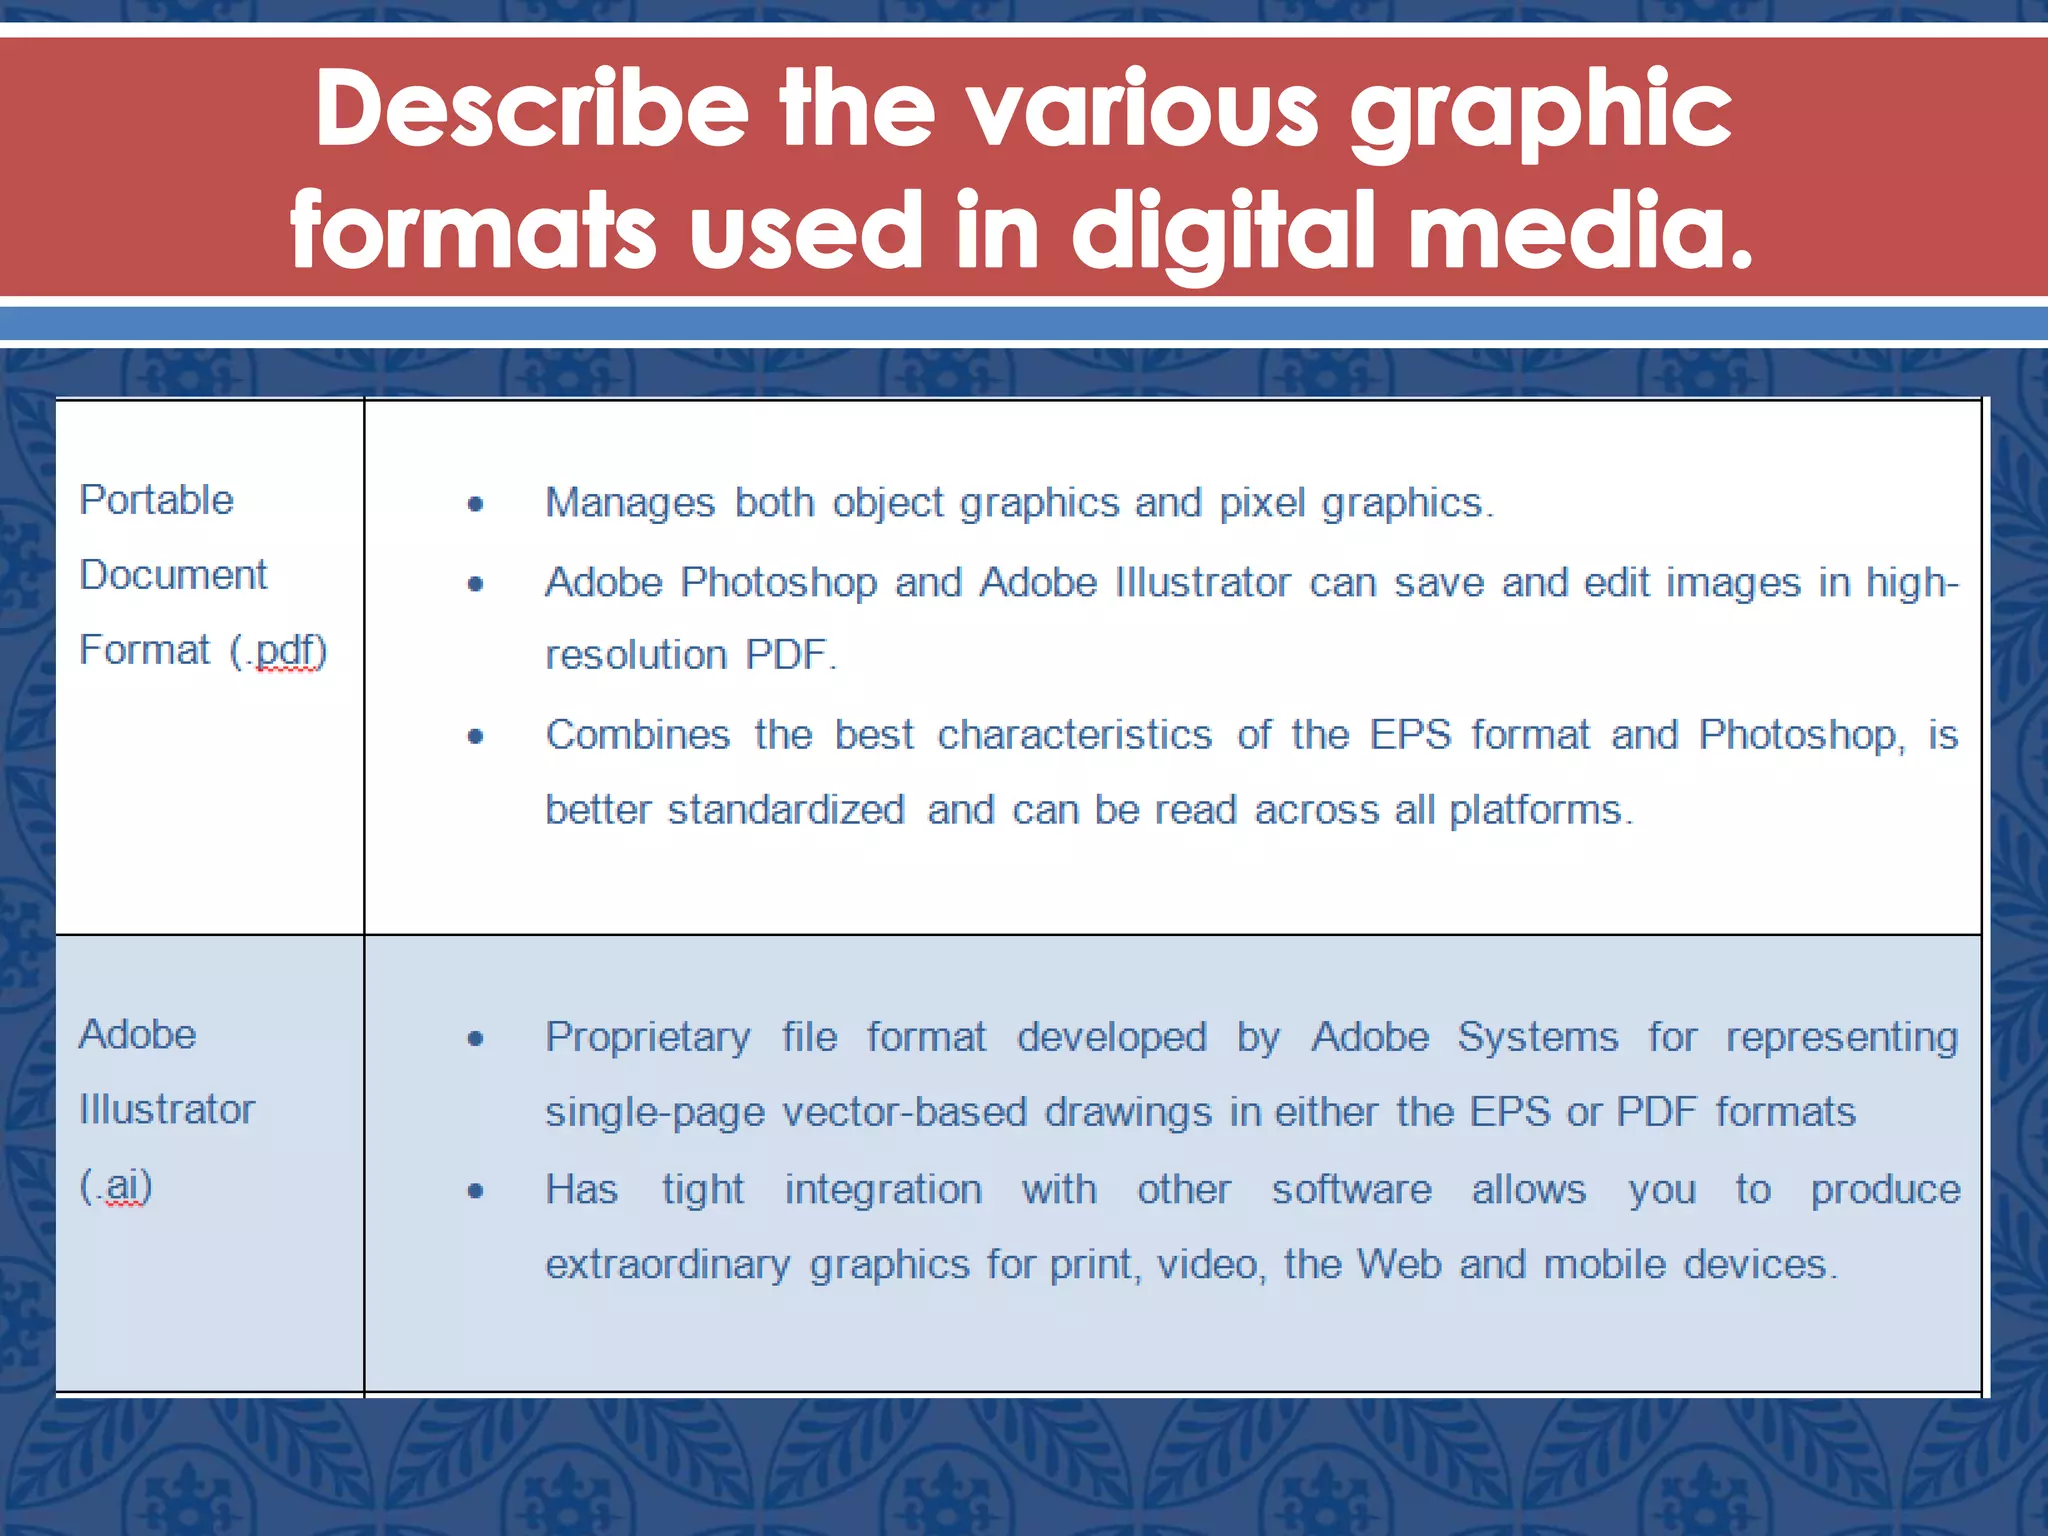
Technical concepts for graphic design production 4Ahmed Ismail
Technical concepts for graphic design production includes:
1- History Of Graphic Design.
2- Graphics Types.
3- Bitmaps.
4- Color Gamut.
5- Files Formats.
6- Resolutions.
7- Color Depth.
8- Document Structure.
9- Digital Printing.
10 - pdf.
11- Color Management System CMS.
a collection of terminologies used in the game development industry, from my point of view any one who intends to work in that business should understand them.
Technical concepts for graphic design production 5Ahmed Ismail
Technical concepts for graphic design production includes:
1- History Of Graphic Design.
2- Graphics Types.
3- Bitmaps.
4- Color Gamut.
5- Files Formats.
6- Resolutions.
7- Color Depth.
8- Document Structure.
9- Digital Printing.
10 - pdf.
11- Color Management System CMS.
Technical concepts for graphic design production 2Ahmed Ismail
Technical concepts for graphic design production includes:
1- History Of Graphic Design.
2- Graphics Types.
3- Bitmaps.
4- Color Gamut.
5- Files Formats.
6- Resolutions.
7- Color Depth.
8- Document Structure.
9- Digital Printing.
10 - pdf.
11- Color Management System CMS.
Wondering about using PNG or JPG or BMP or GIF. This presentation will answer all your queries related to designing digital images and which formats are best while saving them..
Terms like raster images, vector images, vectors, alpha channels, transparency, palettes, compression are explained here.
The presentation on Digital Coding of Images will provide an overview of the techniques used to compress and store digital images. With the increasing use of digital images in a variety of applications, it has become essential to develop methods to reduce the amount of data needed to store and transmit these images, without significantly impacting their quality. This presentation will cover the basics of image coding, including color models, sampling and quantization, and transformation techniques. Participants will learn about different image compression techniques, such as lossless and lossy compression, as well as the popular image file formats, including JPEG, PNG, and GIF. We will also cover topics related to image quality assessment, including subjective and objective methods of measuring image quality. By the end of the presentation, participants will have a solid understanding of digital image coding and compression, as well as the factors that influence image quality.
GraphRAG is All You need? LLM & Knowledge GraphGuy Korland
Guy Korland, CEO and Co-founder of FalkorDB, will review two articles on the integration of language models with knowledge graphs.
1. Unifying Large Language Models and Knowledge Graphs: A Roadmap.
https://arxiv.org/abs/2306.08302
2. Microsoft Research's GraphRAG paper and a review paper on various uses of knowledge graphs:
https://www.microsoft.com/en-us/research/blog/graphrag-unlocking-llm-discovery-on-narrative-private-data/
JMeter webinar - integration with InfluxDB and GrafanaRTTS
Watch this recorded webinar about real-time monitoring of application performance. See how to integrate Apache JMeter, the open-source leader in performance testing, with InfluxDB, the open-source time-series database, and Grafana, the open-source analytics and visualization application.
In this webinar, we will review the benefits of leveraging InfluxDB and Grafana when executing load tests and demonstrate how these tools are used to visualize performance metrics.
Length: 30 minutes
Session Overview
-------------------------------------------
During this webinar, we will cover the following topics while demonstrating the integrations of JMeter, InfluxDB and Grafana:
- What out-of-the-box solutions are available for real-time monitoring JMeter tests?
- What are the benefits of integrating InfluxDB and Grafana into the load testing stack?
- Which features are provided by Grafana?
- Demonstration of InfluxDB and Grafana using a practice web application
To view the webinar recording, go to:
https://www.rttsweb.com/jmeter-integration-webinar
Connector Corner: Automate dynamic content and events by pushing a buttonDianaGray10
Here is something new! In our next Connector Corner webinar, we will demonstrate how you can use a single workflow to:
Create a campaign using Mailchimp with merge tags/fields
Send an interactive Slack channel message (using buttons)
Have the message received by managers and peers along with a test email for review
But there’s more:
In a second workflow supporting the same use case, you’ll see:
Your campaign sent to target colleagues for approval
If the “Approve” button is clicked, a Jira/Zendesk ticket is created for the marketing design team
But—if the “Reject” button is pushed, colleagues will be alerted via Slack message
Join us to learn more about this new, human-in-the-loop capability, brought to you by Integration Service connectors.
And...
Speakers:
Akshay Agnihotri, Product Manager
Charlie Greenberg, Host
Essentials of Automations: Optimizing FME Workflows with ParametersSafe Software
Are you looking to streamline your workflows and boost your projects’ efficiency? Do you find yourself searching for ways to add flexibility and control over your FME workflows? If so, you’re in the right place.
Join us for an insightful dive into the world of FME parameters, a critical element in optimizing workflow efficiency. This webinar marks the beginning of our three-part “Essentials of Automation” series. This first webinar is designed to equip you with the knowledge and skills to utilize parameters effectively: enhancing the flexibility, maintainability, and user control of your FME projects.
Here’s what you’ll gain:
- Essentials of FME Parameters: Understand the pivotal role of parameters, including Reader/Writer, Transformer, User, and FME Flow categories. Discover how they are the key to unlocking automation and optimization within your workflows.
- Practical Applications in FME Form: Delve into key user parameter types including choice, connections, and file URLs. Allow users to control how a workflow runs, making your workflows more reusable. Learn to import values and deliver the best user experience for your workflows while enhancing accuracy.
- Optimization Strategies in FME Flow: Explore the creation and strategic deployment of parameters in FME Flow, including the use of deployment and geometry parameters, to maximize workflow efficiency.
- Pro Tips for Success: Gain insights on parameterizing connections and leveraging new features like Conditional Visibility for clarity and simplicity.
We’ll wrap up with a glimpse into future webinars, followed by a Q&A session to address your specific questions surrounding this topic.
Don’t miss this opportunity to elevate your FME expertise and drive your projects to new heights of efficiency.
Search and Society: Reimagining Information Access for Radical FuturesBhaskar Mitra
The field of Information retrieval (IR) is currently undergoing a transformative shift, at least partly due to the emerging applications of generative AI to information access. In this talk, we will deliberate on the sociotechnical implications of generative AI for information access. We will argue that there is both a critical necessity and an exciting opportunity for the IR community to re-center our research agendas on societal needs while dismantling the artificial separation between the work on fairness, accountability, transparency, and ethics in IR and the rest of IR research. Instead of adopting a reactionary strategy of trying to mitigate potential social harms from emerging technologies, the community should aim to proactively set the research agenda for the kinds of systems we should build inspired by diverse explicitly stated sociotechnical imaginaries. The sociotechnical imaginaries that underpin the design and development of information access technologies needs to be explicitly articulated, and we need to develop theories of change in context of these diverse perspectives. Our guiding future imaginaries must be informed by other academic fields, such as democratic theory and critical theory, and should be co-developed with social science scholars, legal scholars, civil rights and social justice activists, and artists, among others.
Kubernetes & AI - Beauty and the Beast !?! @KCD Istanbul 2024Tobias Schneck
As AI technology is pushing into IT I was wondering myself, as an “infrastructure container kubernetes guy”, how get this fancy AI technology get managed from an infrastructure operational view? Is it possible to apply our lovely cloud native principals as well? What benefit’s both technologies could bring to each other?
Let me take this questions and provide you a short journey through existing deployment models and use cases for AI software. On practical examples, we discuss what cloud/on-premise strategy we may need for applying it to our own infrastructure to get it to work from an enterprise perspective. I want to give an overview about infrastructure requirements and technologies, what could be beneficial or limiting your AI use cases in an enterprise environment. An interactive Demo will give you some insides, what approaches I got already working for real.
Builder.ai Founder Sachin Dev Duggal's Strategic Approach to Create an Innova...Ramesh Iyer
In today's fast-changing business world, Companies that adapt and embrace new ideas often need help to keep up with the competition. However, fostering a culture of innovation takes much work. It takes vision, leadership and willingness to take risks in the right proportion. Sachin Dev Duggal, co-founder of Builder.ai, has perfected the art of this balance, creating a company culture where creativity and growth are nurtured at each stage.
Accelerate your Kubernetes clusters with Varnish CachingThijs Feryn
A presentation about the usage and availability of Varnish on Kubernetes. This talk explores the capabilities of Varnish caching and shows how to use the Varnish Helm chart to deploy it to Kubernetes.
This presentation was delivered at K8SUG Singapore. See https://feryn.eu/presentations/accelerate-your-kubernetes-clusters-with-varnish-caching-k8sug-singapore-28-2024 for more details.
Epistemic Interaction - tuning interfaces to provide information for AI supportAlan Dix
Paper presented at SYNERGY workshop at AVI 2024, Genoa, Italy. 3rd June 2024
https://alandix.com/academic/papers/synergy2024-epistemic/
As machine learning integrates deeper into human-computer interactions, the concept of epistemic interaction emerges, aiming to refine these interactions to enhance system adaptability. This approach encourages minor, intentional adjustments in user behaviour to enrich the data available for system learning. This paper introduces epistemic interaction within the context of human-system communication, illustrating how deliberate interaction design can improve system understanding and adaptation. Through concrete examples, we demonstrate the potential of epistemic interaction to significantly advance human-computer interaction by leveraging intuitive human communication strategies to inform system design and functionality, offering a novel pathway for enriching user-system engagements.
Transcript: Selling digital books in 2024: Insights from industry leaders - T...BookNet Canada
The publishing industry has been selling digital audiobooks and ebooks for over a decade and has found its groove. What’s changed? What has stayed the same? Where do we go from here? Join a group of leading sales peers from across the industry for a conversation about the lessons learned since the popularization of digital books, best practices, digital book supply chain management, and more.
Link to video recording: https://bnctechforum.ca/sessions/selling-digital-books-in-2024-insights-from-industry-leaders/
Presented by BookNet Canada on May 28, 2024, with support from the Department of Canadian Heritage.
Empowering NextGen Mobility via Large Action Model Infrastructure (LAMI): pav...
Chap9 10
1. Describe the various graphic formats used in digital media.
2. In This Chapter, you’ll learn on:
The Basics of Digital Image Formation
Identifying of the Various file types such as JPEG,
GIF, AI, PDF and etc
The Characteristics and use of the Various Graphic
Formats
3. In this chapter, we will look at the basic types of digital
images and file formats. Images, such as pictures, clip
art, 3-D graphics, and animation, are commonly used
in designing for both multimedia and the Web.
Regardless of their forms, multimedia images are
generated by the computers in two ways: as vector-
based graphics and bitmap images
4. The Basics of Digital Image Formation
Vector graphics
Vector-based images are defined by mathematical
relationships between points and the paths connecting
them to describe an image.
Graphical elements in a vector file are called objects.
Each object is an independent entity with properties,
such as color, shape, size, outline, and position on the
screen, by its definition. Since each object is a self-
contained entity, you can easily move and change its
properties while maintaining its original clarity, and
without affecting other objects in the illustration.
5. Object graphics are very little memory because
only the location and design information must be
defined – very simple values. This also applies to the
colors used in object graphics, which are also
expressed numerically.
These characteristics make vector-based programs
ideal for illustration and 3D modeling, where the
individual objects usually need to be created and
manipulated through the design process.
6. Figure 1. Vector-based graphic: the image itself on
the left and the actual lines that make up the drawing
on the right.
7. Working with Vector Graphics
Outlines and Lines
Lines and outlines in object
graphics can assume any
color.
You can also specify how
thick the lines should be, the
style of the lines (solid,
dotted, etc) and the shape
of the corners (curved,
squared, etc).
8. Fill
Curved and closed objects
can be filled with colors,
color shifts and patterns.
The colors are expressed
numerically in terms of the
ink coverage required for
the respective printing inks.
You can select fill patterns
and color shifts from a
predetermined menu.
9. Patterns
A pattern consists of a small group of objects repeated in a
square pattern. It is easy to make your own patterns.
Gradients
Color shifts are transitions among several colors at set distances.
Gradients can either be linear or circular
10. Compound Path (Knockouts)
Also known as knockouts, A curve that is placed
within a closed object – a star within a square, for
example – can be selected as a knockout.
In this example, the selection means that a star
knocks out a transparent hole in the square. As a
result, whatever you put behind the square will be
visible through the star hole.
11.
12. Applications for Object Graphics
Object graphics are created in illustration software
such as Adobe Illustrator
Adobe Streamline is one example. They are usually
used to convert pixel-based logotypes into object
graphics so they can be used in all possible sizes.
Object graphics are usually saved in the image
format Encapsulated Postscript (EPS). You can also
save them in whatever format the software uses,
but then the object may not be able to be placed
in a page layout application.
13. Raster Graphics
Raster graphics also known as bitmap images are made of individual dots
called pixels that are arranged and colored differently to form a pattern. The
individual squares that make up the total image can be seen when zoomed
in. However, from a greater distance the color and shape of a bitmap image
appear continuous.
Since each pixel is colored individually, you can easily work with photographs
with so many colors and can create photo-realistic effects such as shadowing
and increasing color by manipulating select areas, one pixel at a time.
Pixel Graphics
Digitalized photographic images
consist of tiny squares of a color,
called pixels. The eye cannot
perceive the pixels unless the
image is greatly enlarged.
14. Bitmap programs are ideal to retouch photographs,
editing images and video files and creating original
artwork. Variety of changes to photographs can be
made, such as adjusting the lighting, removing
scratches, people, and things, swapping details
between images, adding text and objects, adjusting
color, and applying combinations of special effects.
15. Working with Graphics
When photographs or illustrations are scanned into
a computer, pixel-based images, or pixel graphics,
are created. Another term of pixel is raster.
A pixel graphic is a divided into tiny squares of
color, almost like a mosaic. These tiny squares of
color are referred to as pixels.
Pixel graphics can also be created directly in the
computer or by a digital camera.
16. Resolution
If you assume that a pixel-based image is printed in
a certain size, the image will consist of a certain
number of pixels per centimeter or per inch (ppi).
The resolution of an image is measured in ppi. This
refers to the number and size of the pixels that
make up a particular image.
Sometimes the unit dpi is used (incorrectly) instead
of ppi. Dpi, which means dots per inch, is the unit
used to describe the output resolution in printers.
17. If the resolution of an image is low, the pixels will be large, and you will clearly
see that the graphic consists of a mosaic-like pattern. At a higher resolution,
however, the eye cannot perceive that the image is made up of pixels.
There is an appropriate high-level resolution for most images; if you make the
resolution higher than that, you will not get a better quality image but it will
take up more storage space
Image Resolution
A pixel-based image always has a
set resolution (pixels per inch, or
ppi).
In the example, the image has 8
pixels/0.0228 inches = 350 pixels per
inch, or 350 ppi.
18. Color Modes, Channels and Bit Depth
Bit Depth
o For now, I believed that you have a better understanding
of what is object and pixel graphics. As to let you know, in
vector-based programs, such as Adobe Illustrator and
CorelDraw Graphics Suite, the drawing tools make shapes
based on mathematical formulas.
o As to recap, vector objects have smooth lines and
continuous colors even when you magnify the image.
Vector drawings are resolution independent, meaning that
when print a vector-based drawing, the quality depends
only on the resolution of the printer.
19. A vector drawing looks the
same whether viewed at its
actual size or magnified.
20. In pixel-based programs, such as Photoshop,
images are made up of tiny pixels that are
arranged and colored to form a pattern. Each pixel
represents a color.
When you view a pixel-based image at its intended
size and resolution, the colors and shapes appear
smooth, but if you magnify the image, tiny
individual squares become more evident. You can
edit a pixel-based image pixel by pixel, and pixel-
based images depend on the resolution at which
they are saved for quality when printing the image.
21. Color depth sets how many colors are available in
each pixel. The number of colors available in a pixel
can range from two colors to millions.
A pixel-based image
looks smooth at its
actual size but shows its
pixels when magnified.
22. A color mode determines how the channels in each pixel
create the colors in an image. And each channel in a pixel
represents a primary color.
Typically, color information is saved in a measurement called
bit depth or color depth.
This color depth measures how much color information is
available in each pixel. The more bit depth that an image has,
the more colors are available. More color depth translates to
more accurate representation of color on-screen as well as on
the printed page.
Typical color depth values are 1-bit, 8-bit, 16-bit and 24-bit. For
instance, a pixel with a 1-bit color depth has two possible
color values – black and white. An 8-bit pixel has 256 possible
color values and a 24-bit pixel has about 16 million possible
color values.
23. Channels
Every image you create in Photoshop contains
channels. Channels store an image’s color
information.
Each pixel in an image can have as few as one and
as many as four channels. The number of channels
in an image depends upon the color mode in
which the image is set.
24. To view the channels in a
color image, use the
Channels palette to display
the image’s channels. Click
on one of the channels to
display only that channel.
Clicking RGB would restore
the full channel display).
A special grayscale
channel that is used to save
selections is known as an
alpha channel.
25. Color Modes
A color model is a scheme used to break colors
down into their component primary parts. Color
models are used to represent color in images in a
standardized way.
In Photoshop, color models are applied to images
as color modes.
Photoshop supports eight color modes: Bitmap,
Grayscale, Duotone, Indexed Color, RGB, CMYK,
Lab and Multichannel.
26. Any image can be converted to or edited in any
one of the eight color modes. To convert an image
to another color mode, choose Image > Mode and
select a color mode from the submenu
The different color modes contain a different
number of channels. Table 1 shows the number of
channels per mode.
27. Table 1
The Number of Channels in a Color Mode
One Channel Three Channels Four Channels
Bitmap RGB CMYK
Grayscale Lab
Duotone Multichannel
Indexed Color
28. If you want to convert an image to a color mode
that is unavailable on the submenu (unavailable
options are grayed out), you need to convert the
image to another color mode before converting it
to the desired color mode.
For instance, if you want to convert an RGB color
image to Bitmap mode, you have to convert the
image to Grayscale first. You will learn more about
the various color modes in the later chapters
29. The Various File Types and its Characteristics
Pixel-based images can be saved in a number of
file formats. Some of them have more or less
becomes industry standards. They are primarily
differentiated by which color modes they can
handle as well as the level of features they are
capable of.
30.
31.
32.
33.
34.
35. The most common image file formats are Photoshop, EPS,
TIFF, PICT, GIF and JPEG. Some are only used on Macintosh
and others only on Windows. The two formats generally
used in graphic production are TIFF and EPS.