Download as PDF, PPTX


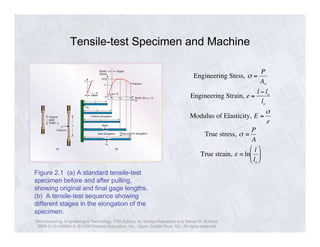


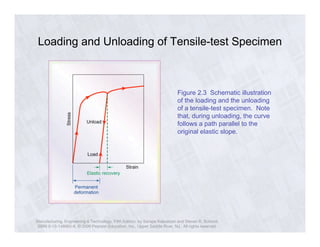


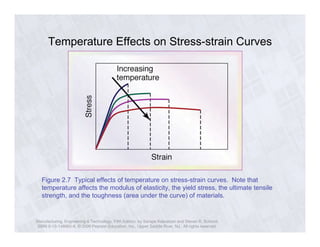


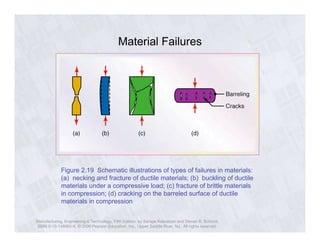


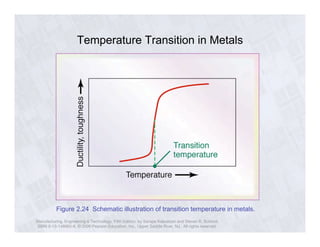
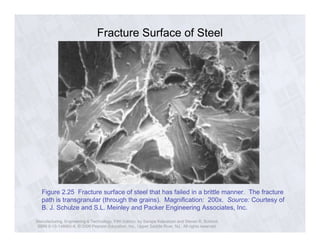


The document discusses various mechanical testing methods for materials, including tensile testing, hardness testing, fatigue testing, and fracture testing. It provides details on stress-strain curves, definitions of engineering stress and strain, true stress and strain. It also describes how properties like strength, ductility and modulus are affected by temperature, strain rate, inclusions and other microstructural factors. Different failure modes like brittle versus ductile fracture are illustrated along with optical micrographs of fracture surfaces.