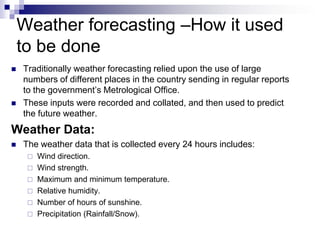
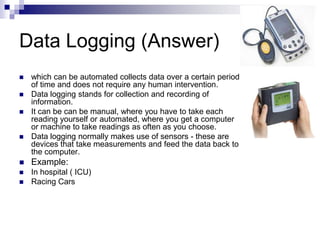
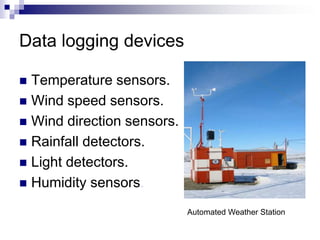
Weather forecasting –How it used
to be done
 Traditionally weather forecasting relied upon the use of large
numbers of different places in the country sending in regular reports
to the government’s Metrological Office.
 These inputs were recorded and collated, and then used to predict
the future weather.
Weather Data:
 The weather data that is collected every 24 hours includes:
 Wind direction.
 Wind strength.
 Maximum and minimum temperature.
 Relative humidity.
 Number of hours of sunshine.
 Precipitation (Rainfall/Snow).
Problems
 How can data be collected regularly? (i.e. Every hour, on
every day, throughout the whole year)
 How can human error be avoided?
 How can more Frequent measurements.
 How accuracy of readings ( sometimes the instruments
are read incorrectly )
 Data Logging ( Answer)
 which can be automated collects data over a certain
period of time and does not require any human
intervention.
 Since there is no human errors, the measurements will
be accurate.
Data Logging (Answer)
 which can be automated collects data over a certain period
of time and does not require any human intervention.
 Data logging stands for collection and recording of
information.
 It can be can be manual, where you have to take each
reading yourself or automated, where you get a computer
or machine to take readings as often as you choose.
 Data logging normally makes use of sensors - these are
devices that take measurements and feed the data back to
the computer.
 Example:
 In hospital ( ICU)
 Racing Cars
Data logging devices
 Temperature sensors.
 Wind speed sensors.
 Wind direction sensors.
 Rainfall detectors.
 Light detectors.
 Humidity sensors.
Automated Weather Station
1.Temperature sensors
 These are heat-sensitive sensors that produce an
analogue temperature signal which is converted (via
an analogue-to-digital converter) to a digital signal.
 This signal is then stored in a microprocessor that is
downloaded regularly.
2. Wind speed sensors
 A revolving anemometer (which it spins faster or
slower depending upon the speed of the wind) is
used to measure wind speed.
 An optical sensor counts the number of times the
anemometer revolves in a given length of time, and
converts the number into a binary digital signal that
can be stored and download later.
3.Wind direction sensors
 These use a grey code disk attached to a weather vane.
 As the weather vane moves, optical sensors read the disk
and generate a three bit binary pattern that can be stored
for later downloading.
4. Rainfall detectors
 Rainfall is collected in small buckets which, when full, tilt
and empty.
 An optical sensor detects each time a bucket tips, and
saves the number of ‘tips’ as a digital number that can be
downloaded later.
 This measures how much rain has fallen over a period of
time.
5. Light detectors
 These use a special diode that registers the
number of times and the length of time the sun
shines during a given length of time.
 This analogue information is converted into
digital signal that can be stored and later
downloaded
 Digital signal used by microprocessor to
determine sunrise and sunset
Analogue –to- digital
Analogue
 Which is continuously variable and
do not jump in steps from value to
value.
 Analogue need to be converted to
digital values using an ADC.
 All quantities measured by the
weather reporter.
 A rainfall meter measures rainfall
in this system is analogue.
 Temp don’t jump from one degree
straight to the next, there are
many values in between.
Digital
 That jump from one value to the
next.
 It’s a discrete values.
 Can be fed directly into the
processor
 Most computers process only
digital values.
 The sensors itself counts the
number of buckets that are filled.
 Wind speed anemometer
measures wind speed is digital
value.
Advantages of data Logging
 Data Logging can be used in remote or dangerous situations
 Data logging can be carried out 24 hours a day, 365 days of the
year
 Time intervals for collecting data can be very frequent and regular,
for example, hundreds of measurements per second
 can be set up to start at a time in the future
 No need to have a person present
 Data logging is often more accurate because there is no likelihood of
human error.
 Data logging devices can be sent to places that humans can not
easily get to. e.g. to the planet Mars or onto a roof of a tall building
to get to a weather station.
 Graphs and tables of results can be produced automatically by the
data logging software.
Disadvantages of data Logging
 If the data logging equipment breaks down or
malfunctions, some data could be lost or not
recorded
 Equipment can be expensive for small tasks.
 The equipment will only take readings at the
logging interval which has been set up.
 If something unexpected happens between
recordings, the data will not be collected.
Weather Satellites
 By using weather reporter and images from
the satellite orbiting the earth.
 How weather satellite produce
pictures:
 Transmit pictures as coded radio signals.
 The coded signal is picked up with satellite
dish on the earth.
 Use of satellite images
 Determine the amount of cloud covered.
 Which direction the wind is likely to
come, we can predict the weather.
 Relative temperature of land and see with
the help of infra red.
 Still pictures can be taken over a period of
time and stored.

Ch 14. weather forecasting ( application of data logging)

  • 1.
    Weather forecasting –Howit used to be done  Traditionally weather forecasting relied upon the use of large numbers of different places in the country sending in regular reports to the government’s Metrological Office.  These inputs were recorded and collated, and then used to predict the future weather. Weather Data:  The weather data that is collected every 24 hours includes:  Wind direction.  Wind strength.  Maximum and minimum temperature.  Relative humidity.  Number of hours of sunshine.  Precipitation (Rainfall/Snow).
  • 2.
    Problems  How candata be collected regularly? (i.e. Every hour, on every day, throughout the whole year)  How can human error be avoided?  How can more Frequent measurements.  How accuracy of readings ( sometimes the instruments are read incorrectly )  Data Logging ( Answer)  which can be automated collects data over a certain period of time and does not require any human intervention.  Since there is no human errors, the measurements will be accurate.
  • 3.
    Data Logging (Answer) which can be automated collects data over a certain period of time and does not require any human intervention.  Data logging stands for collection and recording of information.  It can be can be manual, where you have to take each reading yourself or automated, where you get a computer or machine to take readings as often as you choose.  Data logging normally makes use of sensors - these are devices that take measurements and feed the data back to the computer.  Example:  In hospital ( ICU)  Racing Cars
  • 4.
    Data logging devices Temperature sensors.  Wind speed sensors.  Wind direction sensors.  Rainfall detectors.  Light detectors.  Humidity sensors. Automated Weather Station
  • 5.
    1.Temperature sensors  Theseare heat-sensitive sensors that produce an analogue temperature signal which is converted (via an analogue-to-digital converter) to a digital signal.  This signal is then stored in a microprocessor that is downloaded regularly. 2. Wind speed sensors  A revolving anemometer (which it spins faster or slower depending upon the speed of the wind) is used to measure wind speed.  An optical sensor counts the number of times the anemometer revolves in a given length of time, and converts the number into a binary digital signal that can be stored and download later.
  • 6.
    3.Wind direction sensors These use a grey code disk attached to a weather vane.  As the weather vane moves, optical sensors read the disk and generate a three bit binary pattern that can be stored for later downloading. 4. Rainfall detectors  Rainfall is collected in small buckets which, when full, tilt and empty.  An optical sensor detects each time a bucket tips, and saves the number of ‘tips’ as a digital number that can be downloaded later.  This measures how much rain has fallen over a period of time.
  • 7.
    5. Light detectors These use a special diode that registers the number of times and the length of time the sun shines during a given length of time.  This analogue information is converted into digital signal that can be stored and later downloaded  Digital signal used by microprocessor to determine sunrise and sunset
  • 8.
    Analogue –to- digital Analogue Which is continuously variable and do not jump in steps from value to value.  Analogue need to be converted to digital values using an ADC.  All quantities measured by the weather reporter.  A rainfall meter measures rainfall in this system is analogue.  Temp don’t jump from one degree straight to the next, there are many values in between. Digital  That jump from one value to the next.  It’s a discrete values.  Can be fed directly into the processor  Most computers process only digital values.  The sensors itself counts the number of buckets that are filled.  Wind speed anemometer measures wind speed is digital value.
  • 9.
    Advantages of dataLogging  Data Logging can be used in remote or dangerous situations  Data logging can be carried out 24 hours a day, 365 days of the year  Time intervals for collecting data can be very frequent and regular, for example, hundreds of measurements per second  can be set up to start at a time in the future  No need to have a person present  Data logging is often more accurate because there is no likelihood of human error.  Data logging devices can be sent to places that humans can not easily get to. e.g. to the planet Mars or onto a roof of a tall building to get to a weather station.  Graphs and tables of results can be produced automatically by the data logging software.
  • 10.
    Disadvantages of dataLogging  If the data logging equipment breaks down or malfunctions, some data could be lost or not recorded  Equipment can be expensive for small tasks.  The equipment will only take readings at the logging interval which has been set up.  If something unexpected happens between recordings, the data will not be collected.
  • 11.
    Weather Satellites  Byusing weather reporter and images from the satellite orbiting the earth.  How weather satellite produce pictures:  Transmit pictures as coded radio signals.  The coded signal is picked up with satellite dish on the earth.  Use of satellite images  Determine the amount of cloud covered.  Which direction the wind is likely to come, we can predict the weather.  Relative temperature of land and see with the help of infra red.  Still pictures can be taken over a period of time and stored.