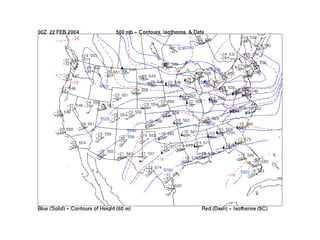
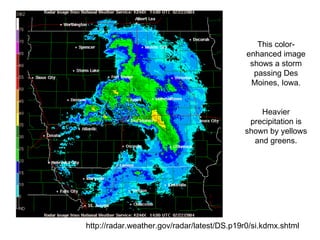
This document discusses how weather is observed and measured. It explains that weather refers to atmospheric conditions at a specific place and time, while climate deals with long-term patterns. It then describes the key variables that are measured, including temperature, pressure, wind, moisture, clouds, and precipitation. Common instruments for observing each variable are presented, as well as how weather data is represented in station models. The document concludes by noting the importance of upper-air and remote sensing data from weather balloons, satellites, and radar.
![just-say-no
true
f
-
tg/stores/d
communit
rate-item
cust-rec
cavorite-lis
nm/justsay
GET
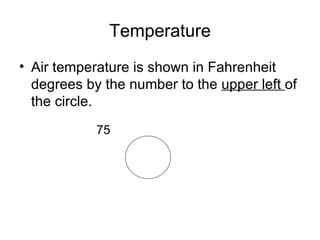
Temperature
• Temperature is a
measure of how much
heat energy the air
molecules possess
• Thermometers can
measure heat by
expanding and
contracting metal
coils (left) or liquids
(right)
[Source: www.weatheraffects.com]](https://image.slidesharecdn.com/makingtheinvisiblevisible-120626104347-phpapp01/85/Weather-and-Climate-4-320.jpg)
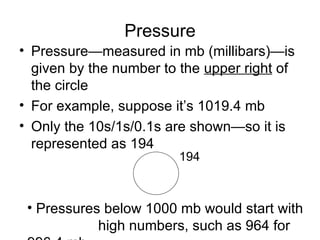
![Pressure
• Air molecules push down
on objects—including you
—with a force that we call
the “barometric pressure.”
• Metal coils in barometers,
as in thermometers,
respond to differences by
expanding or contracting,
causing a dial to move or
change the LED display
[Source: www.accumall.com]](https://image.slidesharecdn.com/makingtheinvisiblevisible-120626104347-phpapp01/85/Weather-and-Climate-5-320.jpg)
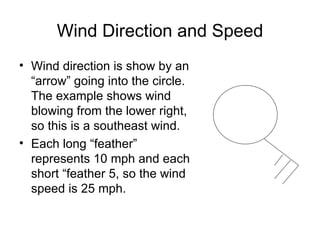
![Wind Direction and Speed
• When air moves
—”wind”—we feel both
its direction and speed
(force.)
• Direction is measured
with a “vane”—an arrow
or other shape that
points into the wind.
• Speed is measured with
an “anemometer.” The
faster the cups spin, the
faster the wind. [Source: www.fascinatingelecronics.com]](https://image.slidesharecdn.com/makingtheinvisiblevisible-120626104347-phpapp01/85/Weather-and-Climate-6-320.jpg)
![Measuring RH
• “Sling psychrometers”
have “dry bulbs” and
“wet bulbs.”
• Using the difference
between the two (“wet
bulb depression”) and
charts allow calculation
of the relative humidity.
• “Hygrometers” also
measure RH
[Sources:www.novalynx.com and www.accumall.com]](https://image.slidesharecdn.com/makingtheinvisiblevisible-120626104347-phpapp01/85/Weather-and-Climate-8-320.jpg)
![Types of Clouds
In the early 1800s, Luke Howard (a science
teacher in England) published a system to
describe different types of clouds.
He used the term
CUMULUS for
“fluffy” clouds.
[http://inspire.ospi.wednet.edu:8001/curric/weather/pricloud/]](https://image.slidesharecdn.com/makingtheinvisiblevisible-120626104347-phpapp01/85/Weather-and-Climate-13-320.jpg)