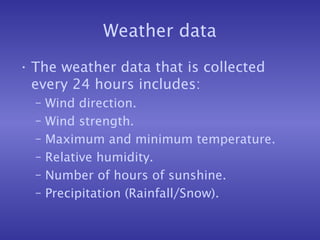
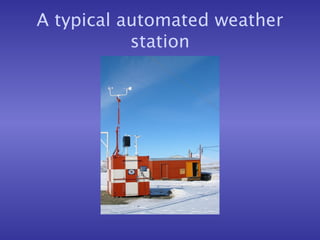
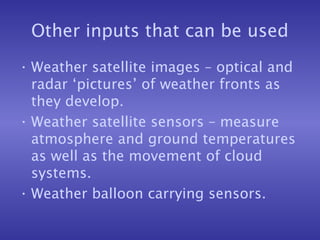
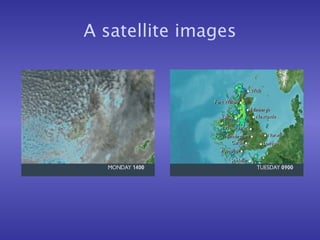
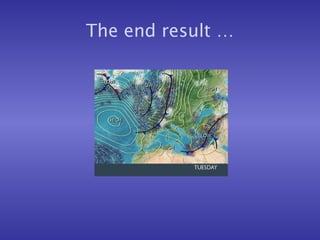
GCSE ICT
Data logging – Weather
forecasting case study
• As science and technology have developed, so
the need for data collection and analysis has
grown. This is fulfilled, at least in part, by
dedicated, microprocessor-driven data loggers.
• The modern data logger is typically a hand-held
battery-operated device with a large memory,
powered by the latest microprocessor
technology and capable of acquiring,
processing, storing and analysing electrical
signals at high speed from a wide range of
sensors - at regular intervals or in response to
an event such as a threshold being crossed or a
switch being activated.
• The sensors may communicate with the logger
through a cable or wireless link and may sense
temperature, humidity, pressure, flow, wind
speed, current, voltage, resistance and a host of
other physical parameters that are important in
monitoring and controlling processes or
conducting research.
• Data stored by stand-alone data loggers is
typically downloaded into a computer for more
detailed analysis and reporting, though some
data loggers have sophisticated on-board
processing and analysis capability and can carry
out some control functions such as activating an
alarm or a switch.
• The advantage of using a dedicated
portable data logger compared to, say, a
PC, is that the logger hardware and
software are specifically designed for
stand-alone data logging applications.
This means that it is easy to connect and
set up sensors and the logging system is
more rugged and less power hungry,
making it capable of running on batteries
for longer periods of time, often in hostile
environments.
Weather forecasting –How it
used to be done
• Traditionally weather forecasting
relied upon the use of large numbers
of different places in the country
sending in regular reports to the
government’s Metrological Office.
• These inputs were recorded and
collated, and then used to predict the
future weather.
Weather data
• The weather data that is collected
every 24 hours includes:
– Wind direction.
– Wind strength.
– Maximum and minimum temperature.
– Relative humidity.
– Number of hours of sunshine.
– Precipitation (Rainfall/Snow).
The problem
• How can data be collected regularly?
(i.e. Every hour, on every day,
throughout the whole year)
• How can human error be avoided?
The answer
• Data logging – which can be
automated and does not require any
human intervention.
Data logging devices
• Temperature sensors.
• Wind speed sensors.
• Wind direction sensors.
• Rainfall detectors.
• Light detectors.
• Humidity sensors.
A typical automated weather
station
Temperature sensors
• These are heat-sensitive sensors that
produce an analogue temperature
signal which is converted (via an
analogue-to-digital converter) to a
digital signal.
• This signal is then stored in a
microprocessor that is downloaded
regularly.
Wind speed sensors
• A revolving anemometer (which it
spins faster or slower depending upon
the speed of the wind) is used to
measure wind speed.
• An optical sensor counts the number
of times the anemometer revolves in a
given length of time, and converts the
number into a binary digital signal
that can be stored and download later.
Wind direction sensors
• These use a grey code disk attached
to a weather vane.
• As the weather vane moves, optical
sensors read the disk and generate a
three bit binary pattern that can be
stored for later downloading.
Rainfall detectors
• Rainfall is collected in small buckets
which, when full, tilt and empty.
• An optical sensor detects each time a
bucket tips, and saves the number of
‘tips’ as a digital number that can be
downloaded later.
Light detectors
• These use a special diode that
registers the number of times and the
length of time the sun shines during a
given length of time.
• This analogue information is
converted into digital signal that can
be stored and later downloaded.
Other inputs that can be used
• Weather satellite images – optical and
radar ‘pictures’ of weather fronts as
they develop.
• Weather satellite sensors – measure
atmosphere and ground temperatures
as well as the movement of cloud
systems.
• Weather balloon carrying sensors.
A satellite images
The end result …

14 data logging

  • 1.
    GCSE ICT Data logging– Weather forecasting case study
  • 2.
    • As scienceand technology have developed, so the need for data collection and analysis has grown. This is fulfilled, at least in part, by dedicated, microprocessor-driven data loggers. • The modern data logger is typically a hand-held battery-operated device with a large memory, powered by the latest microprocessor technology and capable of acquiring, processing, storing and analysing electrical signals at high speed from a wide range of sensors - at regular intervals or in response to an event such as a threshold being crossed or a switch being activated.
  • 3.
    • The sensorsmay communicate with the logger through a cable or wireless link and may sense temperature, humidity, pressure, flow, wind speed, current, voltage, resistance and a host of other physical parameters that are important in monitoring and controlling processes or conducting research. • Data stored by stand-alone data loggers is typically downloaded into a computer for more detailed analysis and reporting, though some data loggers have sophisticated on-board processing and analysis capability and can carry out some control functions such as activating an alarm or a switch.
  • 4.
    • The advantageof using a dedicated portable data logger compared to, say, a PC, is that the logger hardware and software are specifically designed for stand-alone data logging applications. This means that it is easy to connect and set up sensors and the logging system is more rugged and less power hungry, making it capable of running on batteries for longer periods of time, often in hostile environments.
  • 5.
    Weather forecasting –Howit used to be done • Traditionally weather forecasting relied upon the use of large numbers of different places in the country sending in regular reports to the government’s Metrological Office. • These inputs were recorded and collated, and then used to predict the future weather.
  • 6.
    Weather data • Theweather data that is collected every 24 hours includes: – Wind direction. – Wind strength. – Maximum and minimum temperature. – Relative humidity. – Number of hours of sunshine. – Precipitation (Rainfall/Snow).
  • 7.
    The problem • Howcan data be collected regularly? (i.e. Every hour, on every day, throughout the whole year) • How can human error be avoided?
  • 8.
    The answer • Datalogging – which can be automated and does not require any human intervention.
  • 9.
    Data logging devices •Temperature sensors. • Wind speed sensors. • Wind direction sensors. • Rainfall detectors. • Light detectors. • Humidity sensors.
  • 10.
    A typical automatedweather station
  • 11.
    Temperature sensors • Theseare heat-sensitive sensors that produce an analogue temperature signal which is converted (via an analogue-to-digital converter) to a digital signal. • This signal is then stored in a microprocessor that is downloaded regularly.
  • 12.
    Wind speed sensors •A revolving anemometer (which it spins faster or slower depending upon the speed of the wind) is used to measure wind speed. • An optical sensor counts the number of times the anemometer revolves in a given length of time, and converts the number into a binary digital signal that can be stored and download later.
  • 13.
    Wind direction sensors •These use a grey code disk attached to a weather vane. • As the weather vane moves, optical sensors read the disk and generate a three bit binary pattern that can be stored for later downloading.
  • 14.
    Rainfall detectors • Rainfallis collected in small buckets which, when full, tilt and empty. • An optical sensor detects each time a bucket tips, and saves the number of ‘tips’ as a digital number that can be downloaded later.
  • 15.
    Light detectors • Theseuse a special diode that registers the number of times and the length of time the sun shines during a given length of time. • This analogue information is converted into digital signal that can be stored and later downloaded.
  • 16.
    Other inputs thatcan be used • Weather satellite images – optical and radar ‘pictures’ of weather fronts as they develop. • Weather satellite sensors – measure atmosphere and ground temperatures as well as the movement of cloud systems. • Weather balloon carrying sensors.
  • 17.
  • 18.