Downloaded 484 times
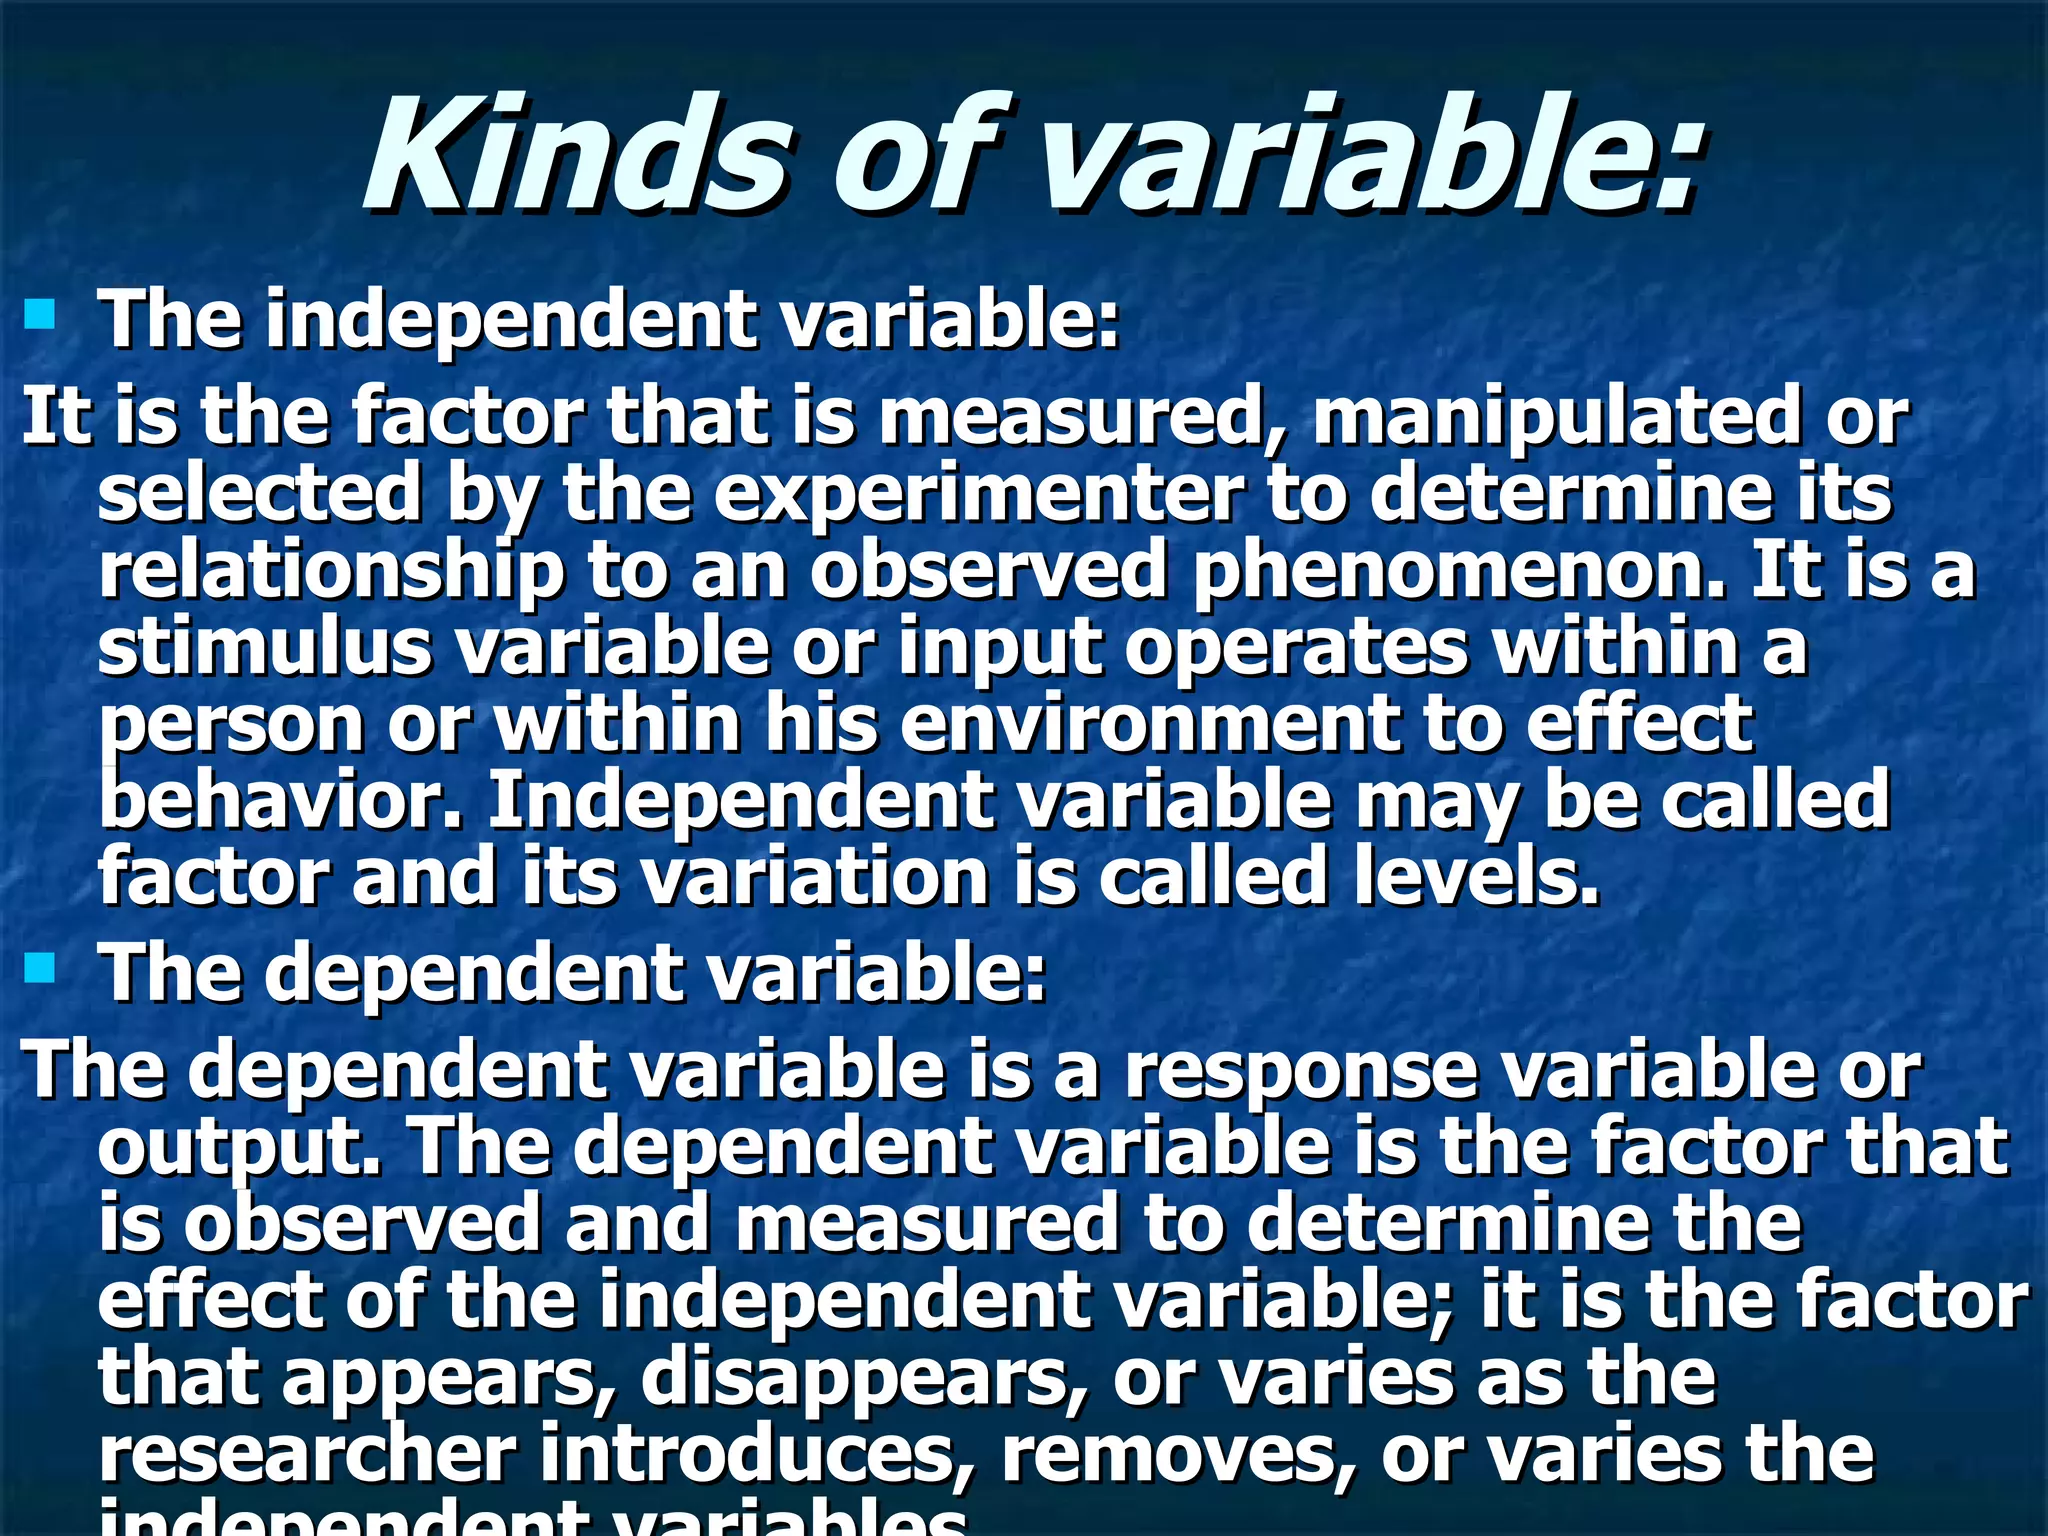


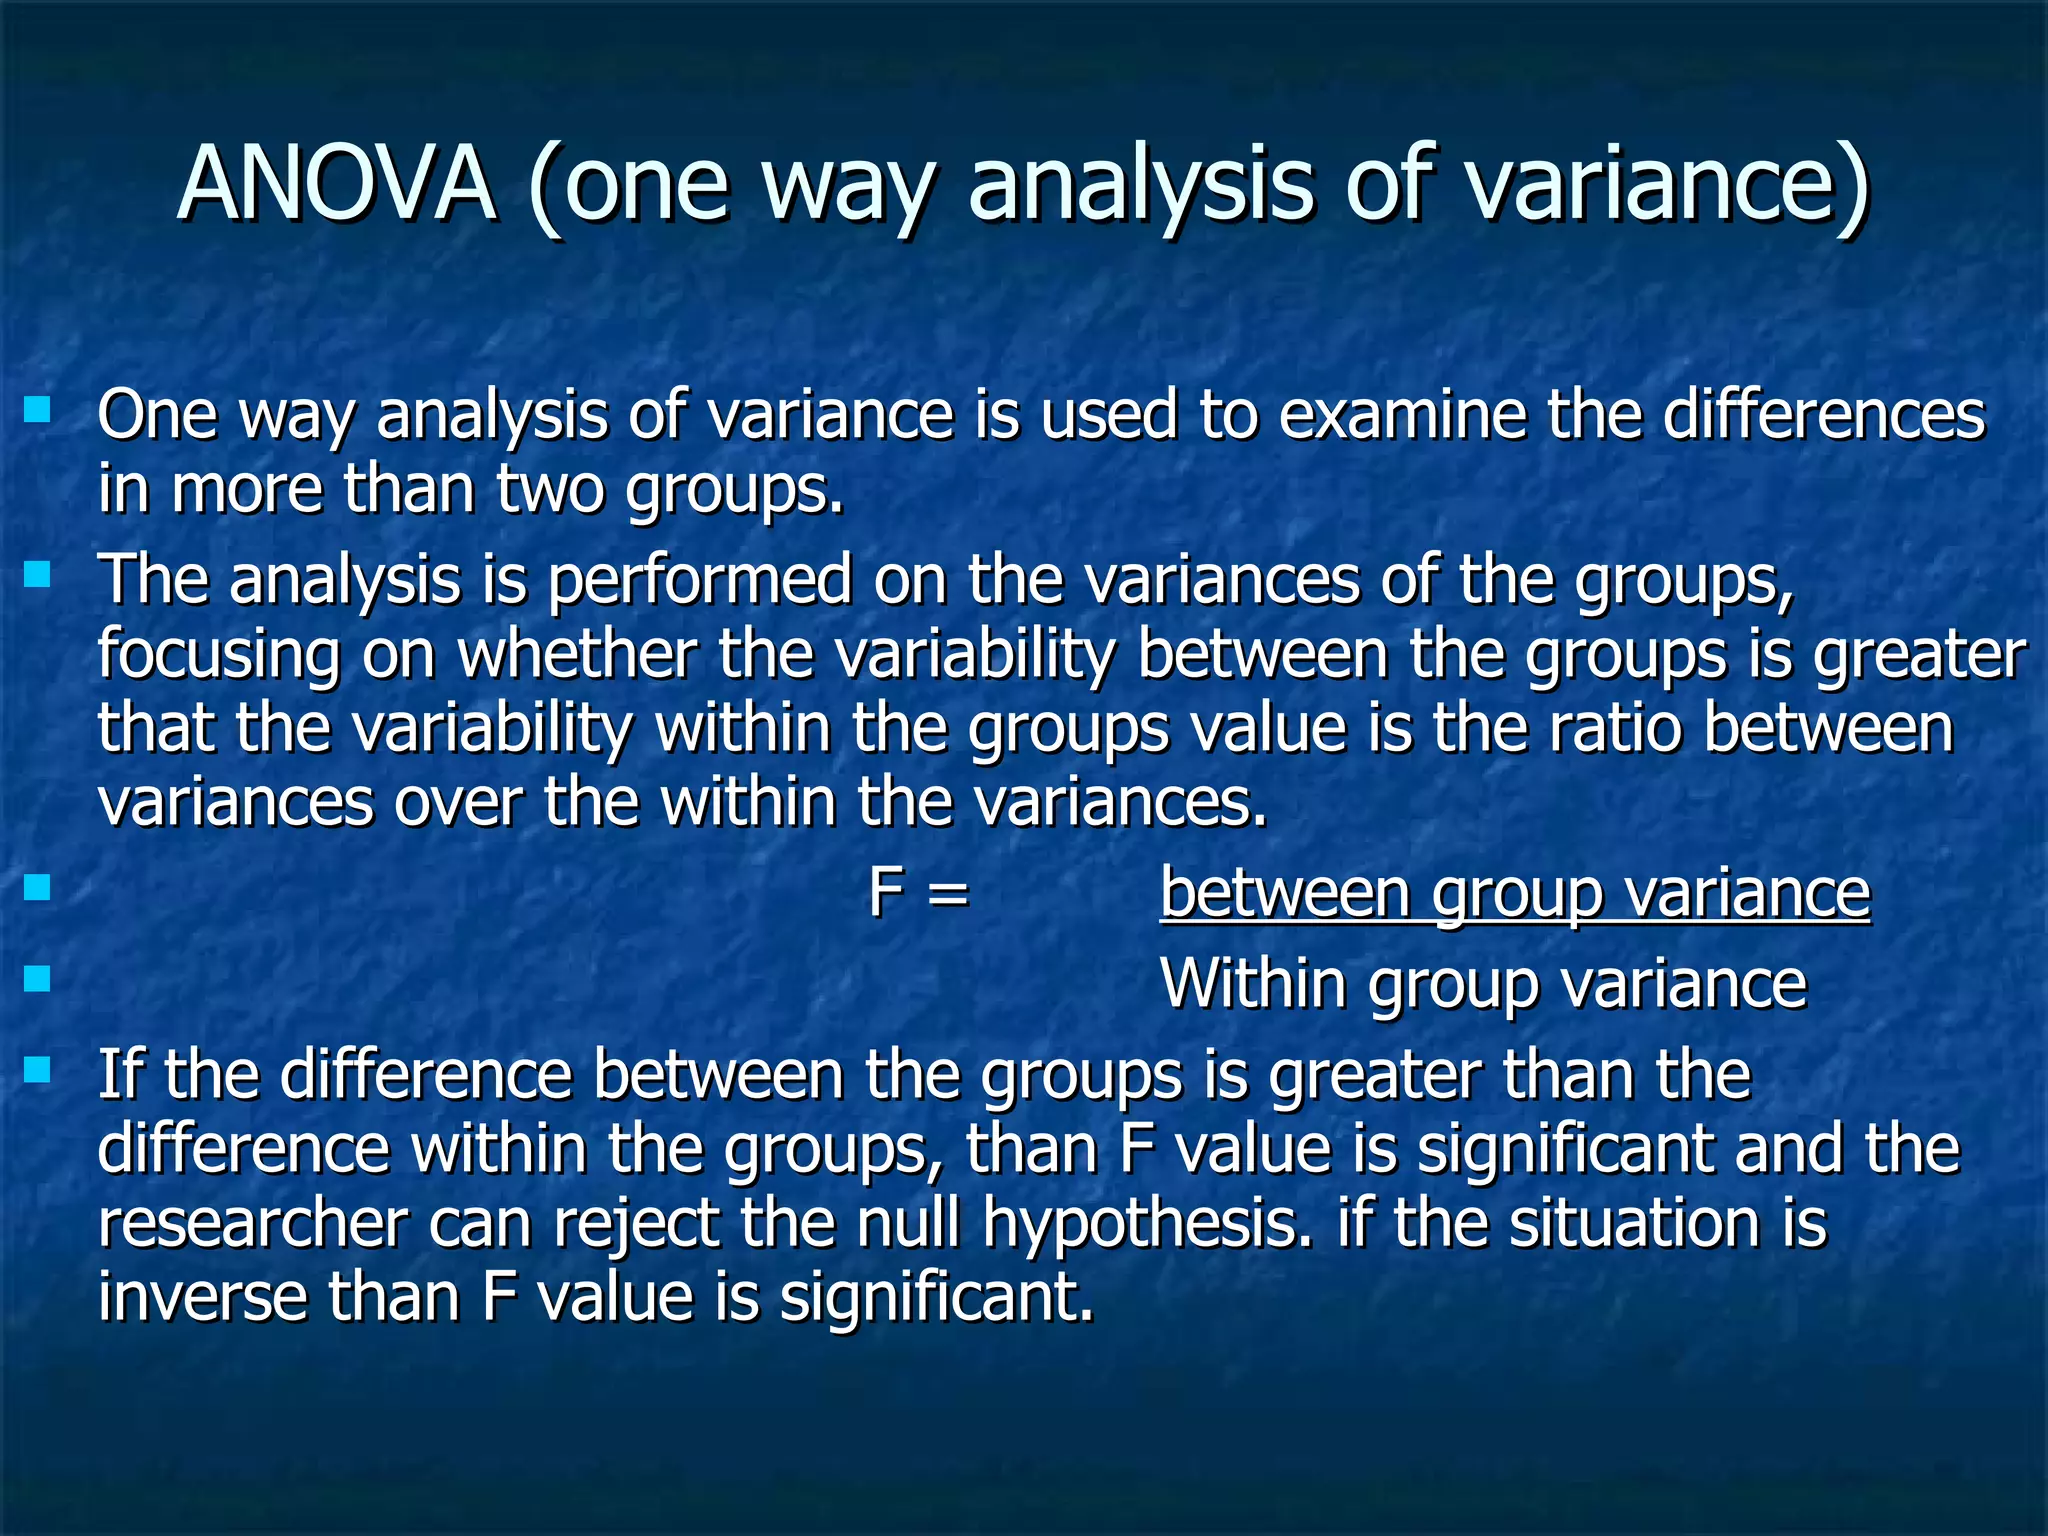


The document discusses different types of variables in experimental research: - Independent variable: Factor manipulated by researcher to determine its effect - Dependent variable: Factor observed and measured to determine effect of independent variable - Moderator variable: Factor that modifies relationship between independent and dependent variables - Control variable: Factors controlled by researcher to neutralize their effects - Intervening variable: Factor that theoretically affects phenomena but cannot be directly observed It also discusses data types, central tendency measures, data variability measures, and statistical techniques like correlation analysis, t-tests, ANOVA that are used for quantitative analysis.


![Coded Agents – with UiPath SDK + LangGraph [Virtual Hands-on Workshop]](https://cdn.slidesharecdn.com/ss_thumbnails/codedagentsdeck-251215155422-5497c599-thumbnail.jpg?width=640&height=640&fit=bounds)


