The document discusses problem solving techniques, specifically the fishbone diagram. It provides detailed instructions on how to construct and utilize a fishbone diagram to identify and categorize potential causes for complex problems. Major steps include:
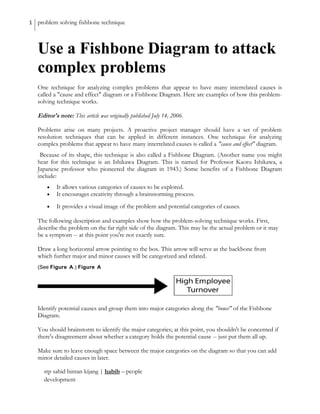
1) Identifying the problem and drawing the backbone of the fishbone diagram
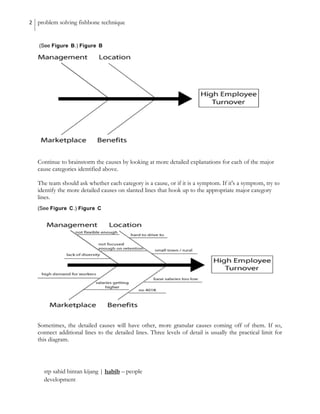
2) Brainstorming and grouping potential causes into major categories along the bones
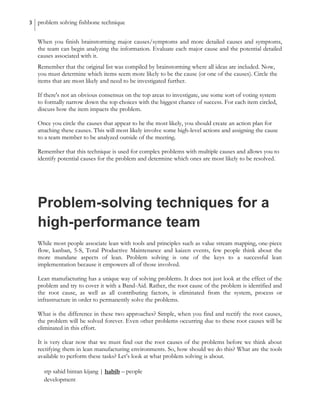
3) Continuing to brainstorm more detailed explanations and causes within each category
4) Evaluating the causes to determine the most likely ones to investigate further
The overall purpose is to use the visual diagram to systematically explore various categories of causes and potential root causes of problems.


![7 Quality Control Tools (SQC Model) [MARCH 2009]](https://cdn.slidesharecdn.com/ss_thumbnails/cfakepath7qctools-100630225608-phpapp01-thumbnail.jpg?width=640&height=640&fit=bounds)


