Downloaded 752 times


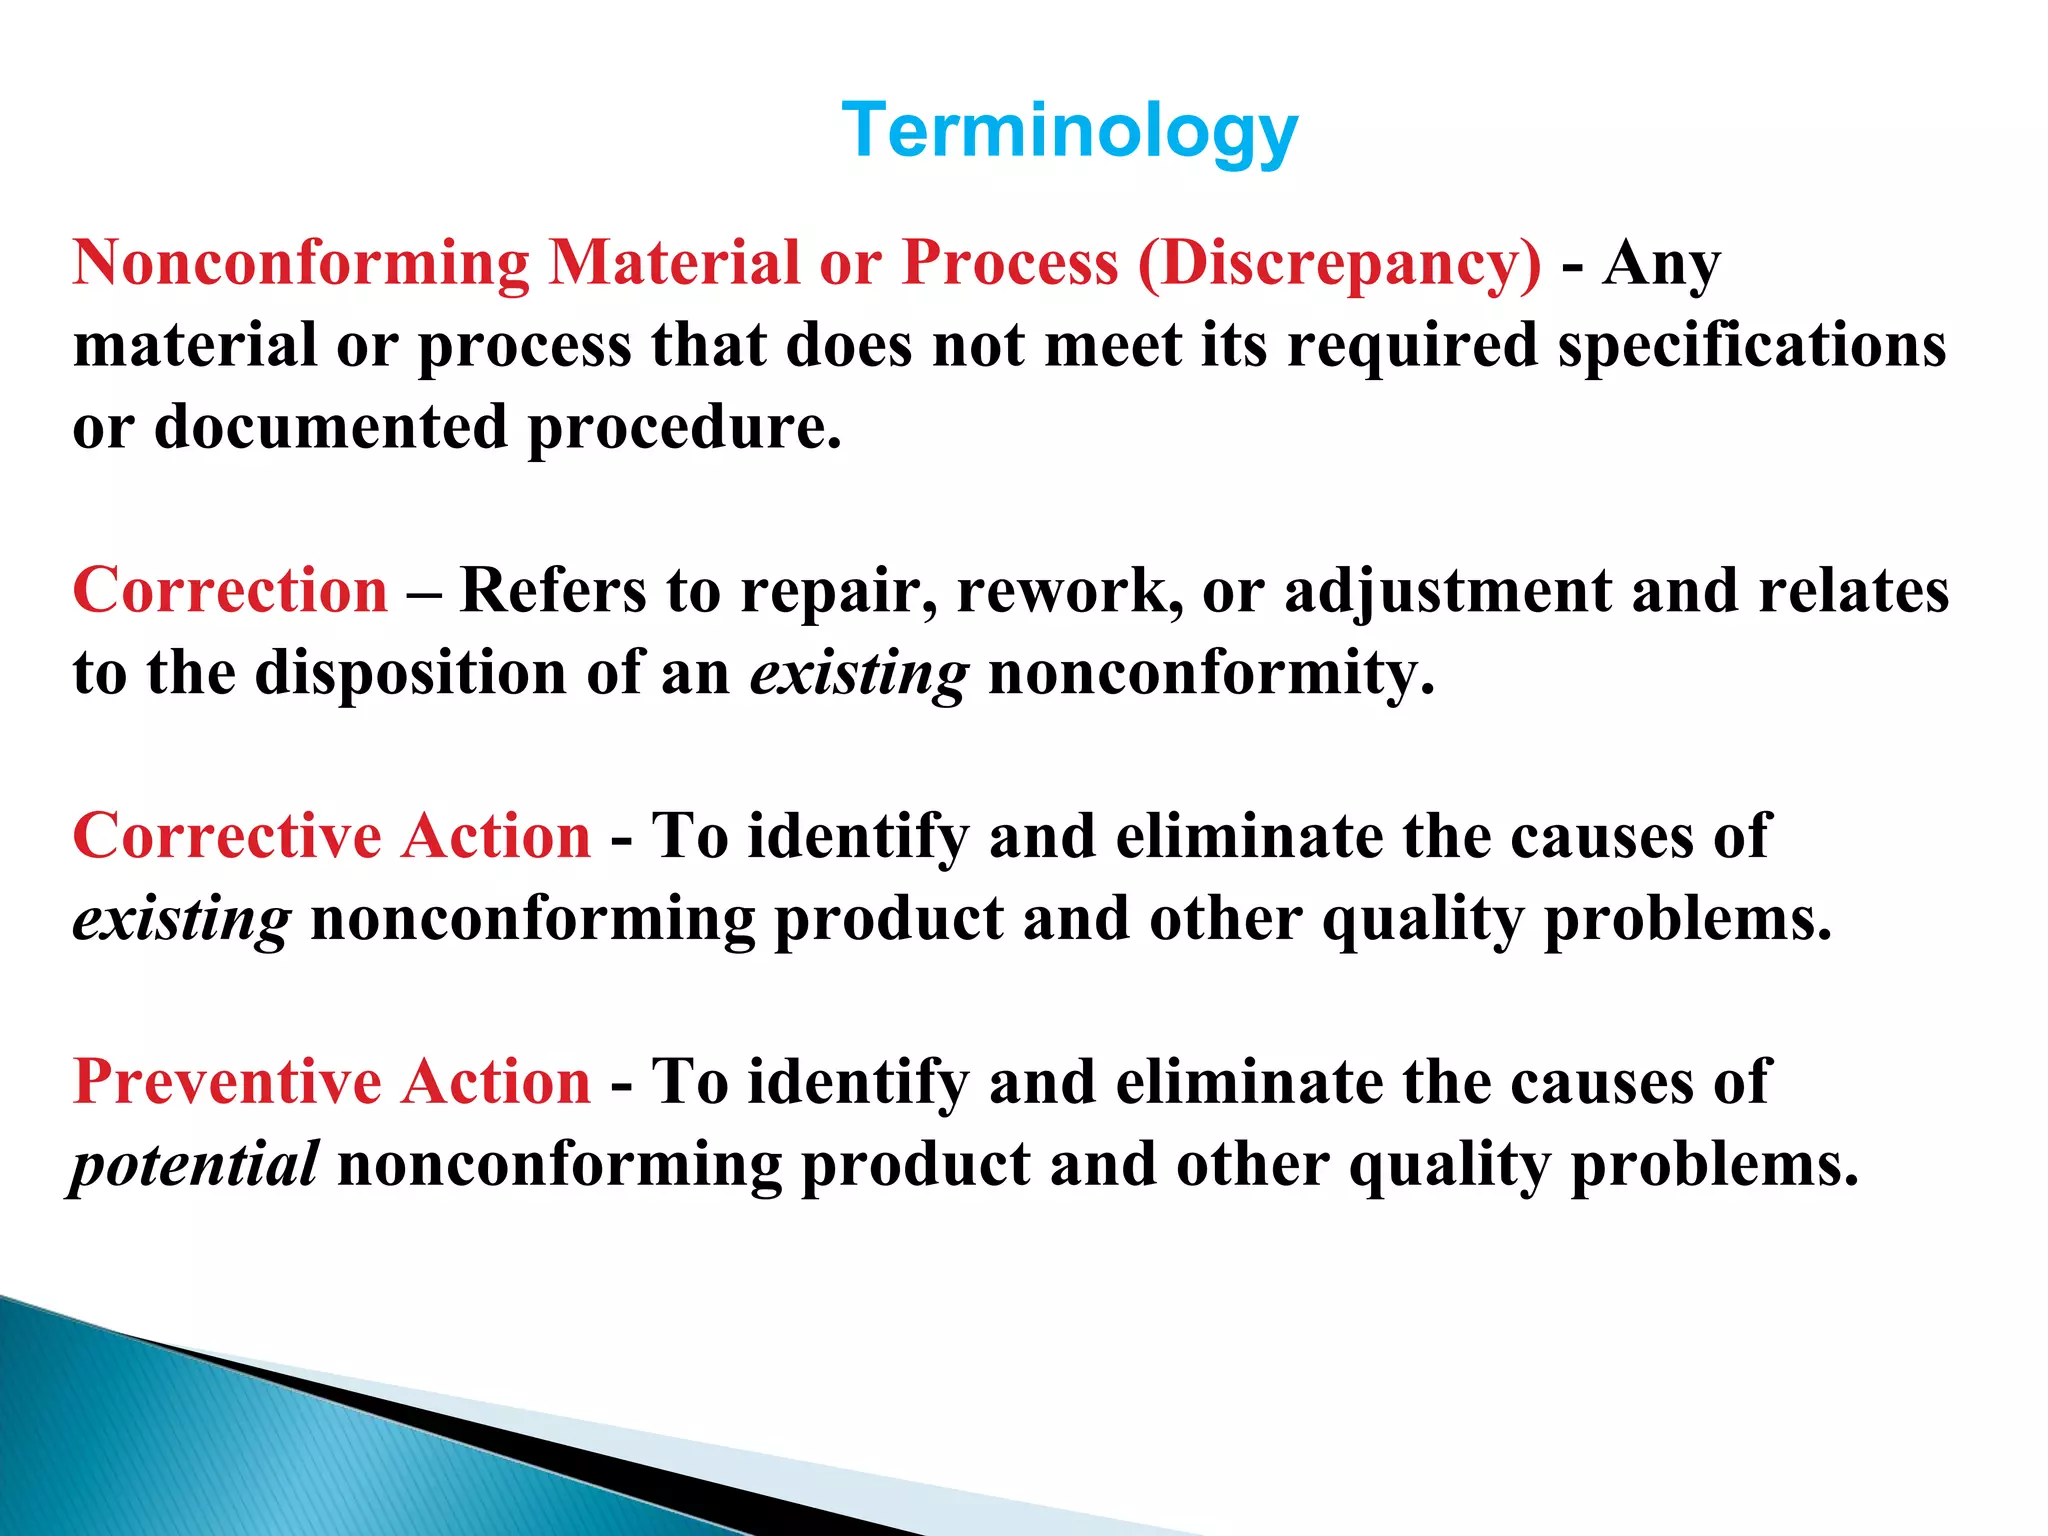
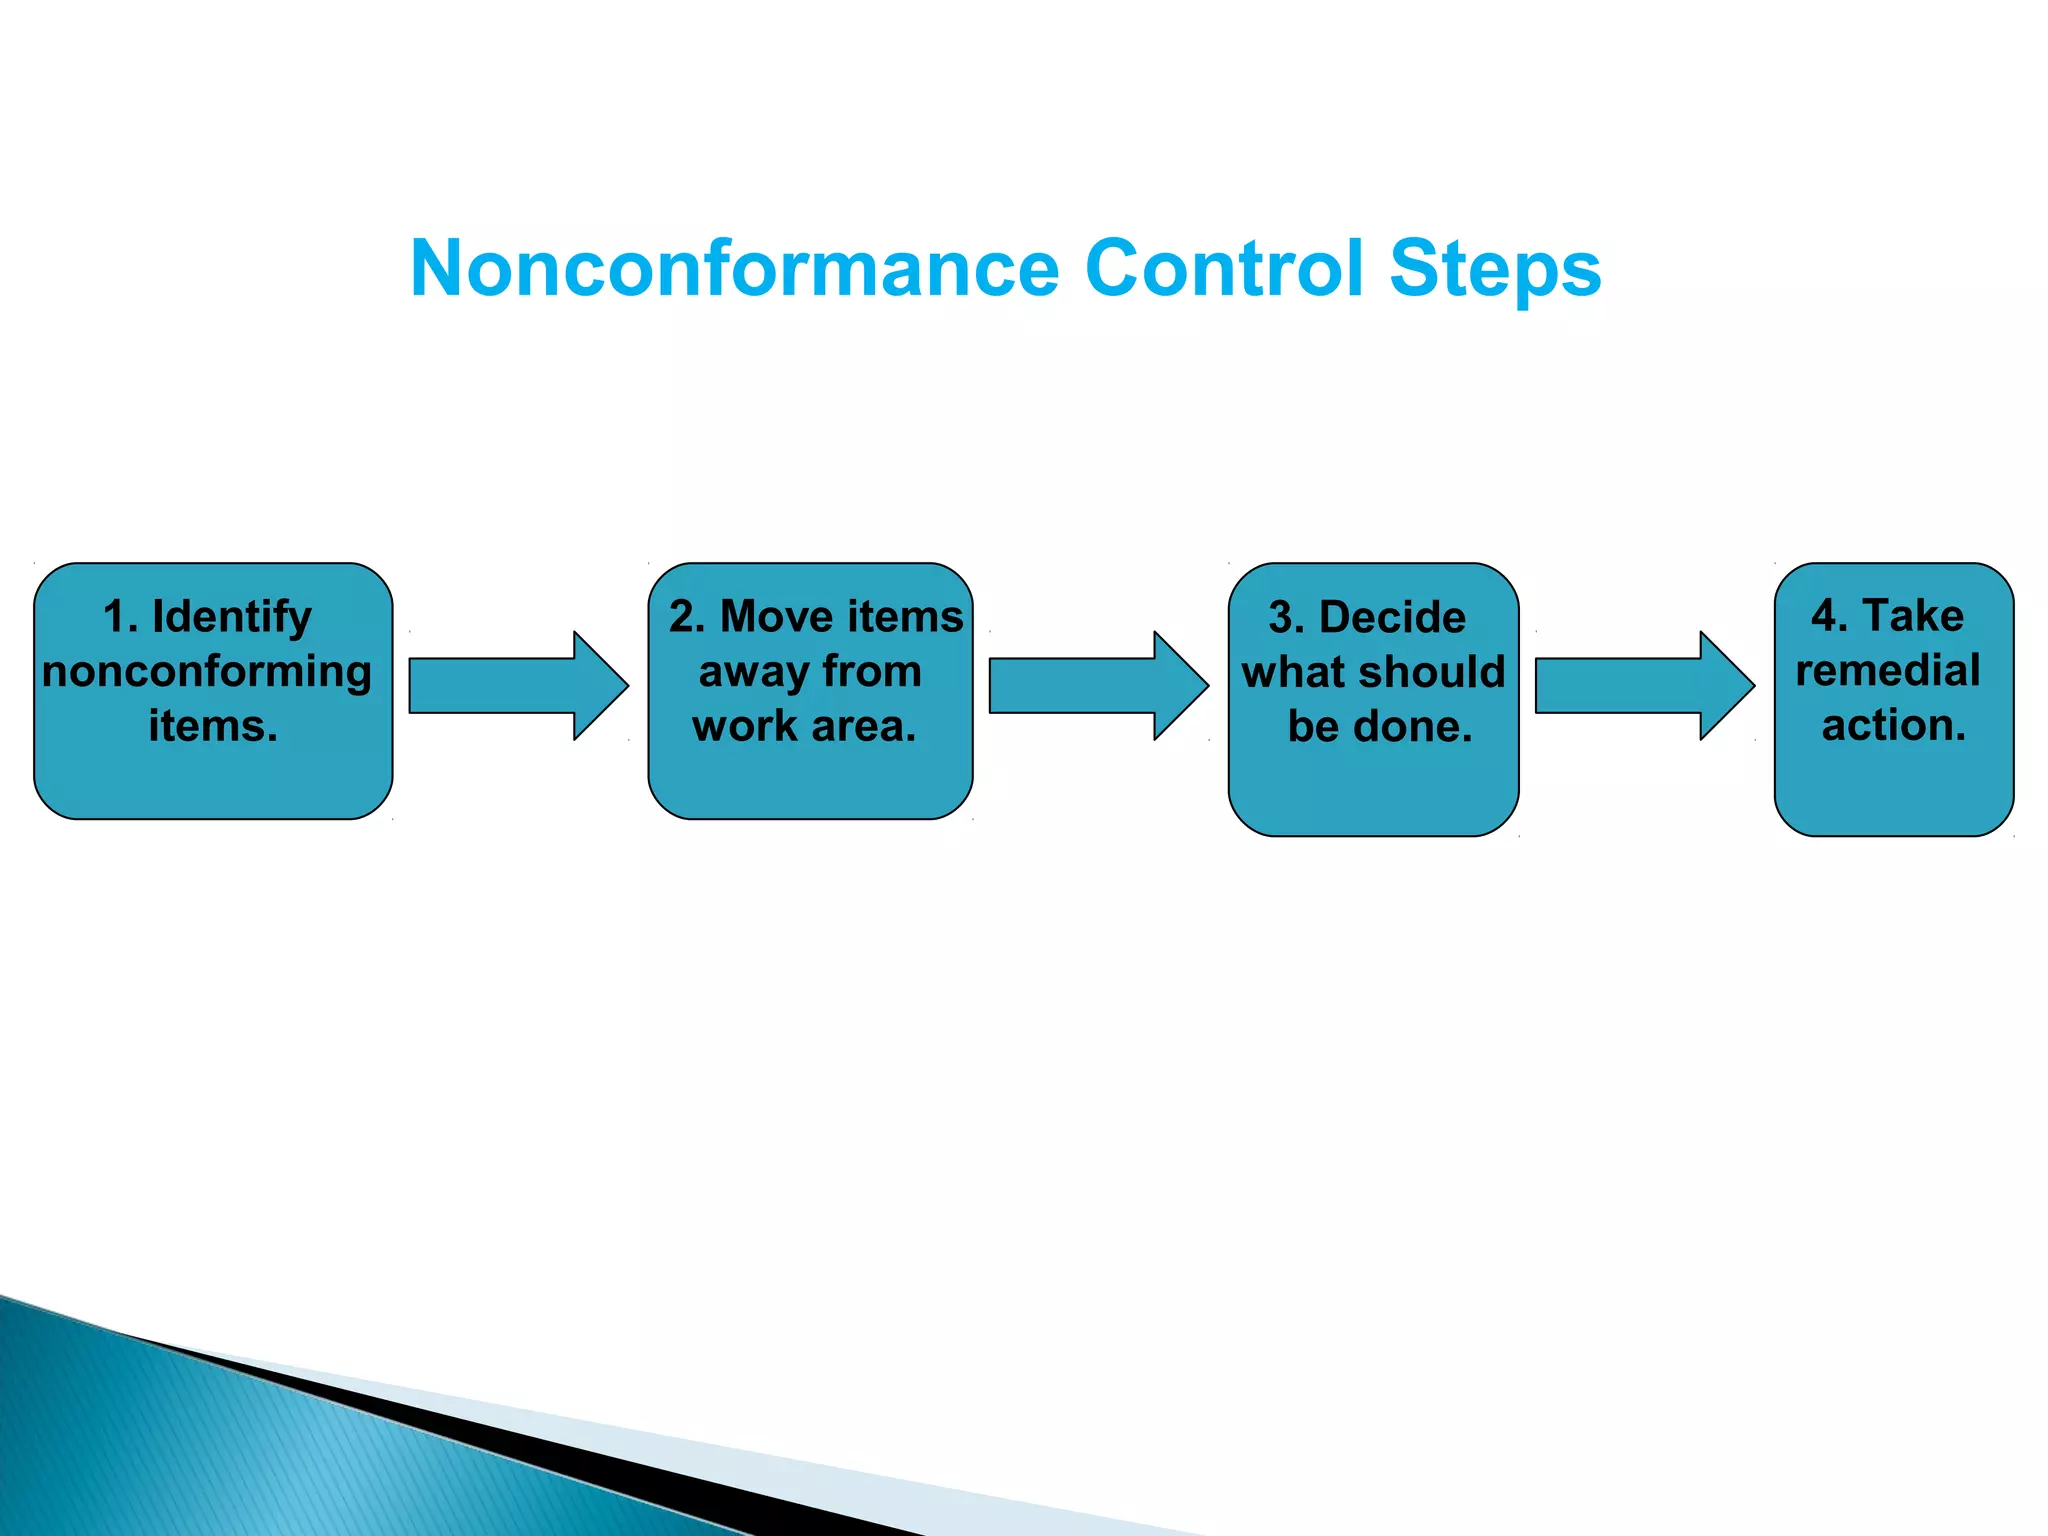

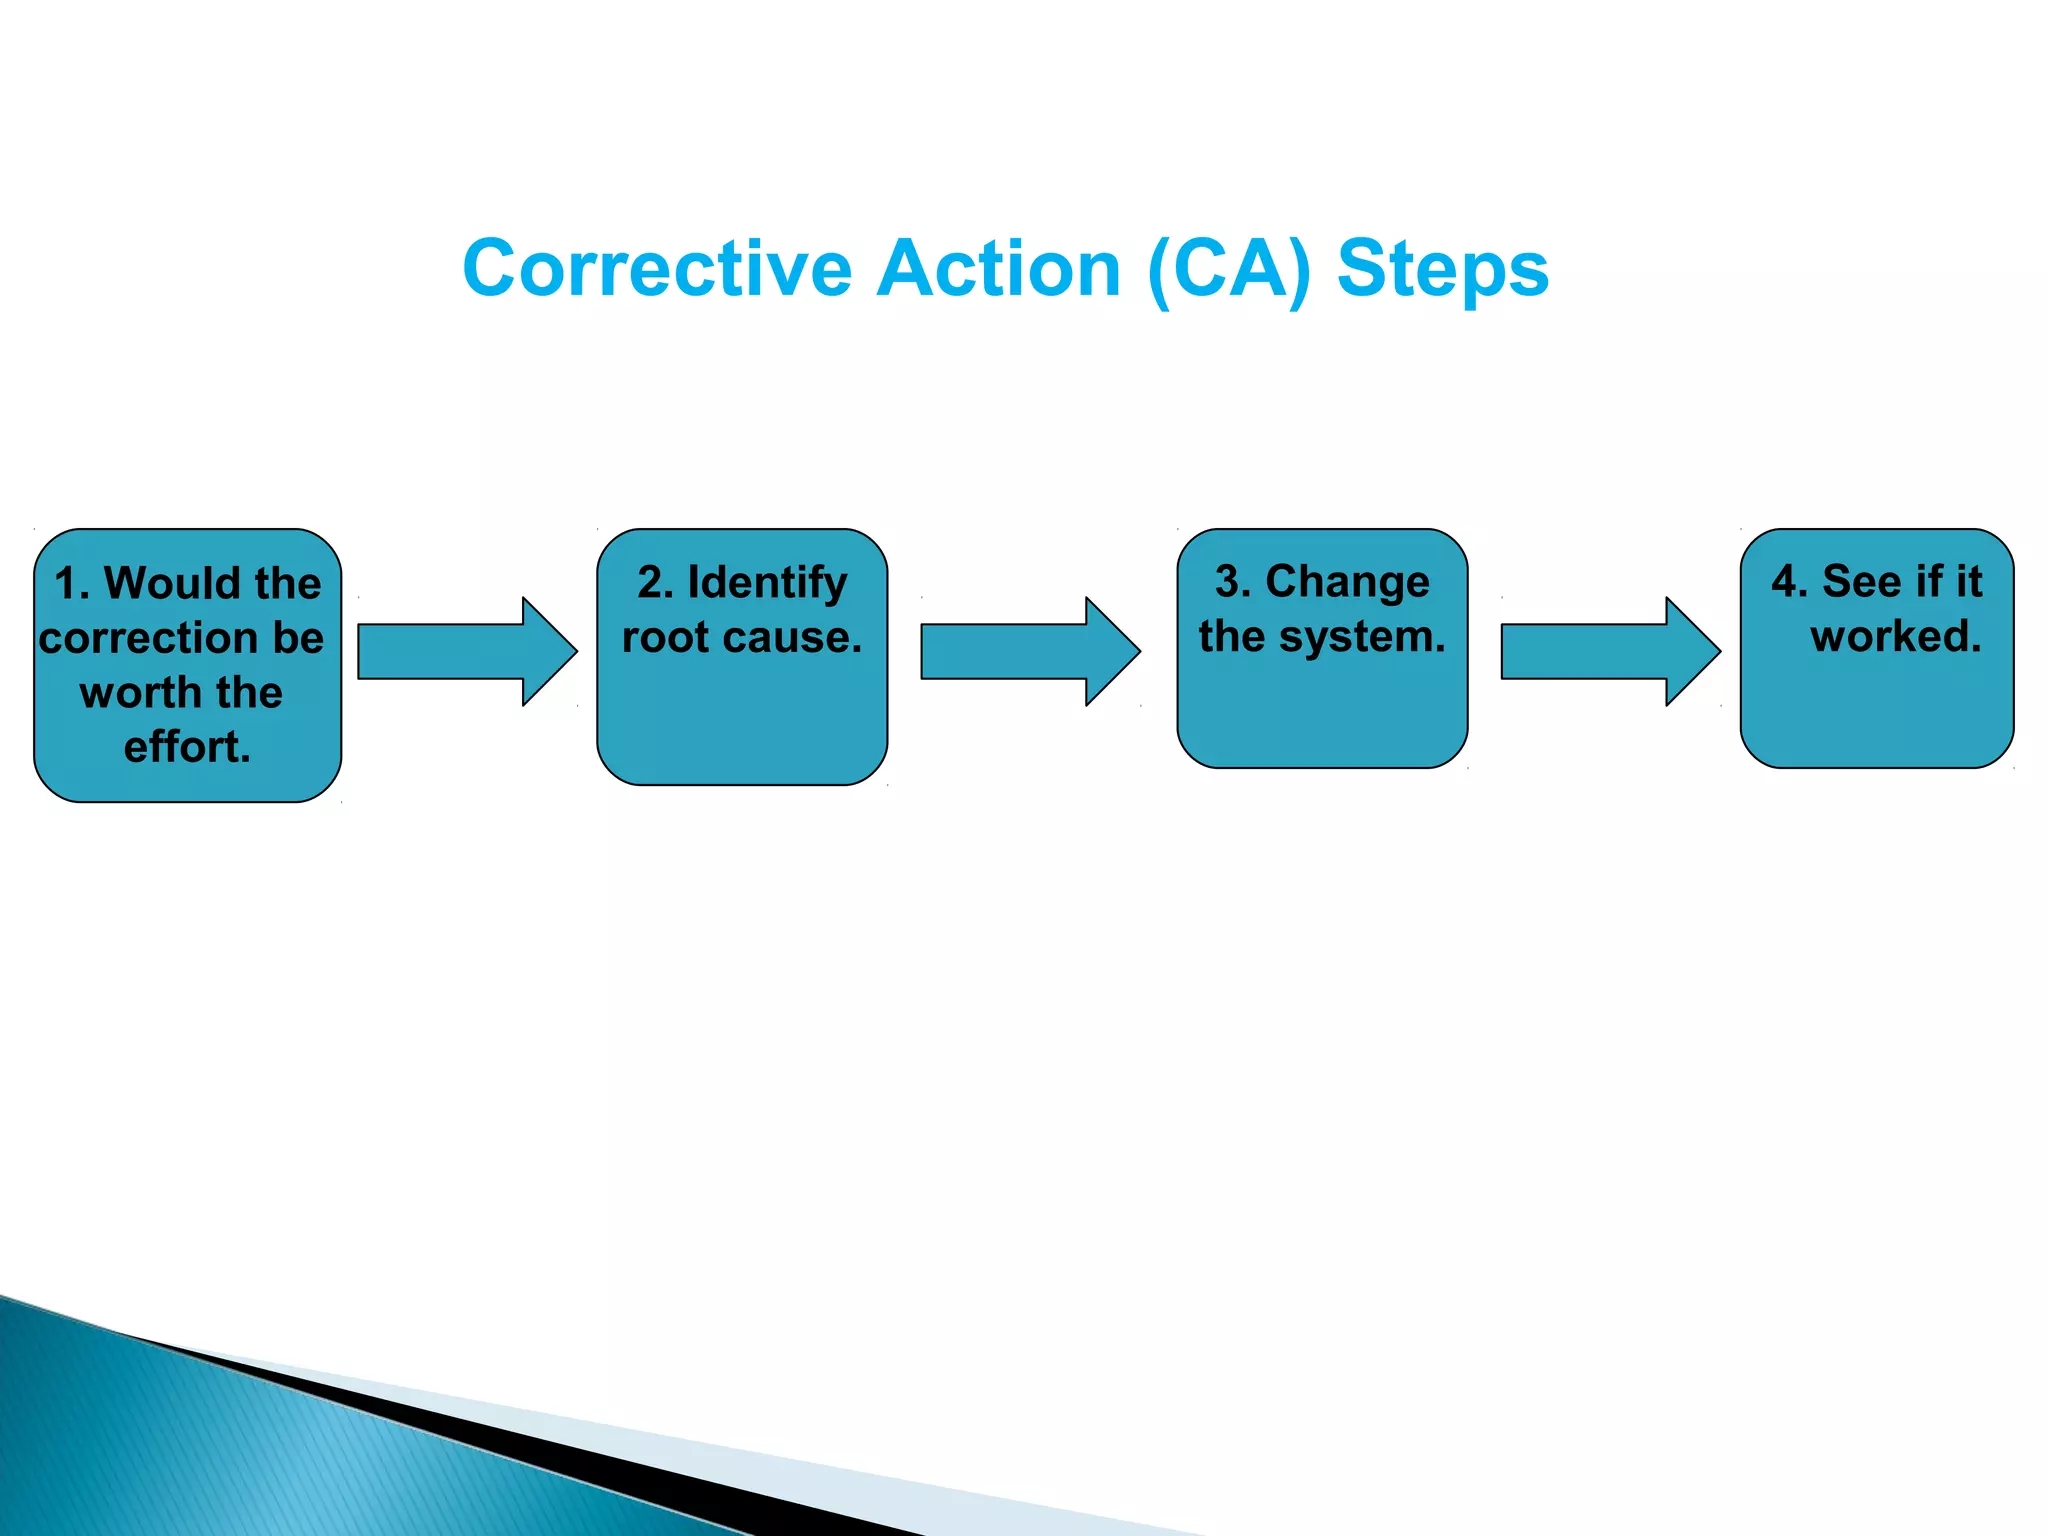


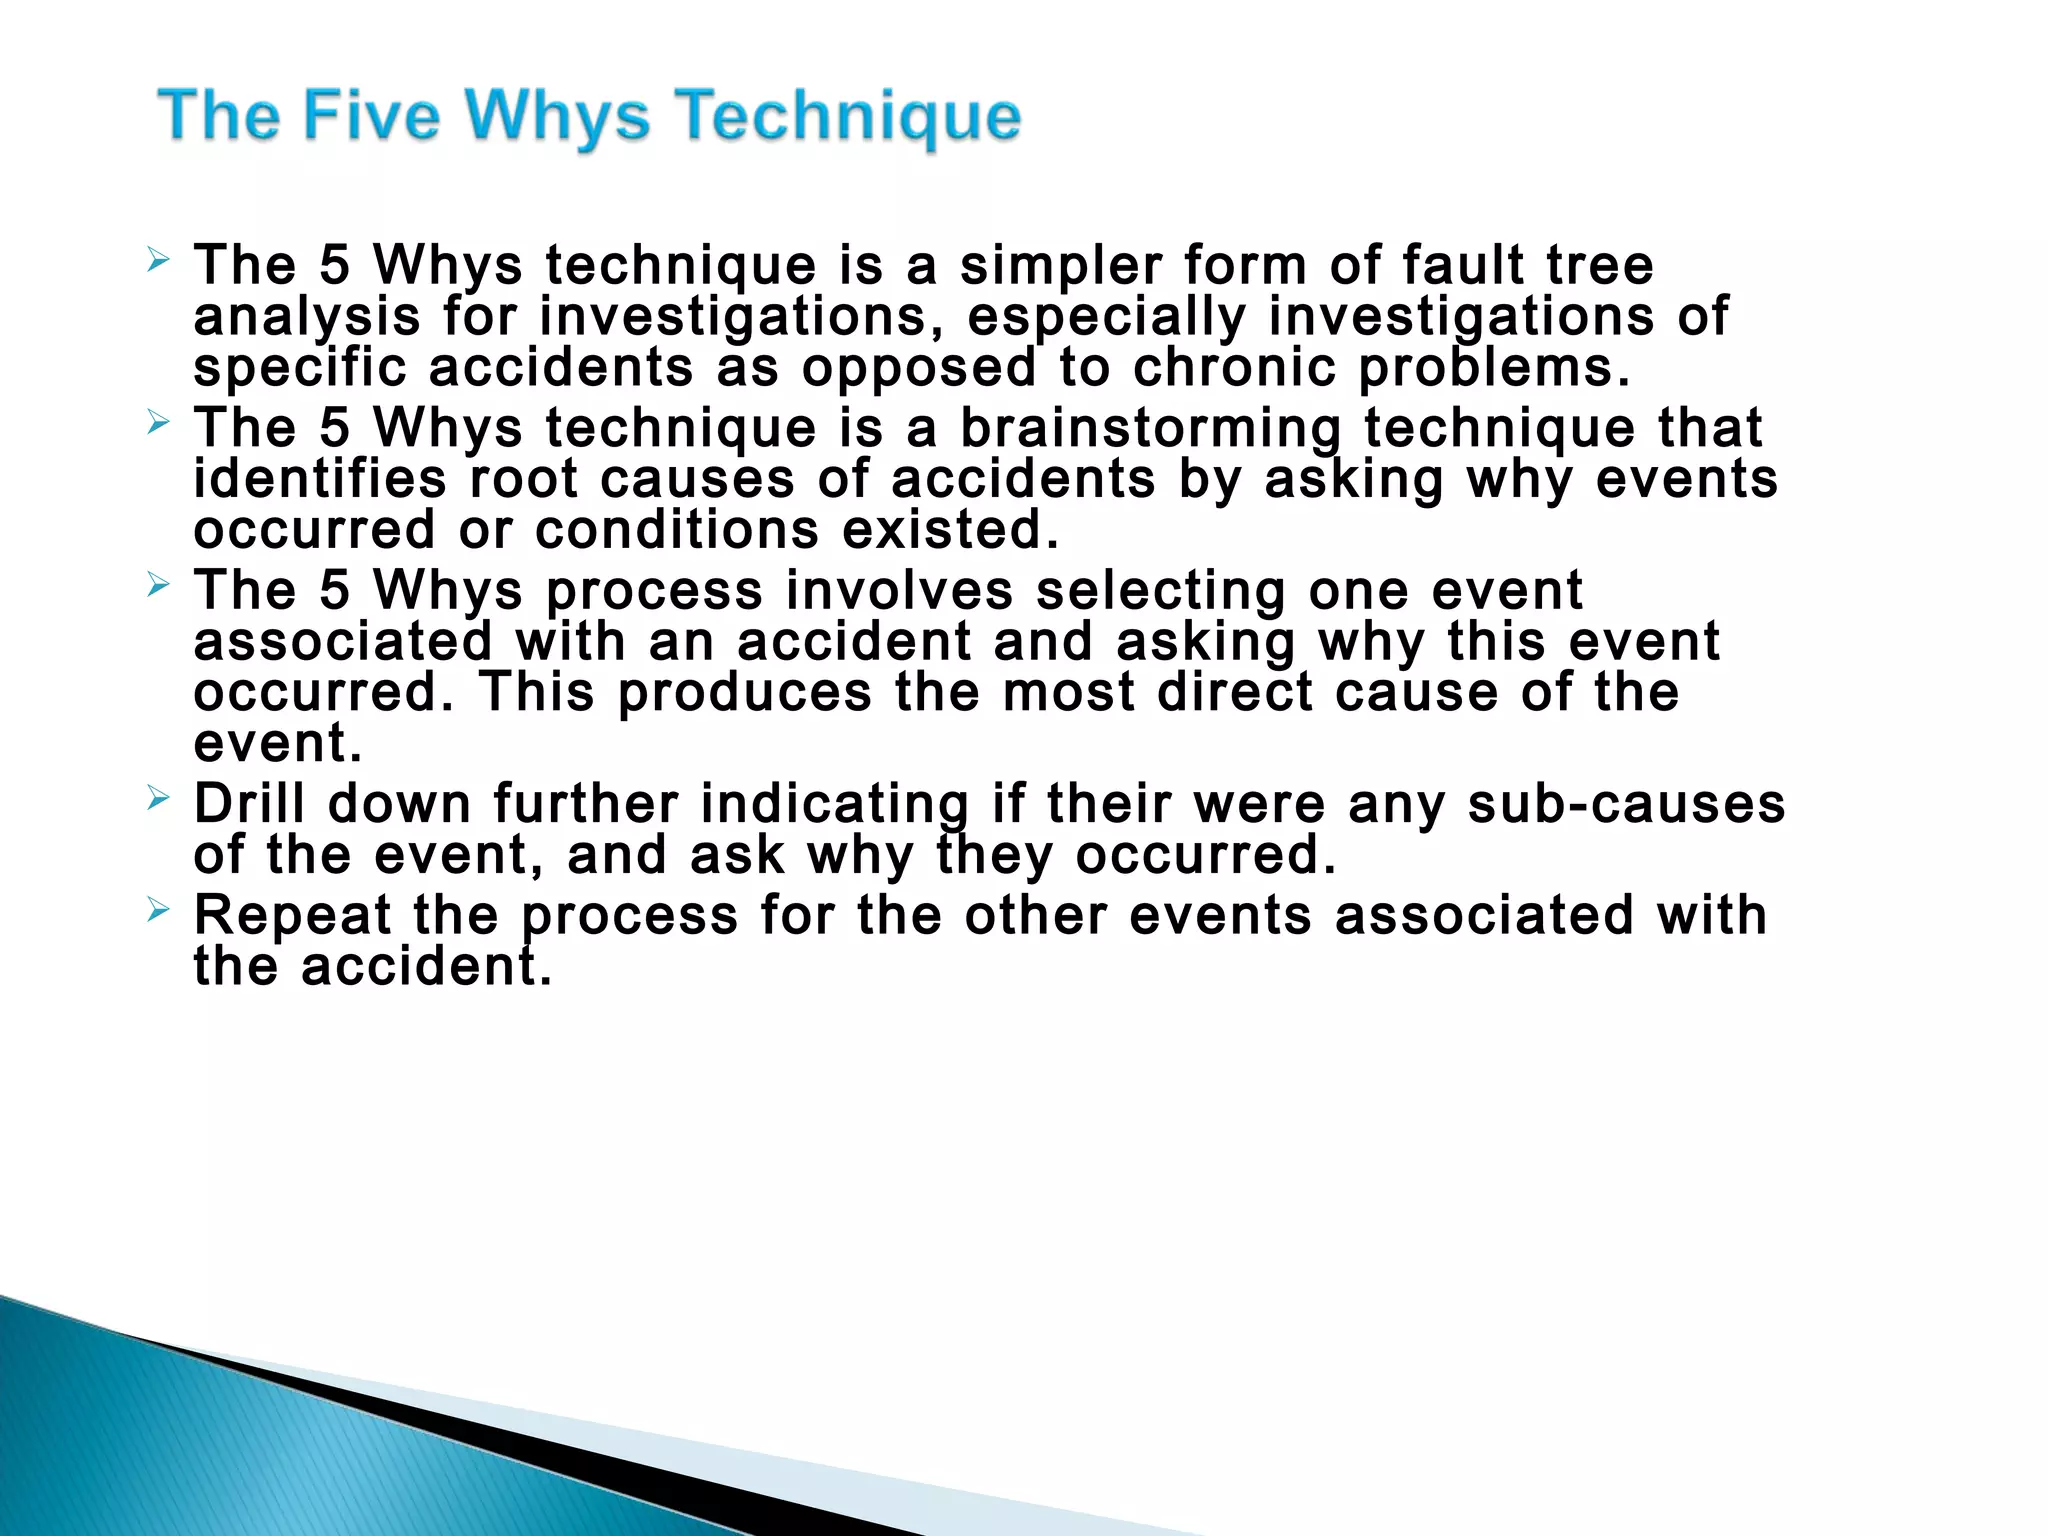


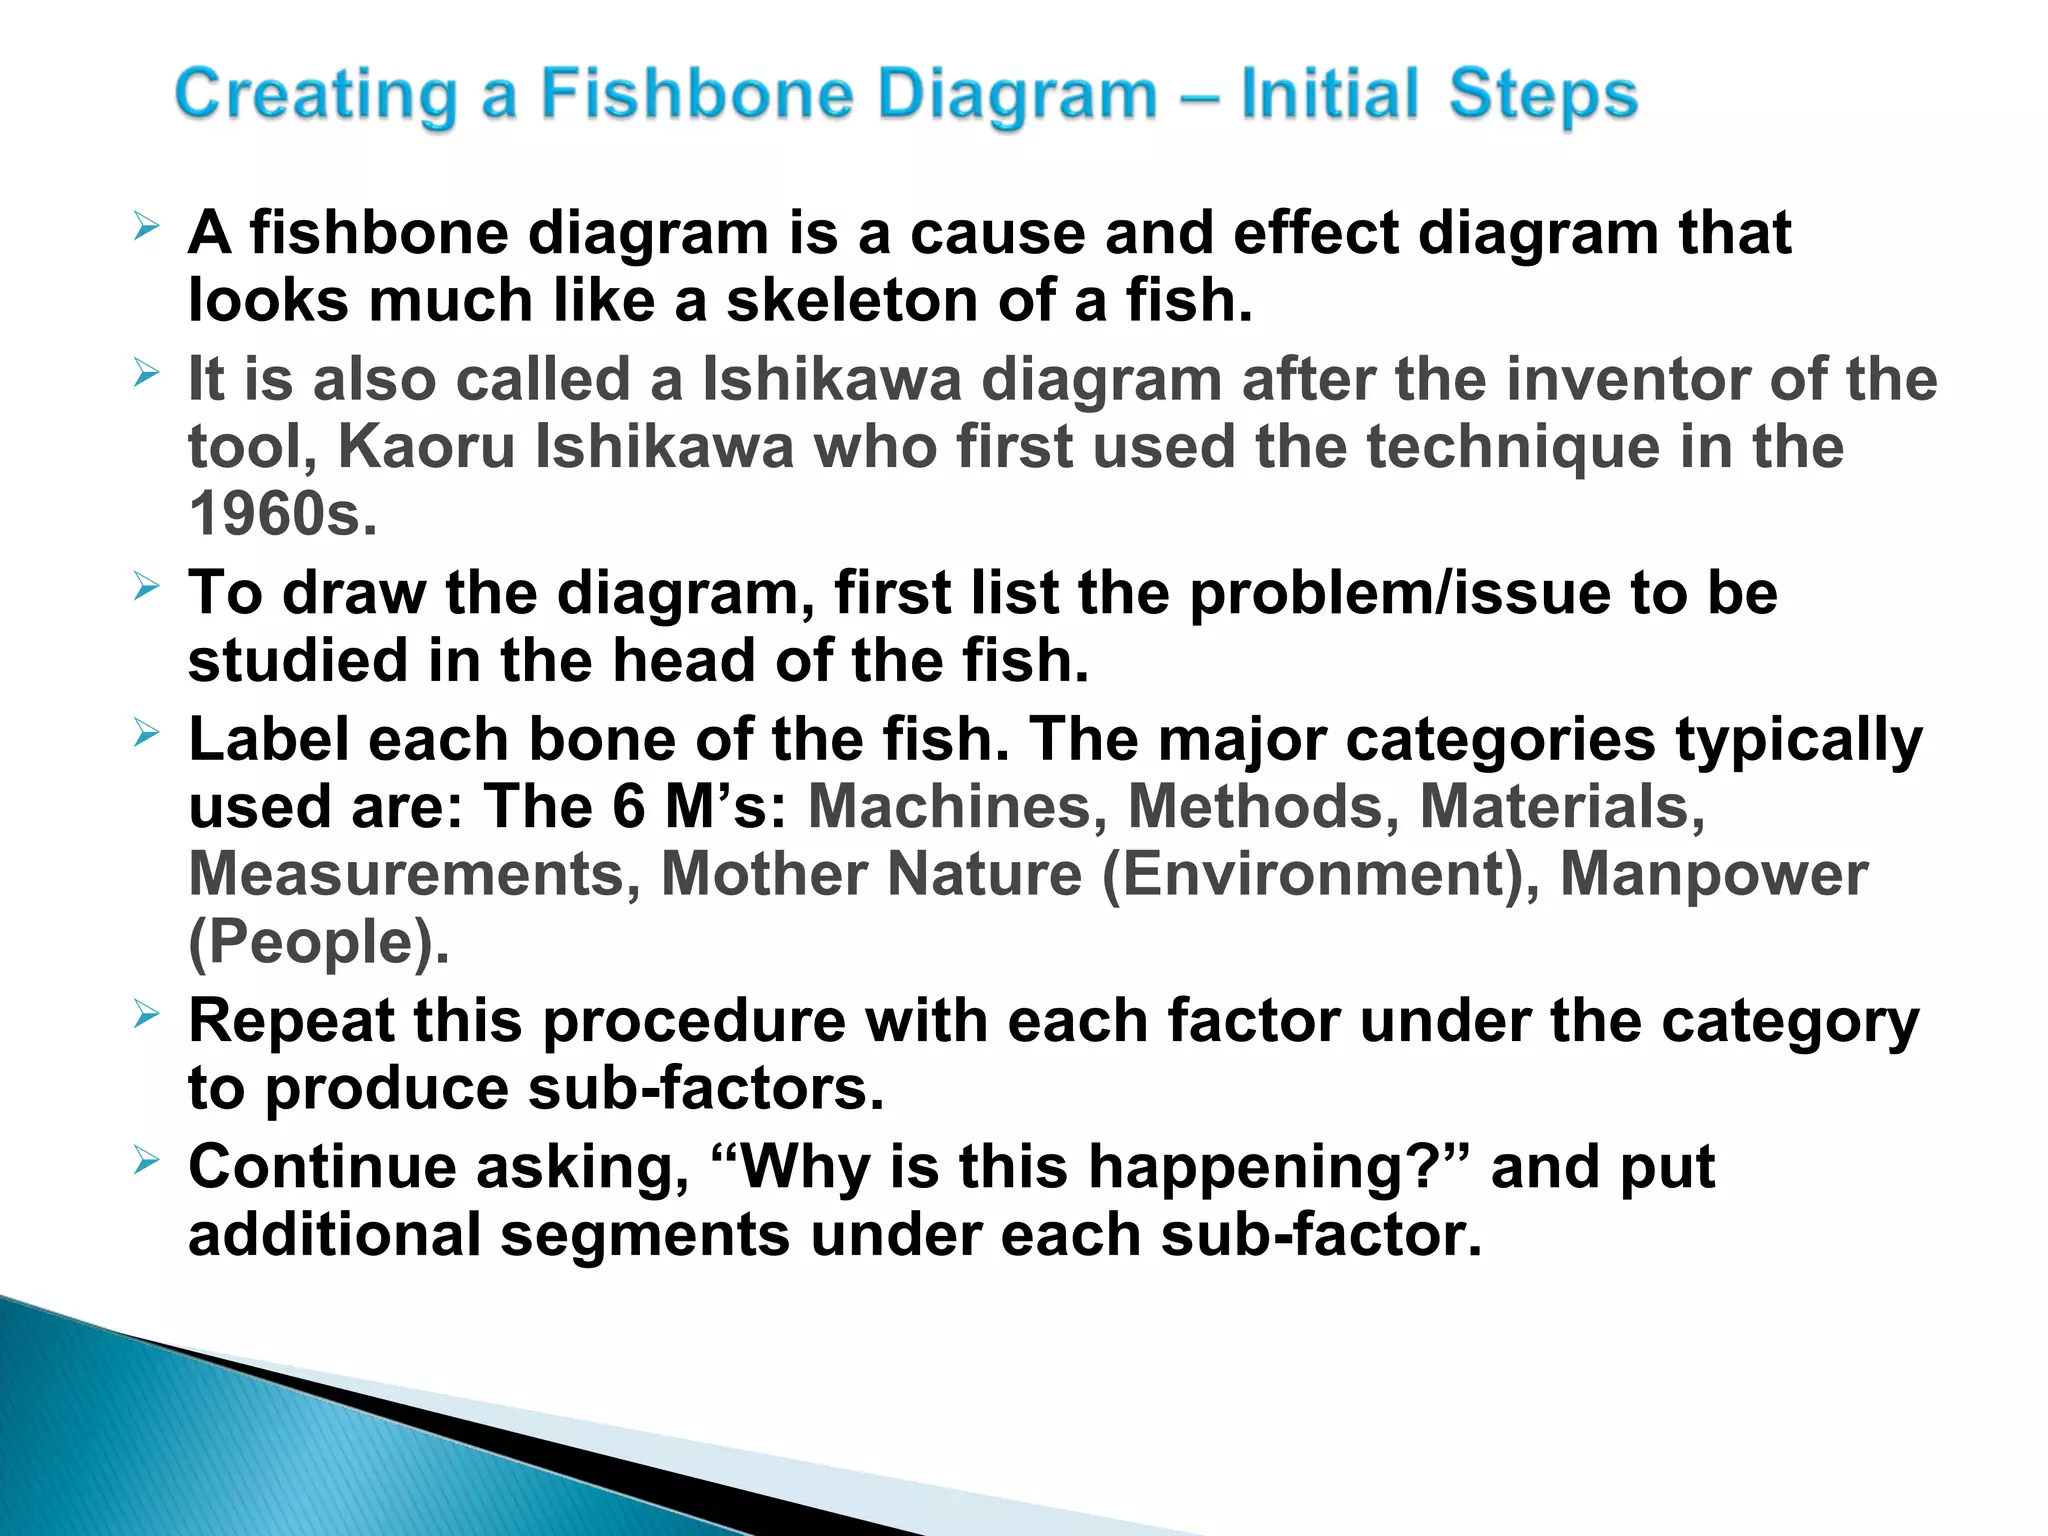


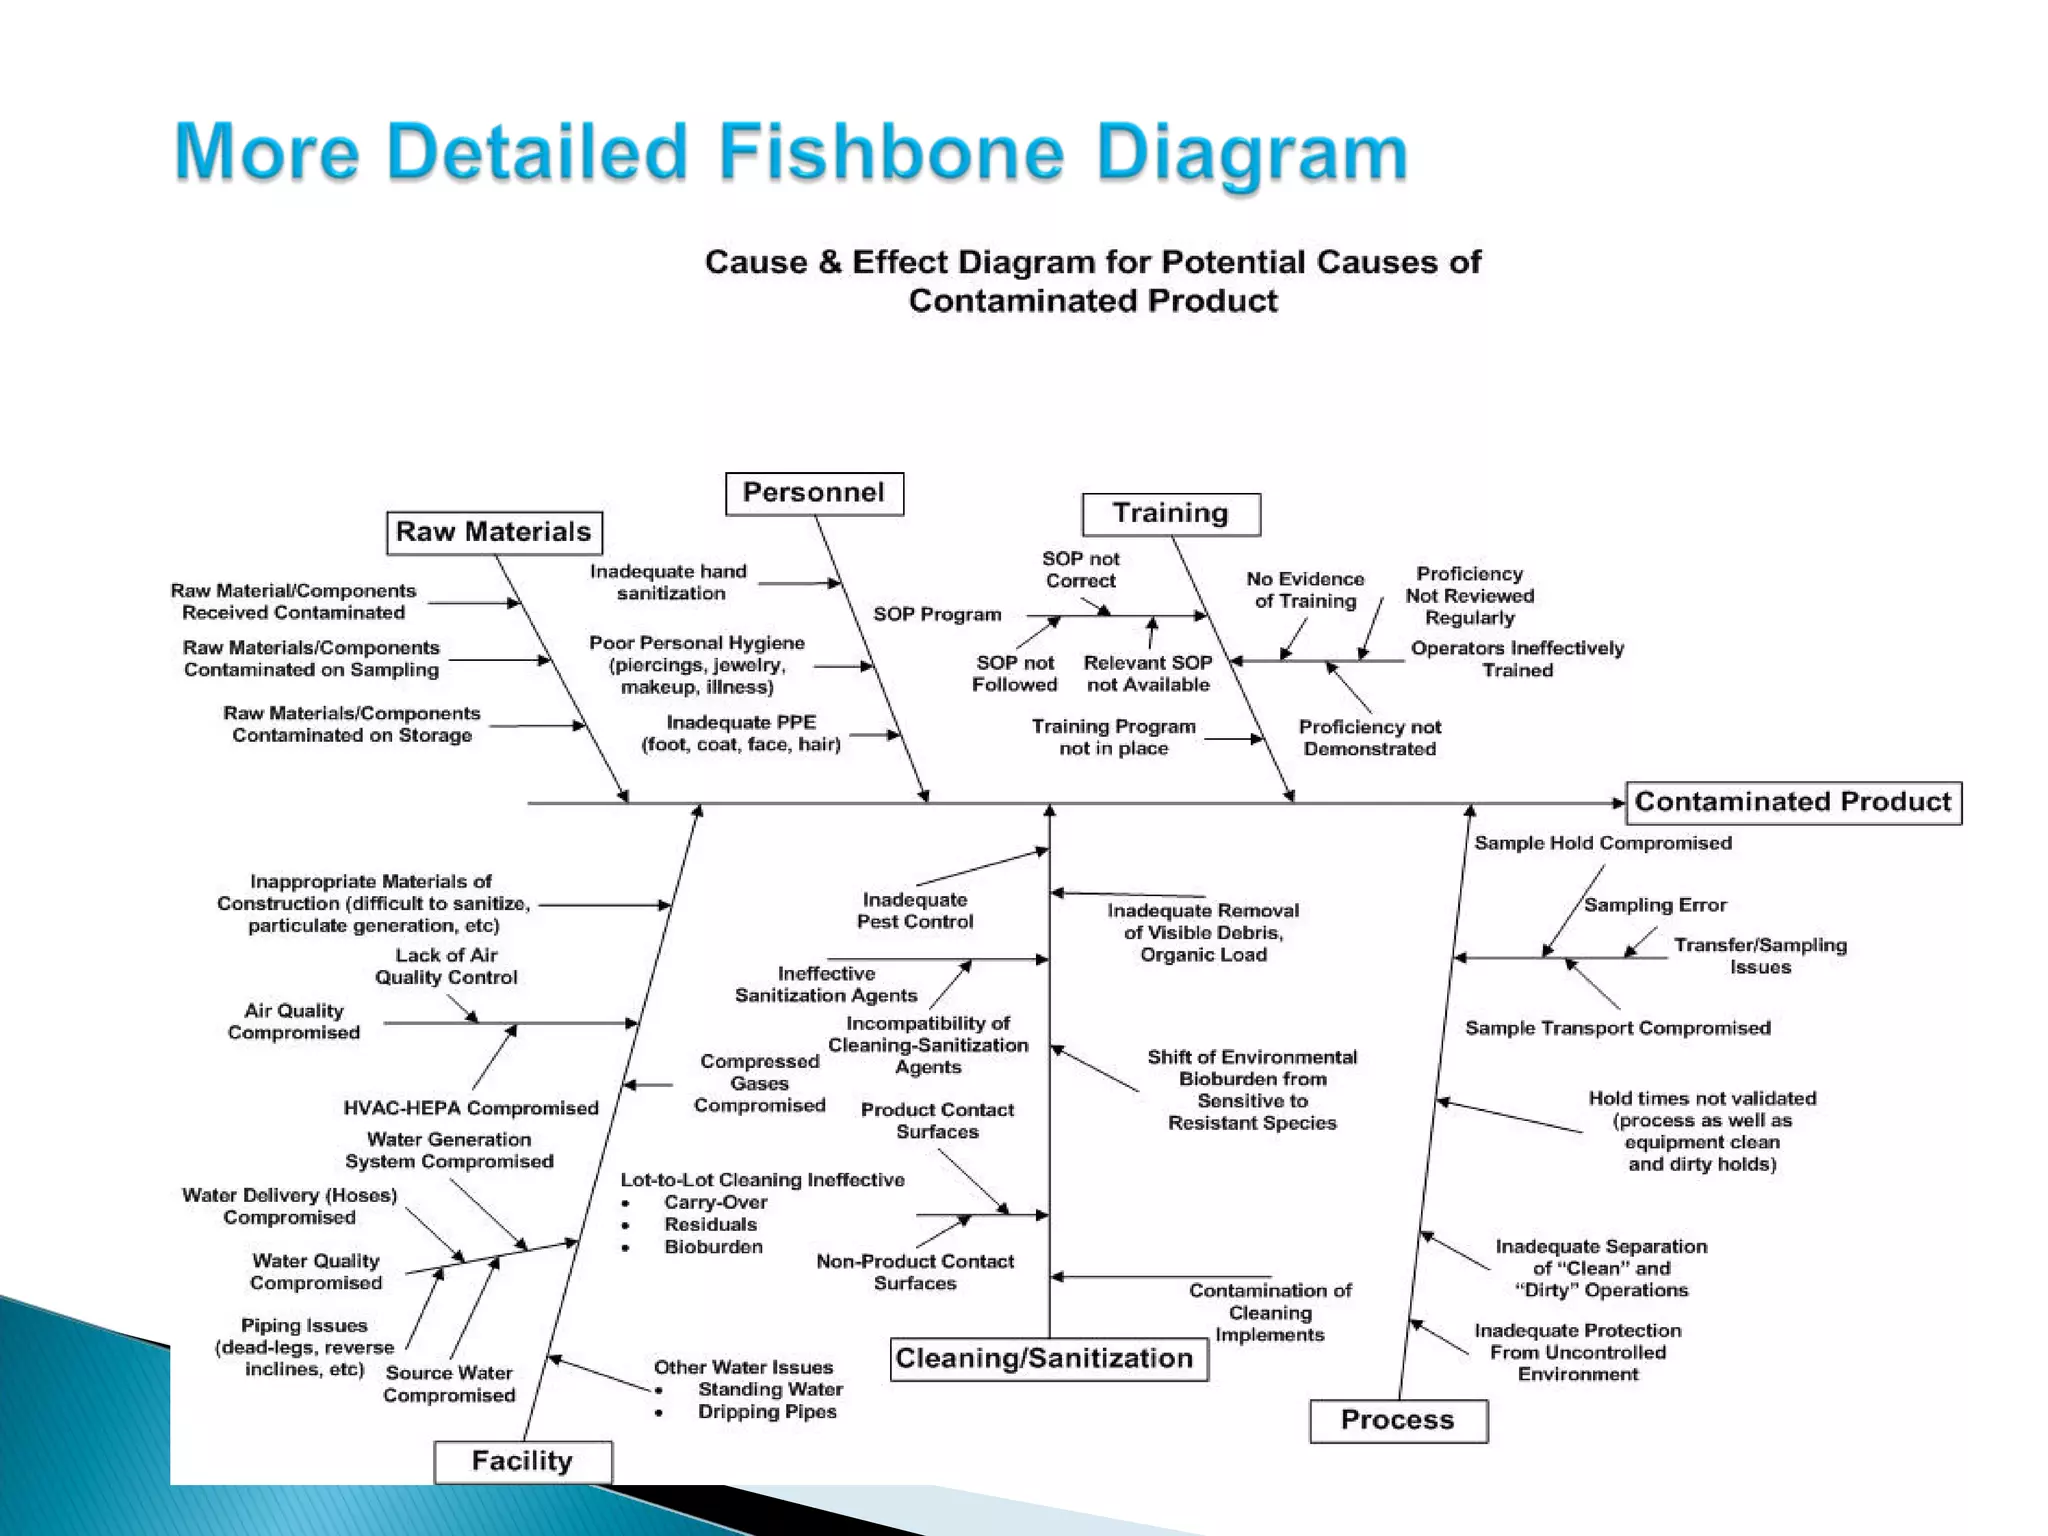

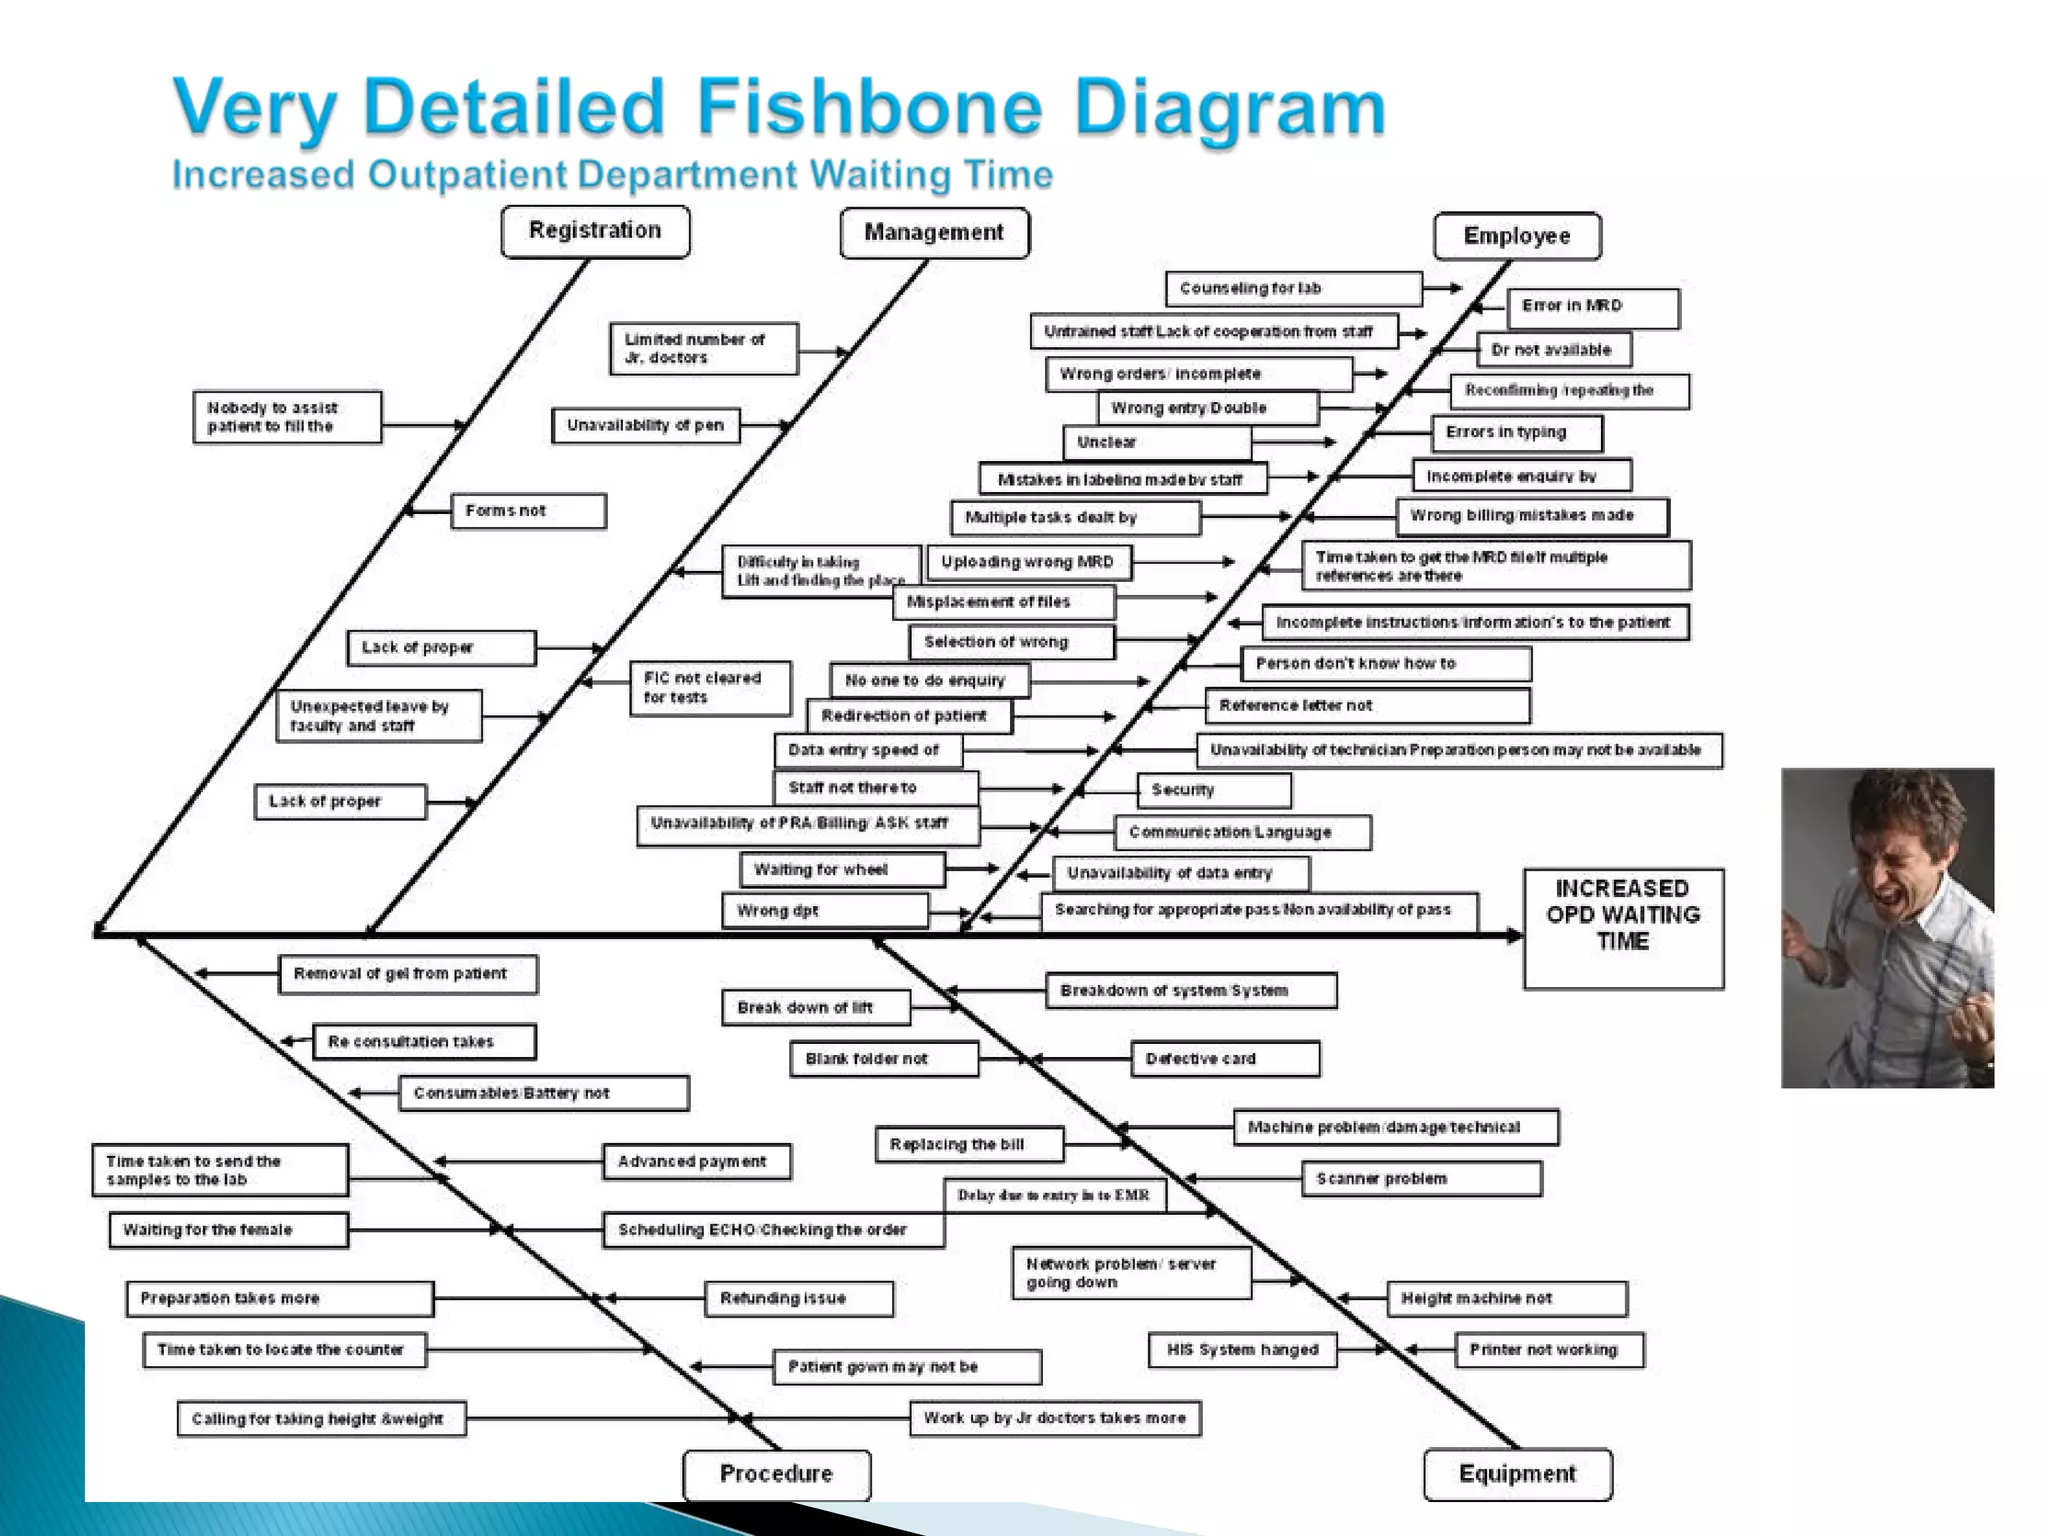


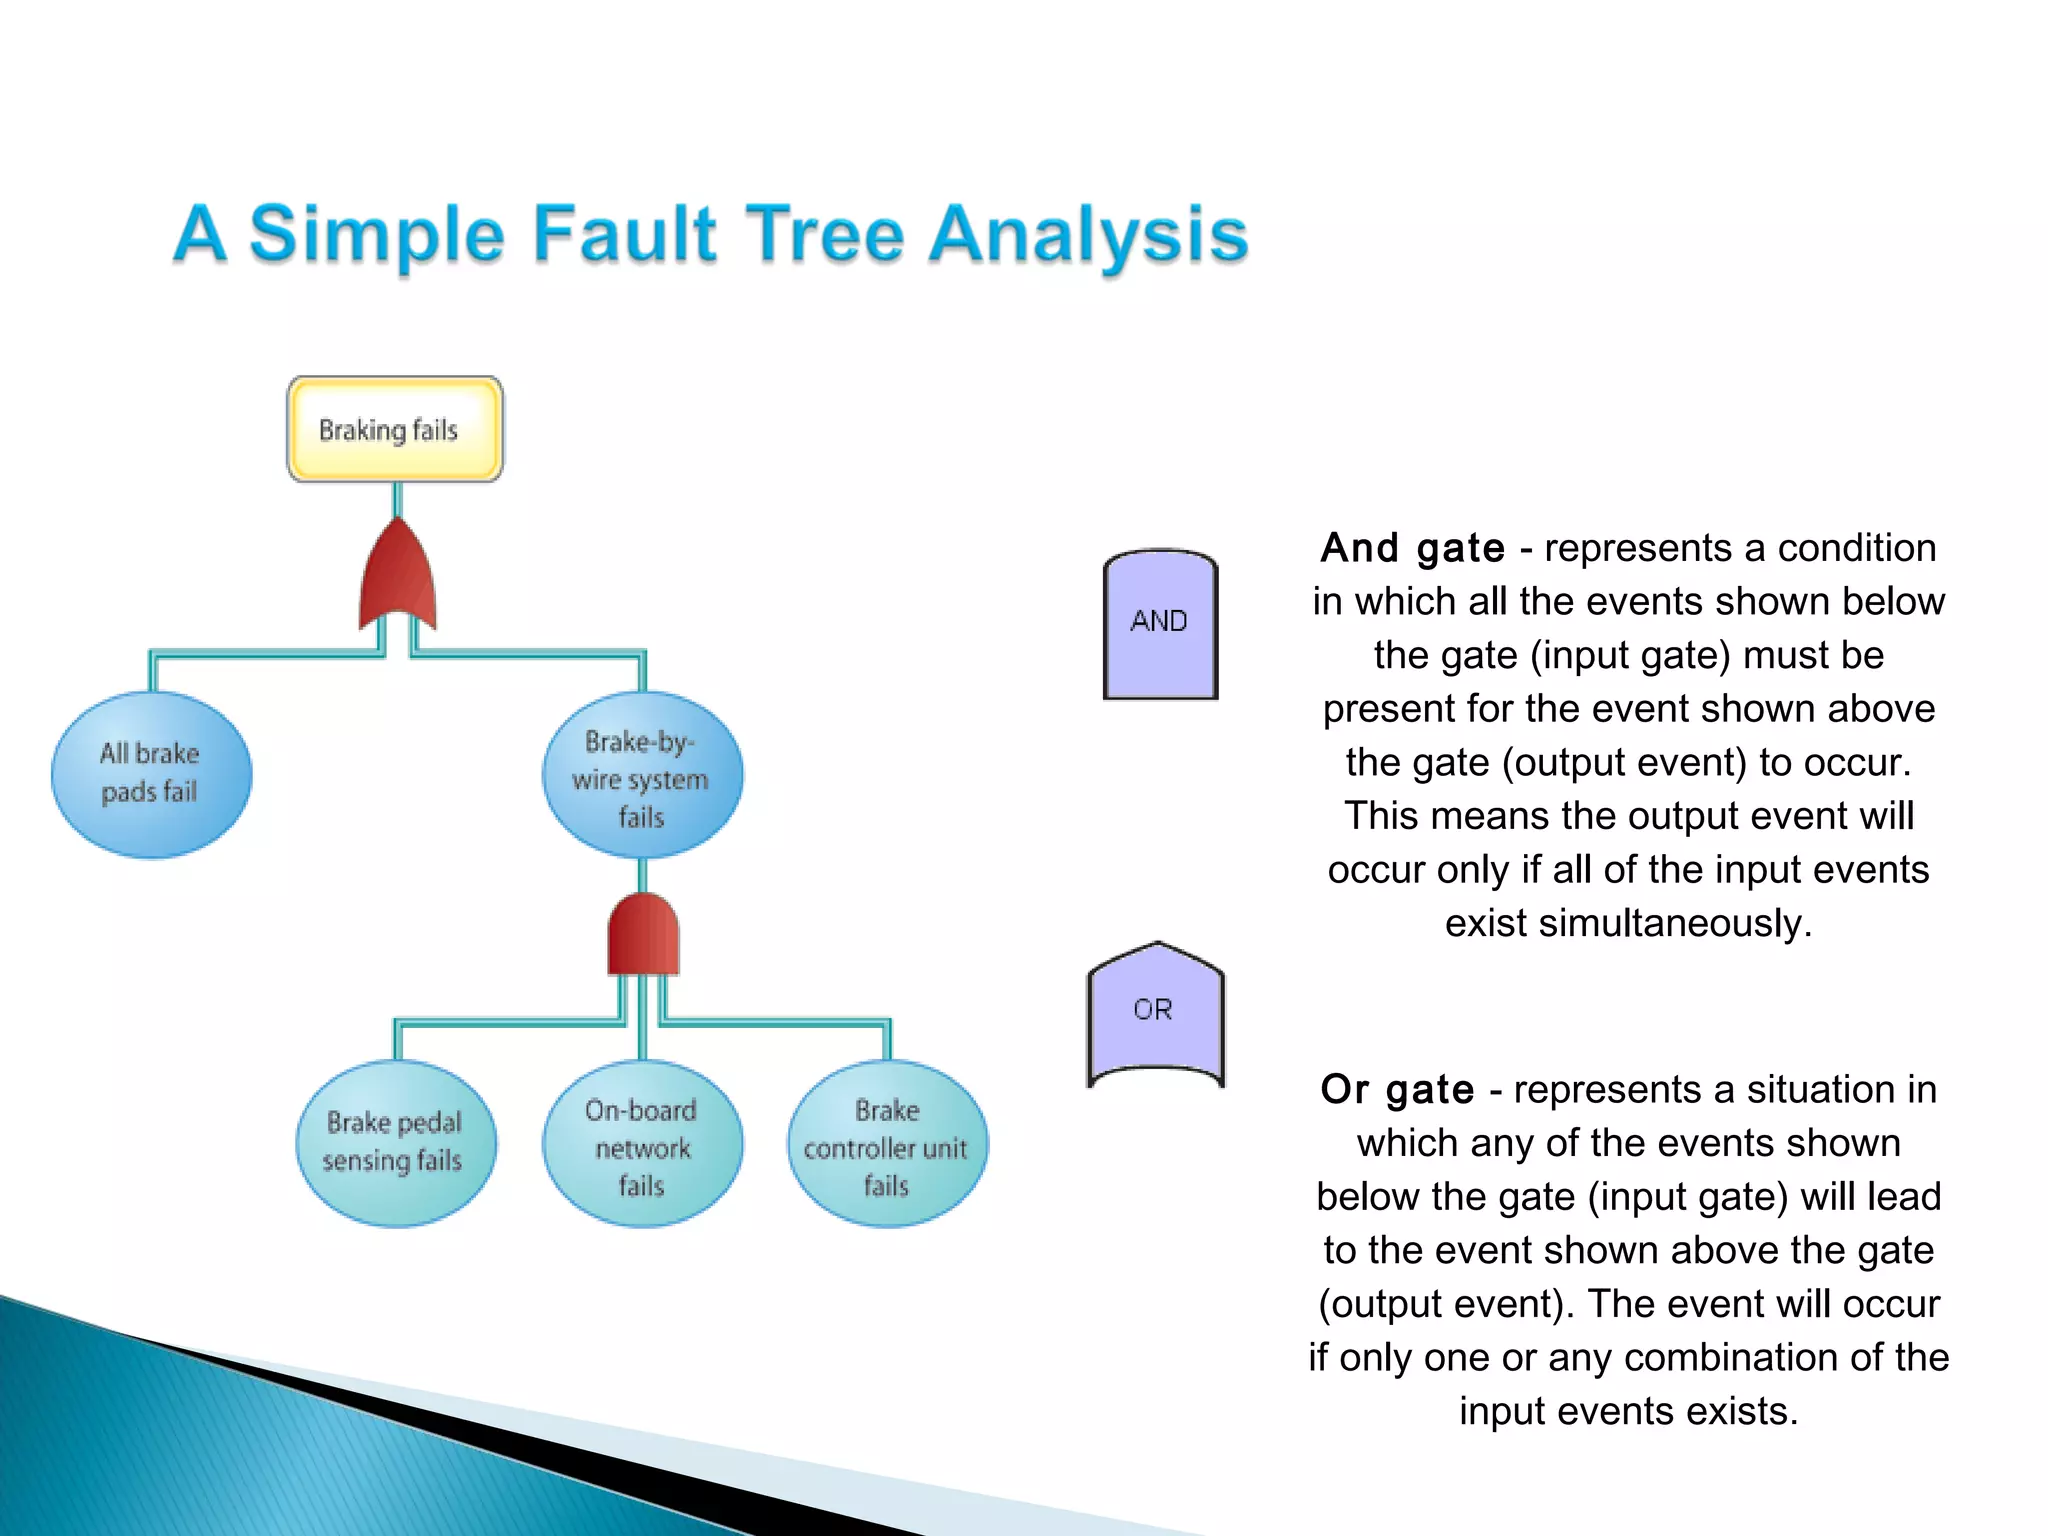


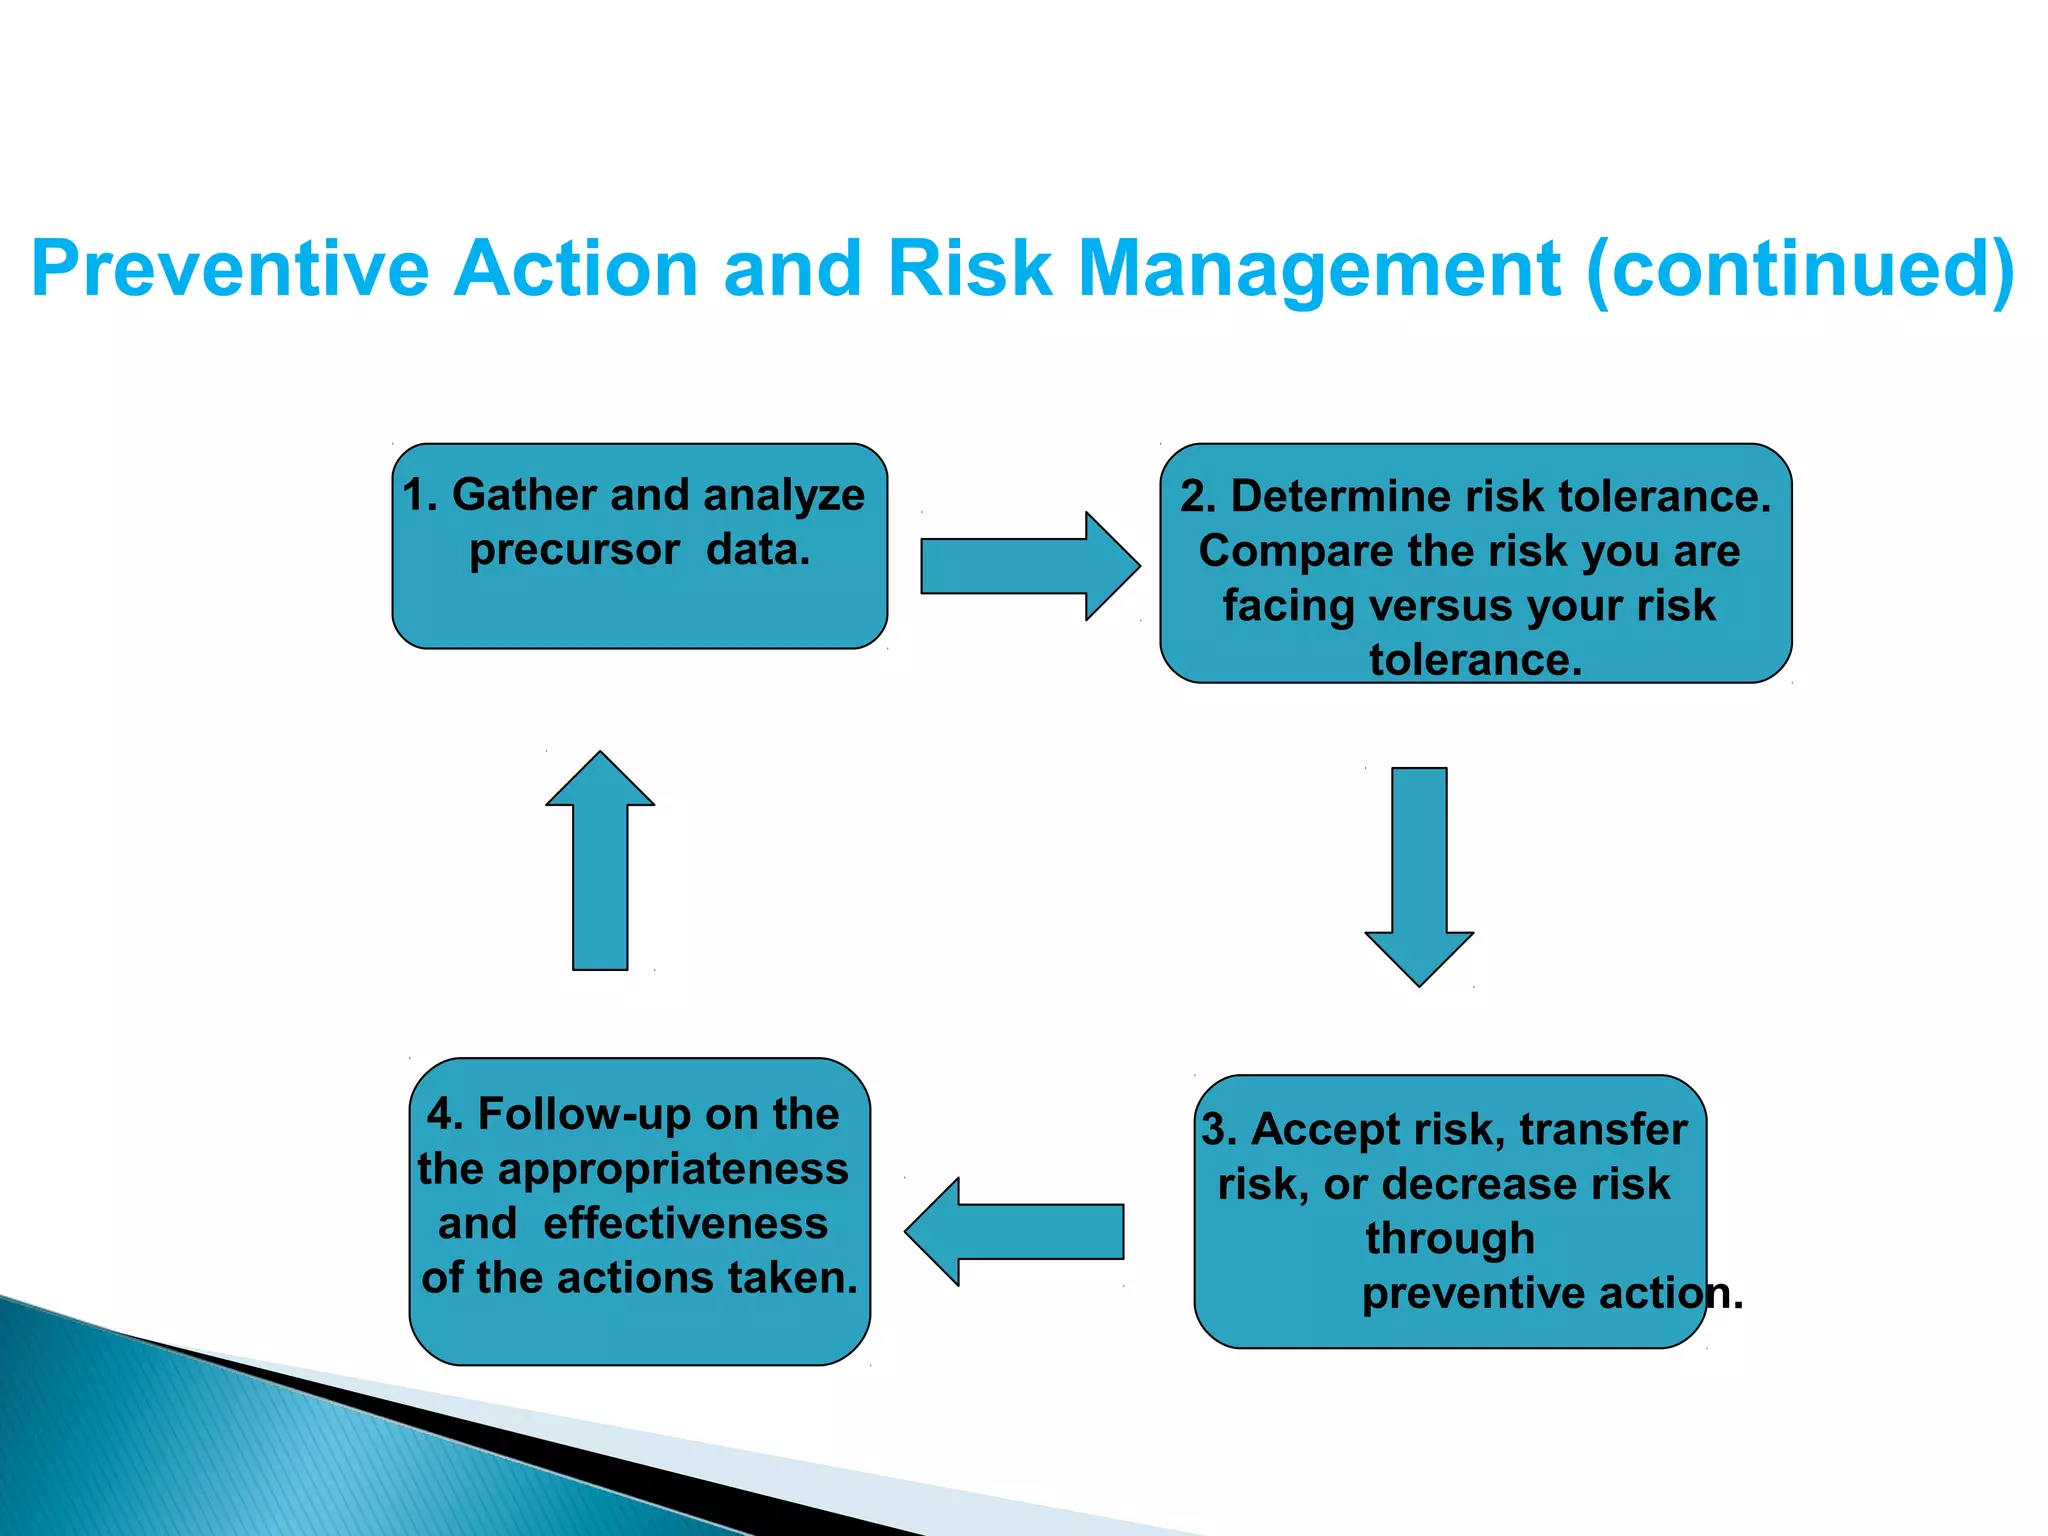
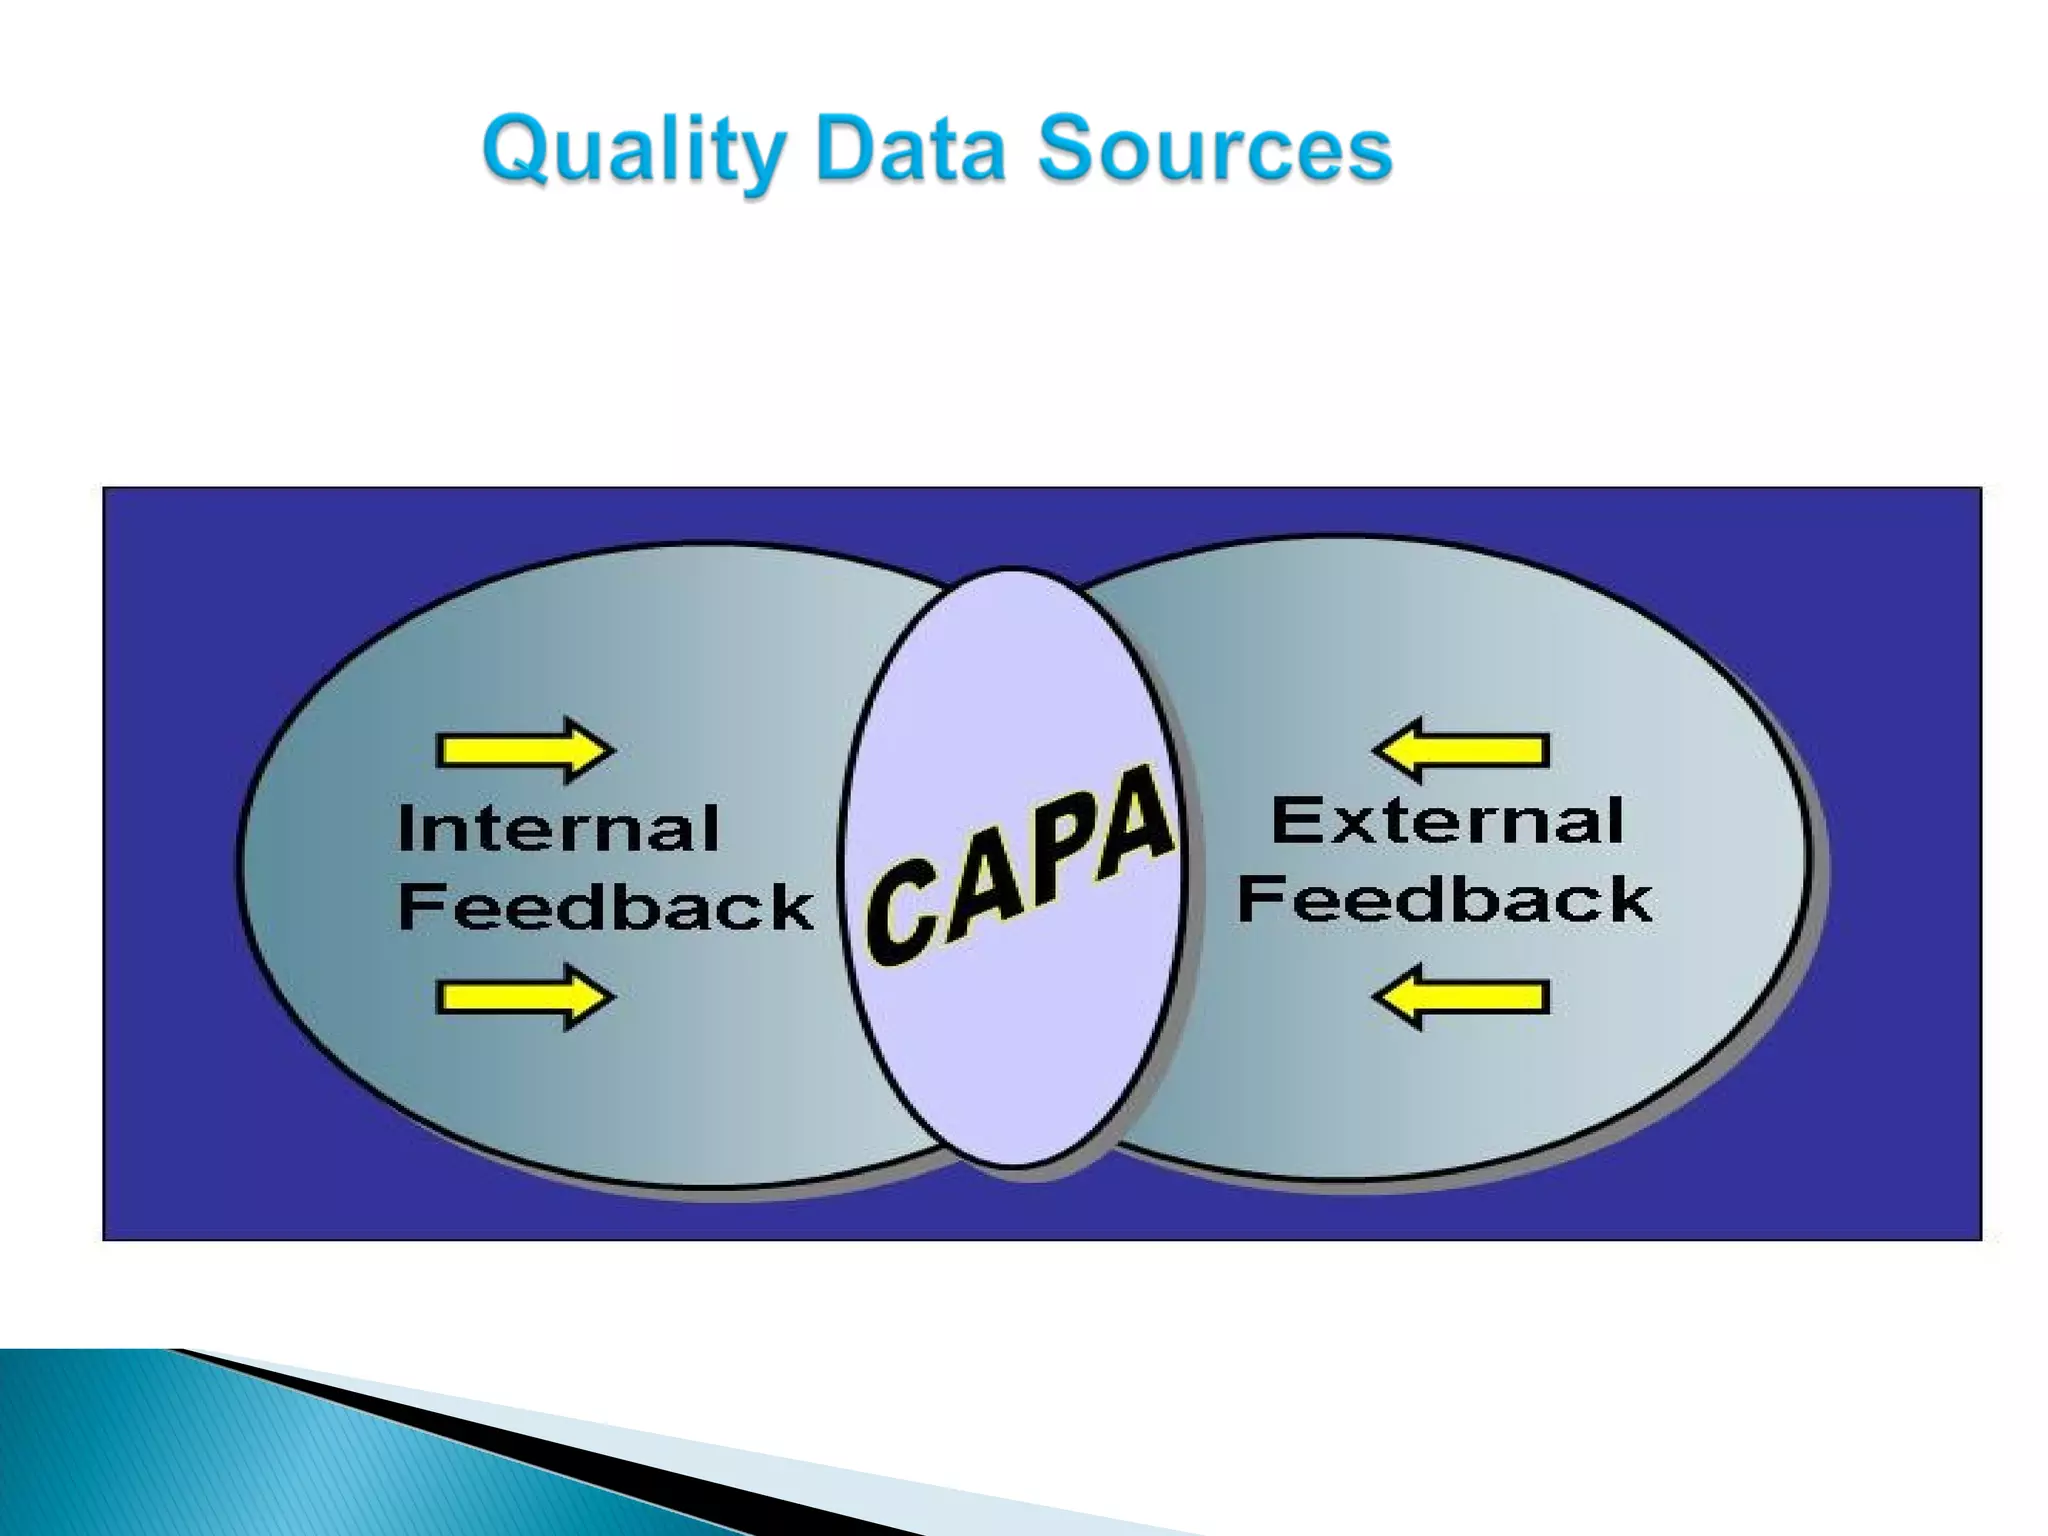


The document discusses Corrective and Preventative Action (CAPA) systems used to eliminate existing quality issues and prevent future problems. It defines key terms like nonconformity and describes the general CAPA process. Specific root cause analysis tools are also outlined, including 5 Whys, fishbone diagrams, Pareto charts, fault tree analysis, and failure mode and effects analysis. Each tool's purpose, methodology, advantages, and limitations are summarized. Finally, preventative action and risk management processes are covered.


