

Recommended
More Related Content
Viewers also liked
Viewers also liked (20)
More from Klaas Jan Mollema
More from Klaas Jan Mollema (20)
[Idm e] informatievisualisatie 2
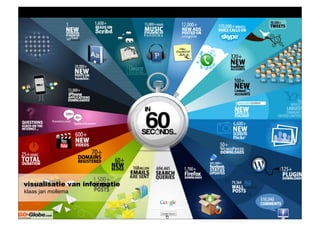
- 1. visualisatie van informatie klaas jan mollema
- 2. information is only useful when it can be understood
- 3. Een infographic of informatieve illustratie geeft een informatieve weergave bestaande uit verschillende objecten met een combinatie van tekst en beeld.
- 4. Een infographic is een informatieve illustratie een afbeelding die informatie uitbeeldt en verklaart. Een infographic is een combinatie van tekst en beeld.
- 8. landkaarten
- 9. William Playfair The commercial and political atlas (1786)
- 10. Charles Joseph Minard Napoleon’s invasion of Russia (1861)
- 11. Otto Neurath Pictogrammen, isotypes, stick figures (1936)
- 12. Otto Neurath Pictogrammen, isotypes, stick figures (1936)
- 13. Stephen Toulmin argument theory - models (1958)
- 14. Otl Aicher pictogrammenset Olympische spelen Munchen (1972)
- 15. Otl Aicher grid system pictogrammenset Olympische spelen Munchen (1972)
- 16. pioneer plaque (1972) gouden plaat met info over de herkomst van het ruimtevaartuig
- 17. nu sterke ontwikkeling van infographics oorzaken - steeds grotere en dus complexere hoeveelheid informatie - internet biedt de mogelijkheid voor verspreiding - oneindige ruimte - oneindig bereik - alle kleuren - geen kosten - animatiemogelijkheden
- 22. structuur logische volgorde voor het leesproces
- 23. opbouw waar komt welk element te staan?
- 24. vormgeving hoe spreek je de doelgroep aan?
- 26. emotie en beleving spreek aan op emoties
- 28. testen koppel de graphic terug naar de gebruiker
- 30. statisch informatie in één oogopslag duidelijk
- 33. geanimeerd informatie in een lineaire sequence gepresenteerd
- 34. interactief informatie gepresenteerd op selectie van gebruiker
- 47. bronnen • http://www.frankwatching.com/archive/ 2011/02/18/het-ontwerpen-van-een-effectieve- infographic/ • http://www.onextrapixel.com/2010/05/21/ huge-infographics-design-resources-overview- principles-tips-and-examples/ • tufte • http://vector.tutsplus.com/tutorials/designing/