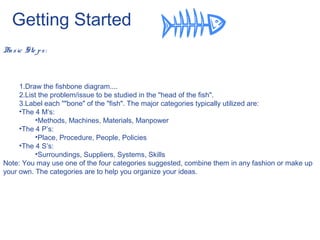
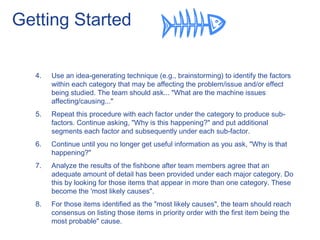
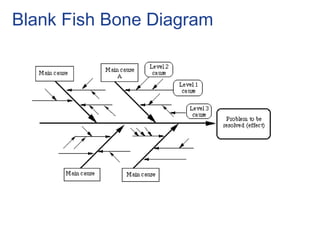
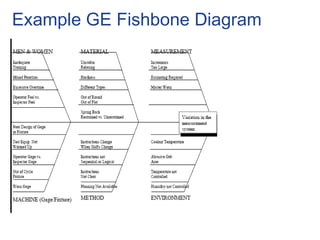
The document provides an overview of the fishbone diagram, also known as the Ishikawa diagram. It is an analysis tool that systematically looks at effects and their potential causes. The diagram is drawn with a central problem or effect and major categories of causes branching out like bones of a fish skeleton. Teams use the diagram to brainstorm and categorize all possible causes of a problem in an organized way to identify root causes. The document outlines the basic steps to construct a fishbone diagram including defining the problem, labeling categories, identifying factors and sub-factors within each category, analyzing results to find most likely causes, and prioritizing those causes.


![Fishbone[1]](https://cdn.slidesharecdn.com/ss_thumbnails/fishbone12615-thumbnail.jpg?width=640&height=640&fit=bounds)