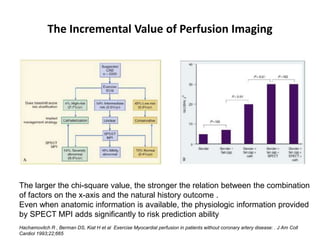
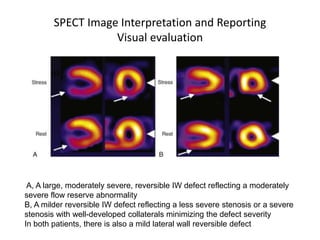
This document provides an overview of nuclear cardiology techniques used in the assessment of coronary artery disease (CAD). It discusses the history and development of nuclear medicine imaging including planar imaging and SPECT/PET. Key aspects summarized are:
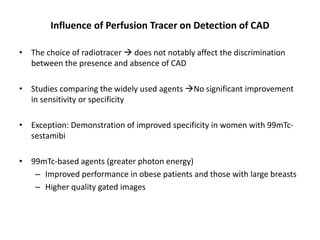
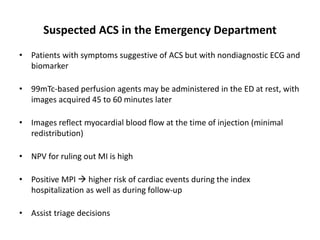
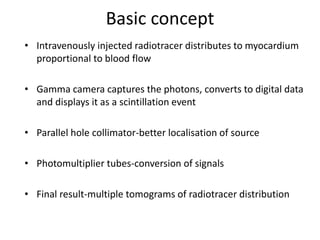
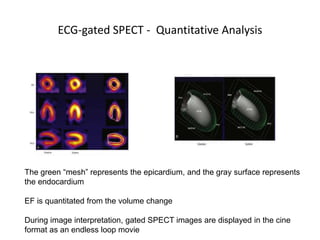
1. SPECT imaging involves injection of radiotracers like thallium-201 or technetium-99m which distribute to the myocardium proportional to blood flow. Gamma photons are detected and reconstructed to provide 3D images of radiotracer distribution.
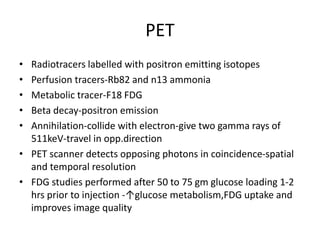
2. PET imaging uses positron-emitting radiotracers like rubidium-82 or ammonia-13 for perfusion and fluorodeoxyglucose for metabolism. It provides higher resolution functional imaging
Call Girls Colaba Mumbai ❤️ 9920874524 👈 Cash on Delivery
Nuclear cardiology
1. NUCLEAR MEDICINE IN CAD
PRESENTED BY- DR KUNAL KUMAR SINGH
DEPT OF CARDIOLOGY, SGPGI LUCKNOW
2. History
Helmann Blumgart Myron Prinzmetal
Hal Anger
injected radon to
measure circulation
time in 1927.
radiolabelled albumin
In 1948
Anger scintallating gamma
camera in 1952; beginning
of clinical nuclear
cardiology
3. History
• Liljestrand-1939-normal blood volume.
• 1976-thallium201-two dimensional planar imaging.
• 1980s-SPECT using rotating anger camera.
• 1990-technetium99m based agents and gated SPECT.
• 1990-2003-ECG gated SPECT.
• 90% of SPECT in U.S use technetium and 90% are gated SPECT.
5. Basic concept
• Intravenously injected radiotracer distributes to myocardium
proportional to blood flow
• Gamma camera captures the photons, converts to digital data
and displays it as a scintillation event
• Parallel hole collimator-better localisation of source
• Photomultiplier tubes-conversion of signals
• Final result-multiple tomograms of radiotracer distribution
9. SPECT image display
• Short axis images-perpendicular to long axis of the heart,
displayed from apex to base.
• Vertical long axis-parallel to long axis of heart and parallel to
long axis of body.
• Horizontal long axis-parallel to long axis of heart,
perpendicular to VLA slice.
15. Thallium-201
• Monovalent cation, property similar to potassium.
• Half life 73 hours, emits 80keV photons, t½ 73hrs,85% first
pass extraction.
• Peak myocardial concentration in 5 min, rapid clearance from
intravascular compartment.
• Redistribution of thallium-begins 10-15 mins after, related to
conc. gradient of thallium between myocyte and blood.
• Differential washout-clearance is more rapid from normal
myocardium
• Hyperinsulinemic states reduce blood conc.&slow
redistribution.so fasting recommended
16.
17. Technetium-99m labelled tracers
• Half life 6 hrs,140keV photons,60% extraction
• Uptake by passive distribution by gradient
• Minimal redistribution-require two separate injections-one at
peak stress and one at rest
• Single day study-first injected dose is low
• Two day study-higher doses injected both rest and stress-
optimise myocardial count rate-larger body habitus
• Tc99m tracers bound by mitochondria.limiyed washout
occurs.so imaging can commence later and can be repeated
18. Stress protocols
• Patient should be NPO for 4-6 hrs
• When feasible antiischaemic drugs to be
withold(b blockers and long acting calcium
channel blockers -48 hrs prior,nitrates at east
12 hrs)
• Caffeine and theophylline to be avoided (at
least 12 hrs before test)
23. Imaging Protocols
• Thallium protocols-
Stress protocols-injected at peak stress and images taken
at peak stress and at 4 hrs,24hrs
Reversal of a thallium defect is a marker of reversible
ischemia
Rest protocols- thallium defect reversibility from initial
rest images to delayed redistribution images reflect viable
myocardium with resting hypoperfusion
Initial defect persists-irreversible defect
25. Imaging Protocols
• Technitium protocol-
Most common-same day low dose rest/high dose stress-
disadvantage is reduction in stress defect contrast.
Viability assessment improved by NTG prior to rest study
2 day imaging protocols are performed in patients with
large body habitus( where higher doses are required)
26. Imaging Protocols
• Dual isotope protocol-
Anger camera can collect image in different energy
windows
Thallium at rest followed by Tc 99m tracer at peak stress
If there is rest perfusion defect,redistribution imaging
taken either 4 hrs prior or 24hrs after Tc99m injection
27.
28.
29. General Principles of Interpretation and Reporting
The key elements to be reported
• Perfusion defects - presence and location
• Reversibility (stress induced ischemia)
• Irreversible or fixed (MI)
• The extent of perfusion abnormality
• Severity
• Extent and severity
– Independent risk factors
– Risk stratification
• It is not sufficient to describe a stress perfusion imaging test as simply
“abnormal”
30. SPECT Image Interpretation and Reporting
Visual evaluation
A, A large, moderately severe, reversible IW defect reflecting a moderately
severe flow reserve abnormality
B, A milder reversible IW defect reflecting a less severe stenosis or a severe
stenosis with well-developed collaterals minimizing the defect severity
In both patients, there is also a mild lateral wall reversible defect
31. Single vascular territory reversible defects
A, A reversible IW defect consistent with inducible ischemia in the RCA territory
B, A reversible lateral wall defect consistent with inducible ischemia in the LCX territory
C, A reversible anterior wall defect consistent with inducible ischemia in the LAD
territory
32. Reversible defects in more than one vascular territory
A, Inducible ischemia in LCX and RCA territories
B, Inducible ischemia in LCX and LAD territories
33. Advantages and Disadvantages of Visual Analysis
Accuracy of visual analysis
• Experience and training of the reader
• Quality of the imaging study
Advantage
• Incorporate information from the raw data (e.g., Breast or an elevated
diaphragm attenuating the inferior wall)
• Adjust threshold for interpreting an abnormality
Disadvantage
• Inherently subjective
• Intraobserver and interobserver variability
34. Semiquantitative visual analysis
• A standardised segmentation model
– Myocardium is divided into 17 segments
– On the basis of 3 short-axis slices and a representative long-axis slice
to depict the apex
• Perfusion is graded within each segment on a scale of 0 to 4
• 0-normal uptake
• 1-mildly reduced uptake
• 2-moderately reduced uptake
• 3-severely reduced uptake and
• 4-no uptake
35. Semiquantitative visual analysis
• The segmental scores are assigned
• Subjectively by the image interpreter or
• Automatically by software programs
• Myocardium divided into 17 segments on the basis of 3 short axis and
a long axis slice
36. Standard segmental myocardial display for semiquantitative visual analysis in
a 17-segment model
Segmental scoring: severe apical fixed defect extending into the inferoapical and
anteroapical walls with evidence of reversible defects in the inferior and lateral walls.
SSS = 23; SRS = 15; SDS = SSS − SRS = 8 represents the extent of ischemia
37.
38. Quantitative analysis of SPECT imaging
Circumferential profile of relative tracer activity
• The most common technique employed
• Around the tomogram of interest, such as a short-axis tomogram
• Each short-axis tomogram is sampled at every 3-6o for 360o, along a ray
extending from the center of the image
39. Quantitative analysis of SPECT imaging
• The maximum pixel (midportion of the myocardium) are recorded for each
angle
• The data may be plotted to create a profile of the perfusion pattern relative
to the most “normal” area of uptake (assigned a value of 100% uptake)
40. Quantitative analysis of SPECT imaging
Quantitative extent of abnormality
• Total amount of myocardium that falls below the lower limit of normal
Severity of the perfusion abnormality
• Depth of the patient's perfusion abnormality relative to the lower limit of
normal
Lower limit of
normal
41. Bull's-eye polar plot
• Data from all of the individual short-axis tomograms can be combined
• 2D compilation of all of the 3D short-axis perfusion data
42. Automated quantitative analysis software
Selected short- and long-
axis
tomograms from stress and
rest studies are
automatically segmented
and scored
BULL’s EYE
PLOTS
3D
Extent of ischemic myocardium (white
area) measures 23% of the total
myocardium
43. Advantages and Disadvantages of Quantitative Analysis
Advantages
• Little or no human interaction
• Highly reproducible
• Accounts for potential artifacts such as breast or diaphragm attenuation
• More objectivity and reproduciblility Interrogate the effect of therapies
on serial changes in myocardial perfusion
Disadvantages
• Artifacts that are not accounted for by the normal data comparison
(motion or other suboptimal quality issues may be called abnormal by
quantitation)
In practice : Final conclusion is arrived by visual analysis incorporating the
quantitative data
44.
45. Additional signs
• Lung uptake of thallium
• Transient ischemic dilatation of left ventricle
46. Lung Uptake
• In some patients, substantial tracer uptake is apparent throughout the
lung fields after stress that is not present at rest
– Often have severe multivessel disease
– Elevation of PCWP during exercise
– Decreases in EF during exercise
• Mechanism:
– Ischemia-induced elevation in LA and pulmonary pressures slows
pulmonary transit of the tracer more time for extraction or
transudation into the interstitial spaces of the lung
47. TID: transit Ischemic Dilation
(Stress induced LV Cavity Dilation)
• Severe, extensive CAD (usually with classic ischemic defect)
Left Main
Prox LAD
MVD
Diffuse subendocardial ischemia
TID depends on stress type and protocol used
Exercise stress ULN (upper limit of normal) is 1.19 for same day
protocol and 1.21 for dual isotope imaging.
Vasodilator stress testing ULN is 1.19 for same day protocol and 1.36
for dual isotope imaging.
48. NORMAL VARIATIONS IN SPECT
• Dropout of the upper septum
• Apical thinning
• Lateral wall may appear brighter than septum
• Minimised by review of series of normal
volunteers
49.
50. Technical artifacts
• Breast attenuation-
– Minimised by Tc99m agents,ECG gated SPECT
– Presence of preserved wall motion and thickening
• Inferior wall attenuation
– Diaphragm overlapping inferior wall
– Minimised by gated SPECT, prone position
• Extracardiac tracer uptake
– Repeat imaging, drink cold water to clear tracer from
visceral organs
52. Technical artifacts
• LBBB-
– isolated reversible perfusion defects of septum
– Heterogeneity of flow b/w LAD & LCx due to delayed
septal relaxation
– Reduced O2 demand due to late septal contraction, when
wall stress is less
• HCM-
– due to ASH, appearance of lateral perfusion defect
53. ECG-gated SPECT
• Simultaneous assessment of LV function and perfusion
• Involves creation of one cardiac cycle for analysis that represents an
average of several hundred beats
– counts recorded during any individual cardiac cycle is insufficient
• Images acquired during a period of 8 to 15 minutes
• Frames are redisplayed sequentially in a cine or movie format
• Beat-length windowing
• High-quality ECG-gated images
54. Basis for the technique of ECG gating
1 – end diastolic
4 – end systolic
Wall thickening and brightening are seen across the course of systole
55. ECG-gated SPECT image interpretation
Visual assessment of regional myocardial function
• Normally brightening - normal regional systolic performance
• Diminished but apparent brightening – hypokinetic
• Slight brightening - severely hypokinetic
• No apparent brightening - akinetic
56. ECG-gated SPECT - Quantitative Analysis
• Computer-based methodology with software capable of quantitative
analysis
• Fully automated and highly reproducible
• Automated interrogation of the apparent epicardial and endocardial borders
of all of the tomograms in all three orthogonal planes
• These multiple 2D contours are then reconstructed to create a surface-
rendered 3D display
• Can be viewed from any direction by simple maneuvering
• Automated calculation of EF and LV volumes
57. ECG-gated SPECT - Quantitative Analysis
The green “mesh” represents the epicardium, and the gray surface represents
the endocardium
EF is quantitated from the volume change
During image interpretation, gated SPECT images are displayed in the cine
format as an endless loop movie
58. • Combined SPECT/CT or PET/CT scanners-complementary
anatomical and functional information
59. PET
• Radiotracers labelled with positron emitting isotopes
• Perfusion tracers-Rb82 and n13 ammonia
• Metabolic tracer-F18 FDG
• Beta decay-positron emission
• Annihilation-collide with electron-give two gamma rays of
511keV-travel in opp.direction
• PET scanner detects opposing photons in coincidence-spatial
and temporal resolution
• FDG studies performed after 50 to 75 gm glucose loading 1-2
hrs prior to injection -↑glucose metabolism,FDG uptake and
improves image quality
62. PET - Image Analysis
Differentiation of normal, stunned, hibernating and necrotic myocardium
• Hibernating myocardium
– Presence of enhanced FDG uptake in regions of decreased blood flow
("PET mismatch")
• Necrotic myocardium
– Concordant reduction in both metabolism and flow ("PET match")
• Stunning
– Regional dysfunction in presence of normal perfusion
63. Clinical Application of PET Perfusion Imaging
• Segments with reductions in both blood flow and FDG uptake
– Only a 20% chance of functional improvement following
revascularization
• Hibernating segments
– 80 to 85% chance of functional improvement following
revascularization
• The PPV and NPV for improvement in wall motion score after
revascularization is 96%
• Extent of myocardium with enhanced FDG uptake predicts the magnitude
of improvement in EF, exercise tolerance and HF symptoms
65. Advantages of PET over SPECT
• Higher spatial resolution
• Improved attenuation and scatter correction
• Quantification regional blood flow
– SPECT may fail to detect balanced ischemia in multivessel CAD
– ↓blood flow reserve by PET –early identification of CAD
• Sensitivity and specificity (95%) for detection of CAD
– "probably normal" or abnormal studies by SPECT versus PET
• Quantification of myocardial blood flow in absolute terms
– “balanced” ischemia may not be detected by SPECT
66. Limitations
• Requirement of an on-site cyclotron for [13N]ammonia
• High cost of monthly generator replacement for 82Rb
• Relatively short half-lives of both 82Rb and [13N]ammonia limit the utility
of PET to patients undergoing pharmacologic stress only
67. PET with 13N-ammonia and 18F-FDG to assess
myocardial viability . Regional myocardial 18F-FDG uptake is disproportionately
enhanced compared with regional myocardial blood flow; this pattern is termed
perfusion–metabolism mismatch and is indicative of hibernating myocardium
68. Metabolic tracers
• C-11 palmitate
• I-123 BMIPP-Ischemic memory-fatty acid metabolism
suppressed for longer time after an ischemic event
69.
70.
71. Comparison with non-nuclear techniques
• Dobutamine echocardiography is an established technique for viability
detection
Relative predictive value of the different forms of radionuclide MPI and
of dobutamine echocardiography
• Meta-analysis : 52 studies; 1367 patients with ischemic LV dysfunction
• For each technique, NPV > PPV
• NPV: Highest with FDG-PET, reinjection thallium SPECT and dobutamine
echocardiography
• PPV : Highest with dobutamine echocardiography and lowest with
reinjection thallium SPECT
Bax JJ et al. Sensitivity, specificity, and predictive accuracies of various noninvasive techniques
for detecting hibernating myocardium. Curr Probl Cardiol 2001
73. Assessment of myocardial viability by nuclear imaging in CAD
Why viability assessment?
• CAD is the major cause of HF
• Severe LV dysfunction – not an irreversible condition
• Hibernation and stunning are potentially reversible
• Viable myocardium can be demonstrated in 20-40% of patients with CAD
and LV dysfunction, even in the absence of angina
Allman KC et al. Myocardial viability testing and impact of revascularization on
prognosis in patients with coronary artery disease and left ventricular dysfunction: a
meta-analysis. J Am Coll Cardiol 2002
74. Assessment of myocardial viability by nuclear imaging in CAD
Group A - > 7 viable segments
Group B - ≤ 7 viable segments
The outcome depends not only on the presence, but also the extent of
viability
75. Risk Stratification in Stable Chest Pain Syndromes
The Relation Between the Extent of Perfusion Defect and Cardiac
Event Rate (risk of death or mi)
76. The Incremental Value of Perfusion Imaging
The larger the chi-square value, the stronger the relation between the combination
of factors on the x-axis and the natural history outcome .
Even when anatomic information is available, the physiologic information provided
by SPECT MPI adds significantly to risk prediction ability
Hachamovitch R , Berman DS, Kiat H et al Exercise Myocardial perfusion in patients without coronary artery disease: . J Am Coll
Cardiol 1993;22;665
77. Identification of Treatment Benefit After Risk Stratification
• Stress MPI in >10,000 patients with suspected CAD
• The extent of ischemic myocardium predicted reduction in the risk of
death with revascularization
• Just over 10% of ischemic myocardium
• As the percentage of ischemic myocardium increased, the magnitude of
benefit of revascularization increased as well (Currently being tested in
ISCHEMIA Trial)
78. Prognostic Value of Normal MPI
• Studies Benign outcome associated with a normal stress MPI study
• ACC/AHA/ASNC Radionuclide Imaging Guidelines
– Data of 21,000 patients with normal stress SPECT MPI study
– The hard event rate is 0.7% / yr (follow-up of 2 yrs - “warranty period”)
• Baseline high risk factors (e.g., DM) slightly higher risk after a normal
stress MPI study (consistent with Bayes’ theorem)
• Angiographic CAD with a stable symptom complex
– Low-risk outcome (~0.9% / yr) with a normal stress MPI
– The mechanism: ? Preserved endothelial function despite CAD
allowing appropriate flow-mediated vasodilation during stress
reducing impact of angiographic stenosis.
79. Influence of Perfusion Tracer on Detection of CAD
• The choice of radiotracer does not notably affect the discrimination
between the presence and absence of CAD
• Studies comparing the widely used agents No significant improvement
in sensitivity or specificity
• Exception: Demonstration of improved specificity in women with 99mTc-
sestamibi
• 99mTc-based agents (greater photon energy)
– Improved performance in obese patients and those with large breasts
– Higher quality gated images
80. Pharmacologic Stress Testing for Detection of CAD
• Vasodilator stress (more powerful hyperemic stress response)
– No improved sensitivity to detect CAD
– Because of the “roll-off” property of the common perfusion tracers
(diffusion limitation at high flow levels)
• 2003 ACC/AHA/ASNC Radionuclide Imaging Guidelines
– Pooled analysis of 2465 catheterized patients in 17 studies
– Sensitivity of 89% and specificity of 75% (similar to exercise SPECT MPI)
• Dobutamine stress imaging
– Diagnostic ability : Similar to other pharmacologic and exercise stress
– Recommended only when other agents are contraindicated
• Maximal coronary flow reserve is not achieved often
• Substantial side effects
81. Effect of Submaximal Exercise Performance on CAD
Detection
• In exercise ECG testing, sensitivity falls significantly if >85% of maximum
predicted HR for age is not achieved
• Perfusion heterogeneity usually develops at a lower degree of supply-
demand mismatch than ECG changes
– Sensitivity of MPI is maintained at somewhat lower workloads
• No difference in sensitivity between the maximal and the submaximal
tests
• The extent and severity of reversible perfusion defects are diminished at
submaximal workloads, which may affect the prognostic value of the test
82. Detecting and Defining the Extent of CAD
• To formulate a management strategy Extent of disease >> presence or
absence of disease
• SPECT MPI is limited by the relative nature of the perfusion information
• In TVD with balanced ischemia, the least hypoperfused area appears
normal true extent of CAD may be underestimated
• Gated SPECT allows improved sensitivity (85% to 91%)
Sharir T, Bacher-Stier C, Dhar S, et al: Identification of severe and extensive CAD by
postexercise regional wall motion abnormalities in Tc-99m sestamibi gated SPECT. Am J
Cardiol 2000
83. Imaging in Patients with Established CAD
• Clinical questions may remain after angiography regarding the “physiologic
significance” of stenoses
• SPECT MPI can identify the “culprit” ischemic lesion
• The results of stress-rest SPECT MPI correlate generally with invasive
measures of coronary flow reserve
• Successful PCI Improvement of SPECT evidence of ischemia
84. Imaging After CABG
• Recurrent symptoms post CABG: SPECT MPI accurately detects presence
and location graft stenoses
• Routine assessment for ischemia in an asymptomatic patient is not
recommended (outcome risk is low in the early years after CABG)
• 900 asymptomatic patients post CABG
– Defects were common with SPECT MPI
– Associated with significantly increased relative risk of death or major
events
Ficaro EP American Society of Nuclear Cardiology: Imaging Guidelines for Nuclear Cardiology
Procedures
85. • In symptomatic post-CABG patients : Helps to guide the need for
intervention
• In asymptomatic patients
– Implications for clinical decision making are less clear
– Extent of SPECT abnormality is important
– More extensive perfusion abnormality may justify an invasive
approach
86. Suspected ACS in the Emergency Department
• Patients with symptoms suggestive of ACS but with nondiagnostic ECG and
biomarker
• 99mTc-based perfusion agents may be administered in the ED at rest, with
images acquired 45 to 60 minutes later
• Images reflect myocardial blood flow at the time of injection (minimal
redistribution)
• NPV for ruling out MI is high
• Positive MPI higher risk of cardiac events during the index
hospitalization as well as during follow-up
• Assist triage decisions
87. Suspected ACS in the Emergency Department
• Sensitivity to detect ACS in the ED
– SPECT sestamibi - 92%
– Initial troponin I (drawn at the same time) - 39%
• The maximum troponin I during the first 24 hrs had a sensitivity similar to
that of rest sestamibi imaging but at a distinctly later time point
• Acute MPI has the potential to identify ACS earlier than biomarkers
• One RCT of 46 ED patients with ongoing chest pain and a nondiagnostic
ECG
– MPI-guided strategy incurred lower costs and resulted in shorter
lengths of stay
Stowers SA et al: An economic analysis of an aggressive diagnostic strategy with SPECT MPI
and early exercise stress testing in ED patients who present with chest pain but nondiagnostic
ECGs: Results from a randomized trial. Ann Emerg Med 2000
88. • The Emergency Room Assessment of Sestamibi for Evaluation of chest
pain trial (ERASE)
– 2475 patients with symptoms suggestive of ACS
– Significant 20% relative reduction in unnecessary admissions with
incorporation of MPI into the ED evaluation strategy
89. NSTEMI and UA
SPECT perfusion imaging in patients after medical stabilization of unstable angina
Summary of
predictive values of
SPECT imaging in
the aftermath of UA
from multiple studies
High-risk stress-rest
SPECT MPI
Despite medical
stabilisation,
requires intervention
Normal
SPECT MPI
90. Assessment of Inducible Ischemia after MI
• Three major determinants of natural history risk after an acute MI
– Residual resting LV function
– Extent of ischemic, jeopardized myocardium
– Susceptibility to ventricular arrhythmias
• Gated SPECT MPI
– Has the ability to provide much of this information
– Has the potential to be the single most important test in the stable
patient after STEMI
• A “low-risk” 201Tl image (no reversible defects and no lung uptake) was
associated with a low-risk natural history outcome after MI
Beller GA:Clinical value of MPI in CAD. J Nucl Cardiol 2003
91. AUC(Appropriate Use Criteria)
• For optimal patient selection
• Term Appropriate does not mandate testing but
supports that large proportion of patients within a
given indication will be candidates for nuclear
imaging.
• Term Rarely appropriate does not prohibit testing
but implies only limited number of patients within
given indication will require nuclear imaging.
92.
93.
94.
95. Hendel RC, Berman DS, Di Carli MF, Heidenreich PA, Henkin RE, Pellikka PA, Pohost GM, Williams KA.
ACCF/ASNC/ACR/AHA/ASE/ SCCT/SCMR/SNM 2009 appropriate use criteria for cardiac radionuclide imaging