Download as PDF, PPTX

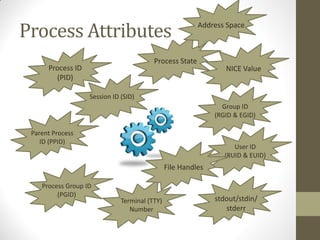
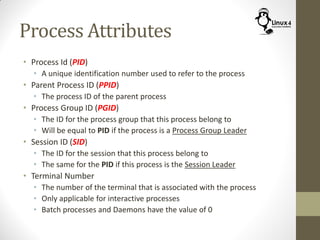
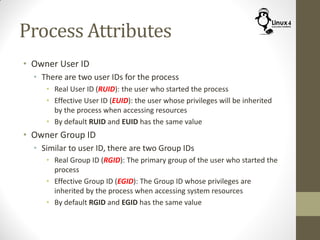
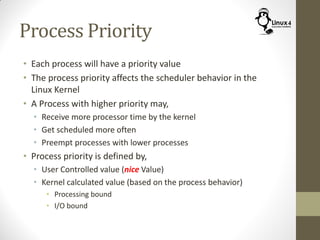

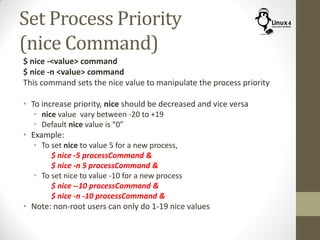
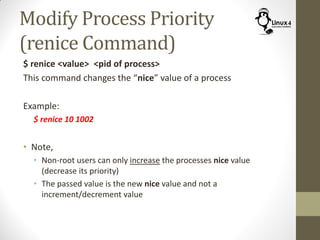
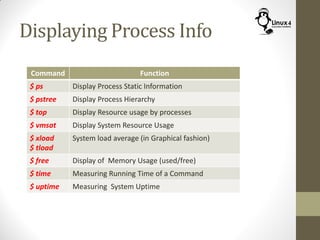
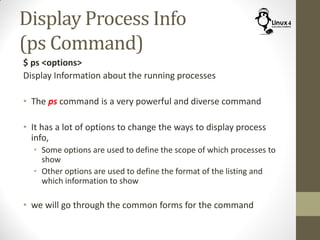
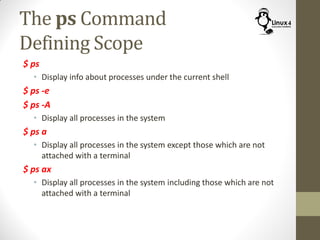
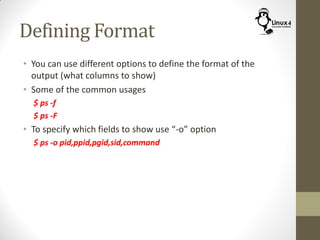
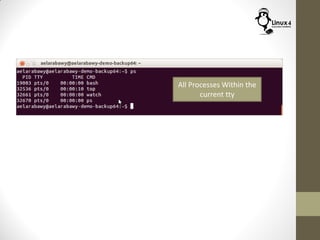
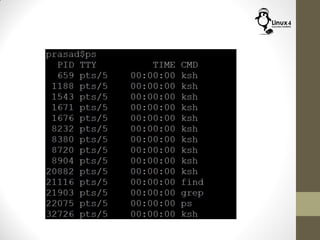
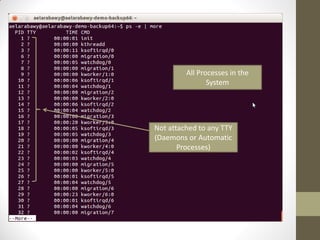
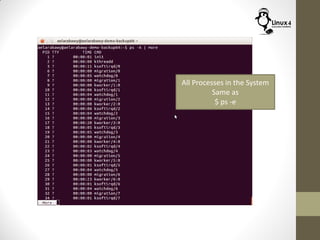
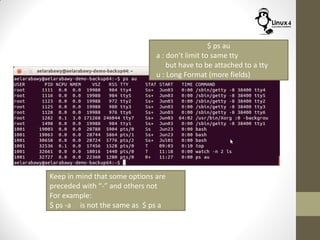
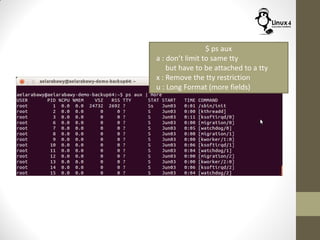
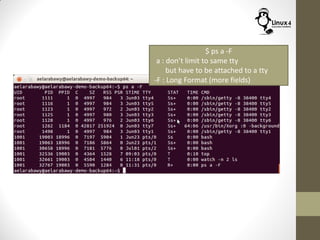
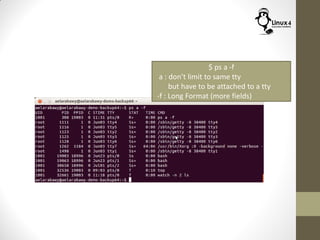
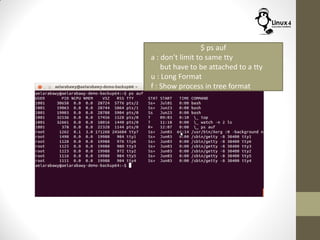
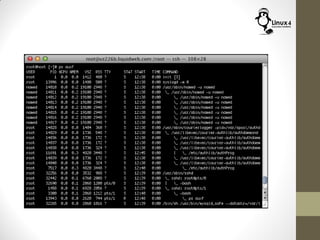
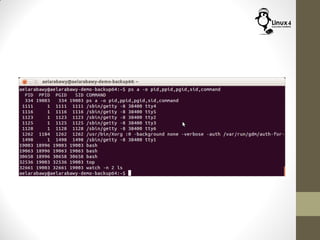
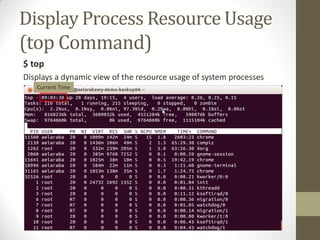
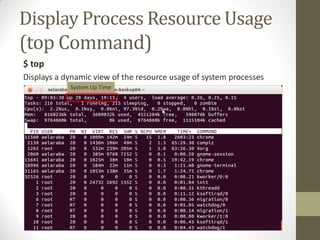
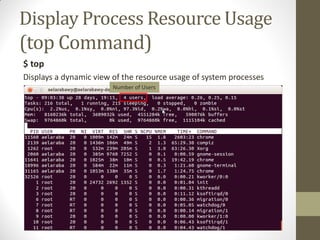
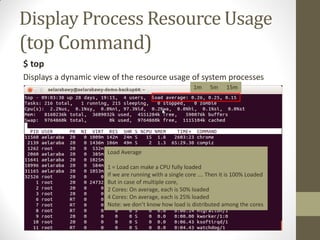
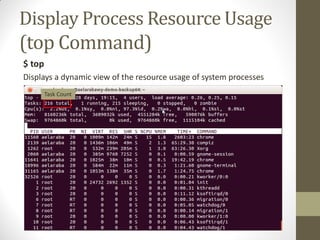
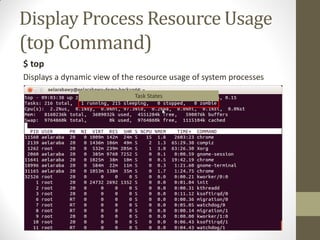
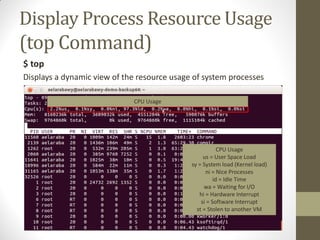
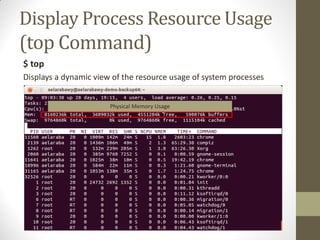
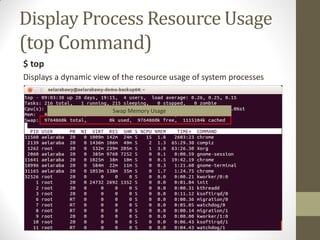

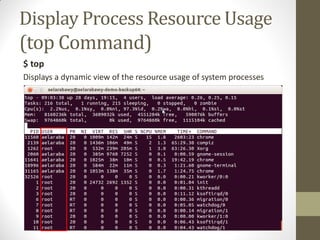

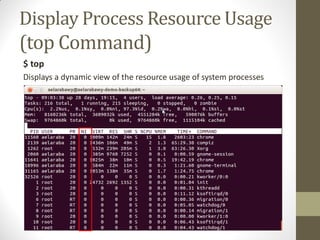

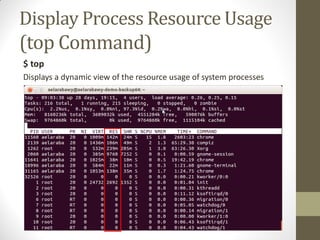
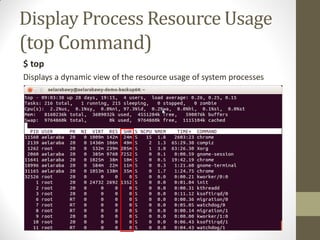

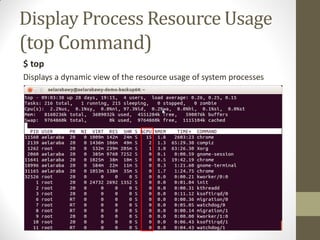

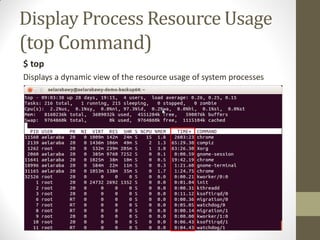
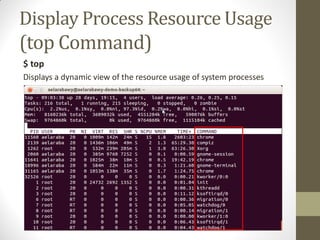


This document discusses process monitoring in Linux systems. It describes various commands and attributes used to monitor and view information about running processes. Some key points: - The ps command displays information about running processes and has many options to define the scope and format of the output. - The top command provides a dynamic real-time view of process resource usage, including CPU usage and memory usage. - Process attributes that can be viewed include the process ID, parent process ID, user IDs, priority levels set by the nice value, and more. - Additional commands are described that provide system information like uptime, load averages, memory and swap usage.