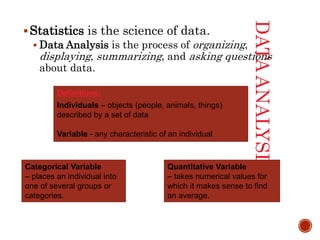
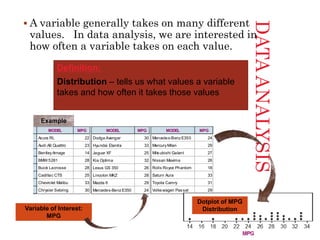
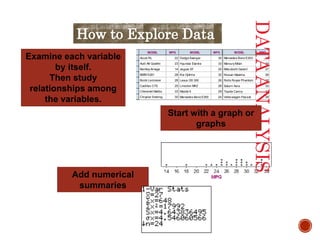
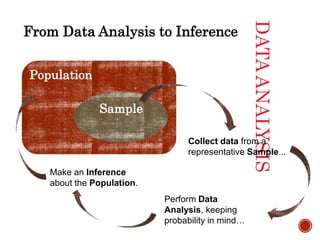
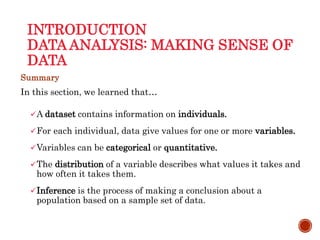
CHAPTER 1
EXPLORING DATA
 Introduction: Data Analysis: Making Sense of Data
 1.1 Analyzing Categorical Data
 1.2 Displaying Quantitative Data with Graphs
 1.3 Describing Quantitative Data with Numbers
INTRODUCTION
DATA ANALYSIS: MAKING SENSE OF
DATA
Learning Objectives
After this section, you should be able to…
DEFINE “Individuals” and “Variables”
DISTINGUISH between “Categorical” and “Quantitative”
variables
DEFINE “Distribution”
DESCRIBE the idea behind “Inference”
DATAANALYSIS
Statistics is the science of data.
 Data Analysis is the process of organizing,
displaying, summarizing, and asking questions
about data.
Definitions:
Individuals – objects (people, animals, things)
described by a set of data
Variable - any characteristic of an individual
Categorical Variable
– places an individual into
one of several groups or
categories.
Quantitative Variable
– takes numerical values for
which it makes sense to find
an average.
DATAANALYSIS
 A variable generally takes on many different
values. In data analysis, we are interested in
how often a variable takes on each value.
Definition:
Distribution – tells us what values a variable
takes and how often it takes those values
2009 Fuel EconomyGuide
MODEL MPG
1
2
3
4
5
6
7
8
9
Acura RL 22
Audi A6 Quattro 23
BentleyArnage 14
BMW5281 28
Buick Lacrosse 28
Cadillac CTS 25
Chevrolet Malibu 33
Chrysler Sebring 30
Dodge Avenger 30
2009 Fuel EconomyGuide
MODEL MPG <new>
9
10
11
12
13
14
15
16
17
Dodge Avenger 30
Hyundai Elantra 33
Jaguar XF 25
Kia Optima 32
Lexus GS 350 26
Lincolon MKZ 28
Mazda 6 29
Mercedes-BenzE350 24
MercuryMilan 29
2009 Fuel EconomyGuide
MODEL MPG <new>
16
17
18
19
20
21
22
23
24
Mercedes-BenzE350 24
MercuryMilan 29
Mitsubishi Galant 27
Nissan Maxima 26
Rolls Royce Phantom 18
Saturn Aura 33
Toyota Camry 31
Volkswagen Passat 29
Volvo S80 25
Variable of Interest:
MPG
Dotplot of MPG
Distribution
Example
2009 Fuel EconomyGuide
MODEL MPG <new>
9
10
11
12
13
14
15
16
17
Dodge Avenger 30
Hyundai Elantra 33
Jaguar XF 25
Kia Optima 32
Lexus GS 350 26
Lincolon MKZ 28
Mazda 6 29
Mercedes-BenzE350 24
MercuryMilan 29
2009 Fuel EconomyGuide
MODEL MPG <new>
16
17
18
19
20
21
22
23
24
Mercedes-BenzE350 24
MercuryMilan 29
Mitsubishi Galant 27
Nissan Maxima 26
Rolls Royce Phantom 18
Saturn Aura 33
Toyota Camry 31
Volkswagen Passat 29
Volvo S80 25
2009 Fuel EconomyGuide
MODEL MPG
1
2
3
4
5
6
7
8
9
Acura RL 22
Audi A6 Quattro 23
BentleyArnage 14
BMW5281 28
Buick Lacrosse 28
Cadillac CTS 25
Chevrolet Malibu 33
Chrysler Sebring 30
Dodge Avenger 30
Add numerical
summaries
DATAANALYSIS
Examine each variable
by itself.
Then study
relationships among
the variables.
Start with a graph or
graphs
How to Explore Data
DATAANALYSIS
From Data Analysis to Inference
Population
Sample
Collect data from a
representative Sample...
Perform Data
Analysis, keeping
probability in mind…
Make an Inference
about the Population.
ACTIVITY: HIRING
DISCRIMINATION Follow the directions on Page 5
 Perform 5 repetitions of your simulation.
 Turn in your results to your teacher.
 Teacher: Right-click (control-click) on the graph to edit the counts.
DataAnalysis
INTRODUCTION
DATA ANALYSIS: MAKING SENSE OF
DATA
Summary
In this section, we learned that…
A dataset contains information on individuals.
For each individual, data give values for one or more variables.
Variables can be categorical or quantitative.
The distribution of a variable describes what values it takes and
how often it takes them.
Inference is the process of making a conclusion about a
population based on a sample set of data.
LOOKING AHEAD…
We’ll learn how to analyze categorical data.
Bar Graphs
Pie Charts
Two-Way Tables
Conditional Distributions
We’ll also learn how to organize a statistical problem.
In the next Section…

Business statistics (Introduction)

  • 2.
    CHAPTER 1 EXPLORING DATA Introduction: Data Analysis: Making Sense of Data  1.1 Analyzing Categorical Data  1.2 Displaying Quantitative Data with Graphs  1.3 Describing Quantitative Data with Numbers
  • 3.
    INTRODUCTION DATA ANALYSIS: MAKINGSENSE OF DATA Learning Objectives After this section, you should be able to… DEFINE “Individuals” and “Variables” DISTINGUISH between “Categorical” and “Quantitative” variables DEFINE “Distribution” DESCRIBE the idea behind “Inference”
  • 4.
    DATAANALYSIS Statistics is thescience of data.  Data Analysis is the process of organizing, displaying, summarizing, and asking questions about data. Definitions: Individuals – objects (people, animals, things) described by a set of data Variable - any characteristic of an individual Categorical Variable – places an individual into one of several groups or categories. Quantitative Variable – takes numerical values for which it makes sense to find an average.
  • 5.
    DATAANALYSIS  A variablegenerally takes on many different values. In data analysis, we are interested in how often a variable takes on each value. Definition: Distribution – tells us what values a variable takes and how often it takes those values 2009 Fuel EconomyGuide MODEL MPG 1 2 3 4 5 6 7 8 9 Acura RL 22 Audi A6 Quattro 23 BentleyArnage 14 BMW5281 28 Buick Lacrosse 28 Cadillac CTS 25 Chevrolet Malibu 33 Chrysler Sebring 30 Dodge Avenger 30 2009 Fuel EconomyGuide MODEL MPG <new> 9 10 11 12 13 14 15 16 17 Dodge Avenger 30 Hyundai Elantra 33 Jaguar XF 25 Kia Optima 32 Lexus GS 350 26 Lincolon MKZ 28 Mazda 6 29 Mercedes-BenzE350 24 MercuryMilan 29 2009 Fuel EconomyGuide MODEL MPG <new> 16 17 18 19 20 21 22 23 24 Mercedes-BenzE350 24 MercuryMilan 29 Mitsubishi Galant 27 Nissan Maxima 26 Rolls Royce Phantom 18 Saturn Aura 33 Toyota Camry 31 Volkswagen Passat 29 Volvo S80 25 Variable of Interest: MPG Dotplot of MPG Distribution Example
  • 6.
    2009 Fuel EconomyGuide MODELMPG <new> 9 10 11 12 13 14 15 16 17 Dodge Avenger 30 Hyundai Elantra 33 Jaguar XF 25 Kia Optima 32 Lexus GS 350 26 Lincolon MKZ 28 Mazda 6 29 Mercedes-BenzE350 24 MercuryMilan 29 2009 Fuel EconomyGuide MODEL MPG <new> 16 17 18 19 20 21 22 23 24 Mercedes-BenzE350 24 MercuryMilan 29 Mitsubishi Galant 27 Nissan Maxima 26 Rolls Royce Phantom 18 Saturn Aura 33 Toyota Camry 31 Volkswagen Passat 29 Volvo S80 25 2009 Fuel EconomyGuide MODEL MPG 1 2 3 4 5 6 7 8 9 Acura RL 22 Audi A6 Quattro 23 BentleyArnage 14 BMW5281 28 Buick Lacrosse 28 Cadillac CTS 25 Chevrolet Malibu 33 Chrysler Sebring 30 Dodge Avenger 30 Add numerical summaries DATAANALYSIS Examine each variable by itself. Then study relationships among the variables. Start with a graph or graphs How to Explore Data
  • 7.
    DATAANALYSIS From Data Analysisto Inference Population Sample Collect data from a representative Sample... Perform Data Analysis, keeping probability in mind… Make an Inference about the Population.
  • 8.
    ACTIVITY: HIRING DISCRIMINATION Followthe directions on Page 5  Perform 5 repetitions of your simulation.  Turn in your results to your teacher.  Teacher: Right-click (control-click) on the graph to edit the counts. DataAnalysis
  • 9.
    INTRODUCTION DATA ANALYSIS: MAKINGSENSE OF DATA Summary In this section, we learned that… A dataset contains information on individuals. For each individual, data give values for one or more variables. Variables can be categorical or quantitative. The distribution of a variable describes what values it takes and how often it takes them. Inference is the process of making a conclusion about a population based on a sample set of data.
  • 10.
    LOOKING AHEAD… We’ll learnhow to analyze categorical data. Bar Graphs Pie Charts Two-Way Tables Conditional Distributions We’ll also learn how to organize a statistical problem. In the next Section…