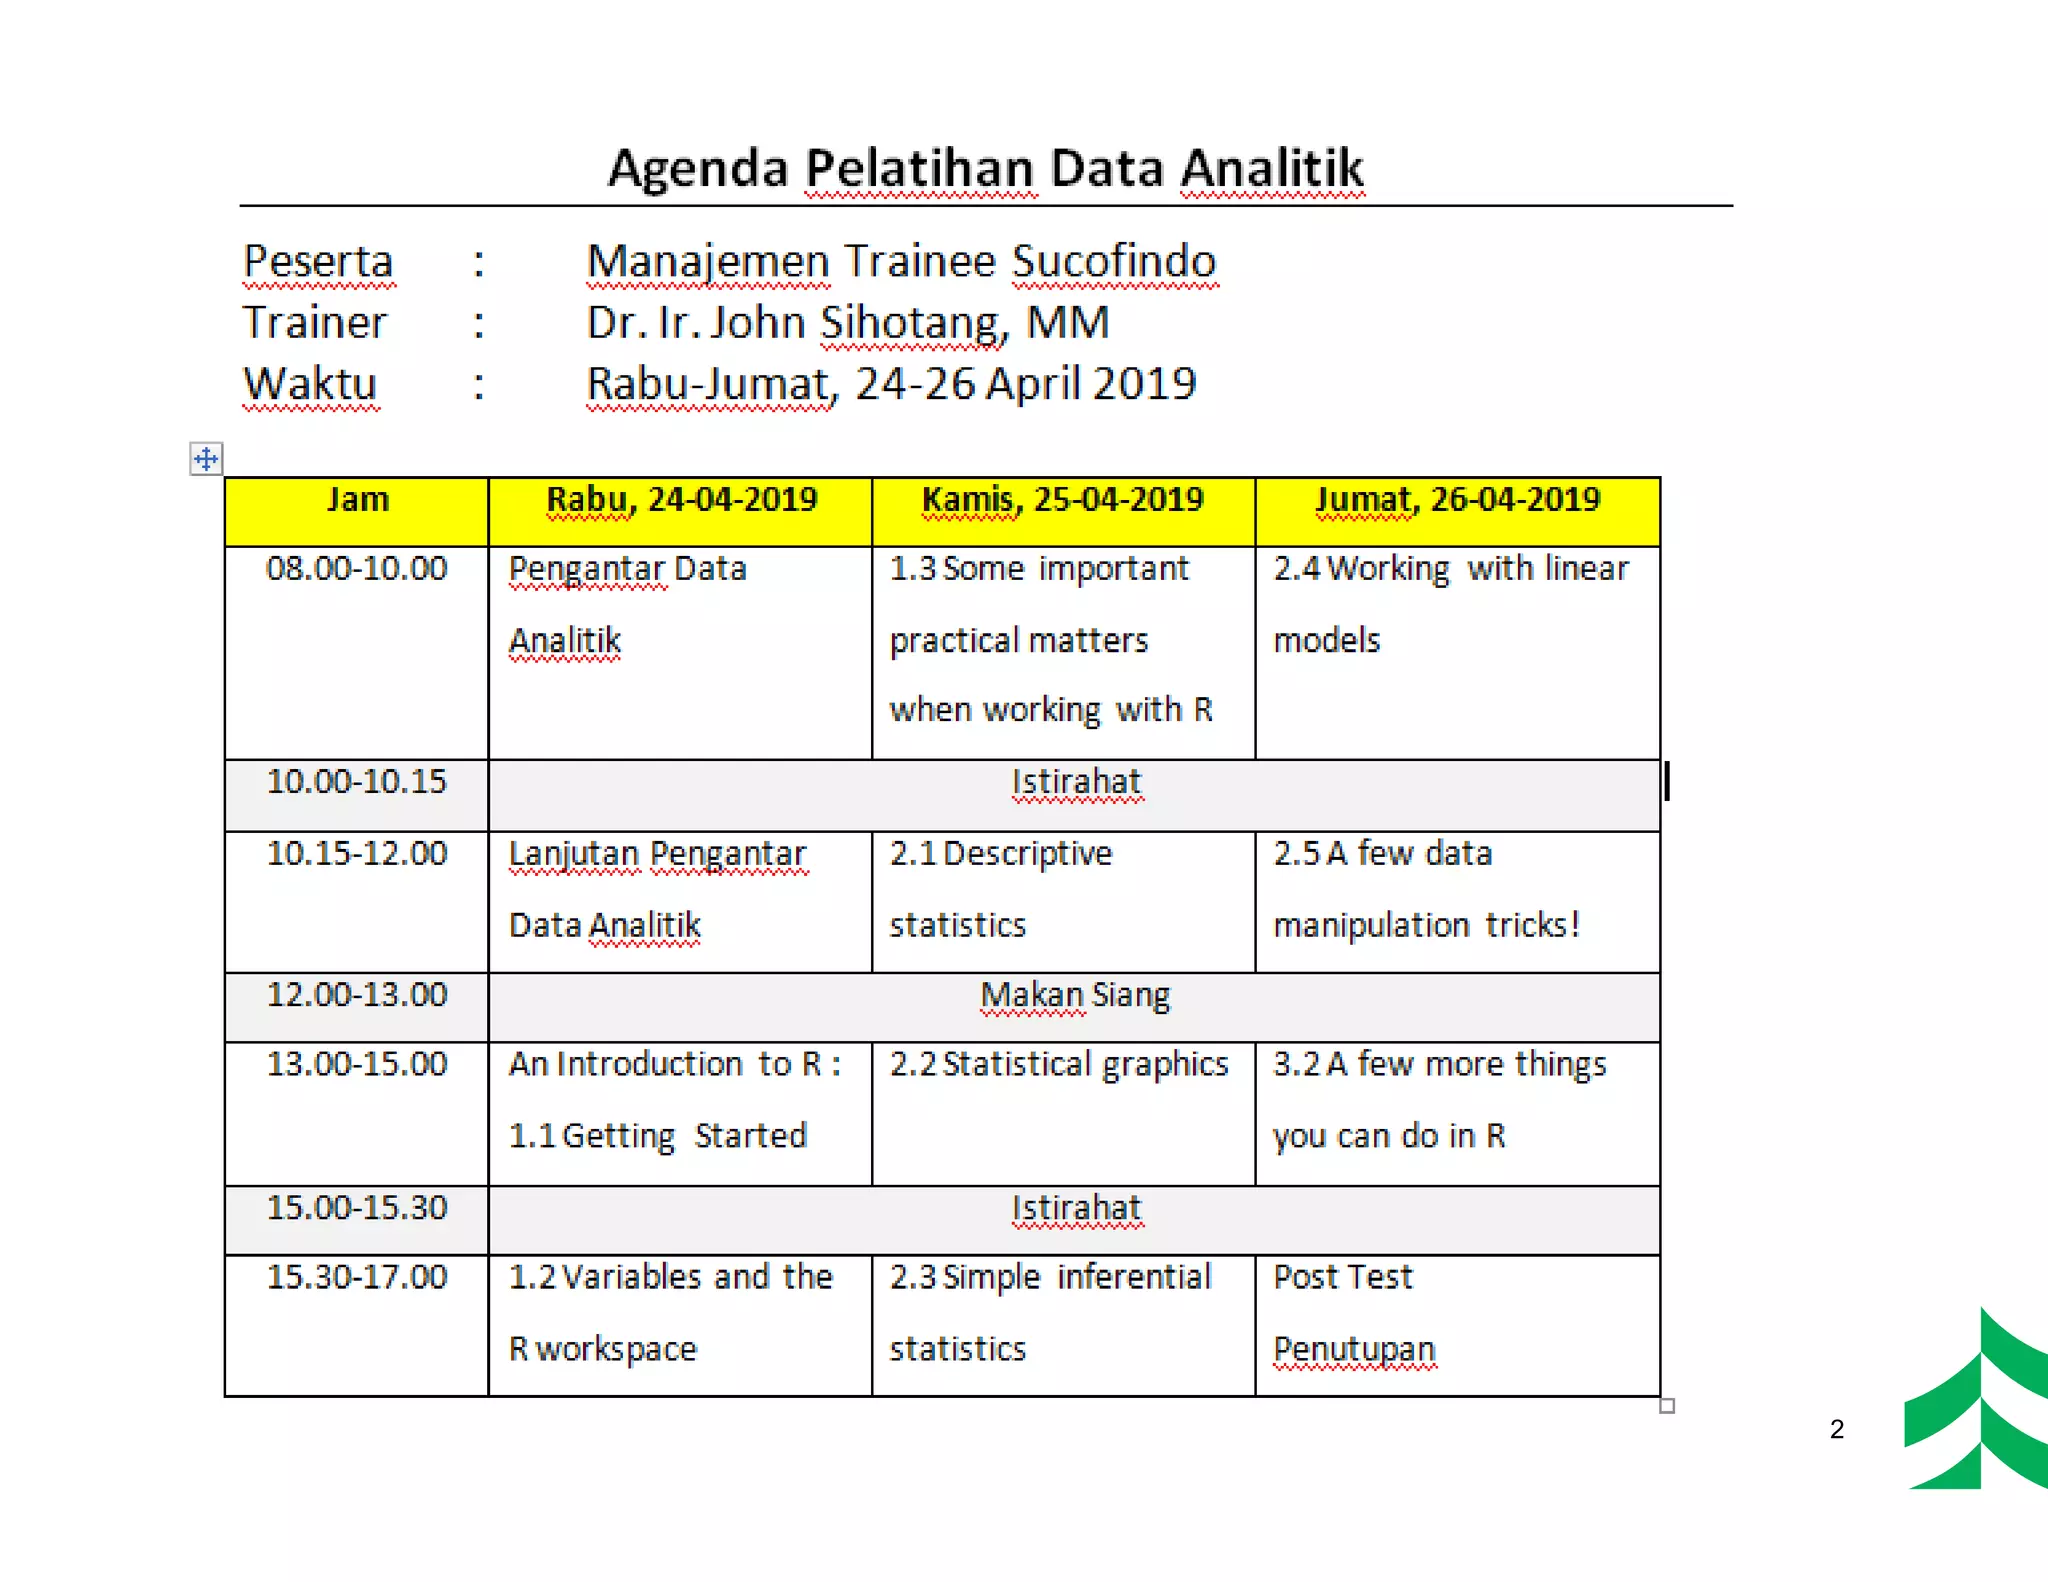
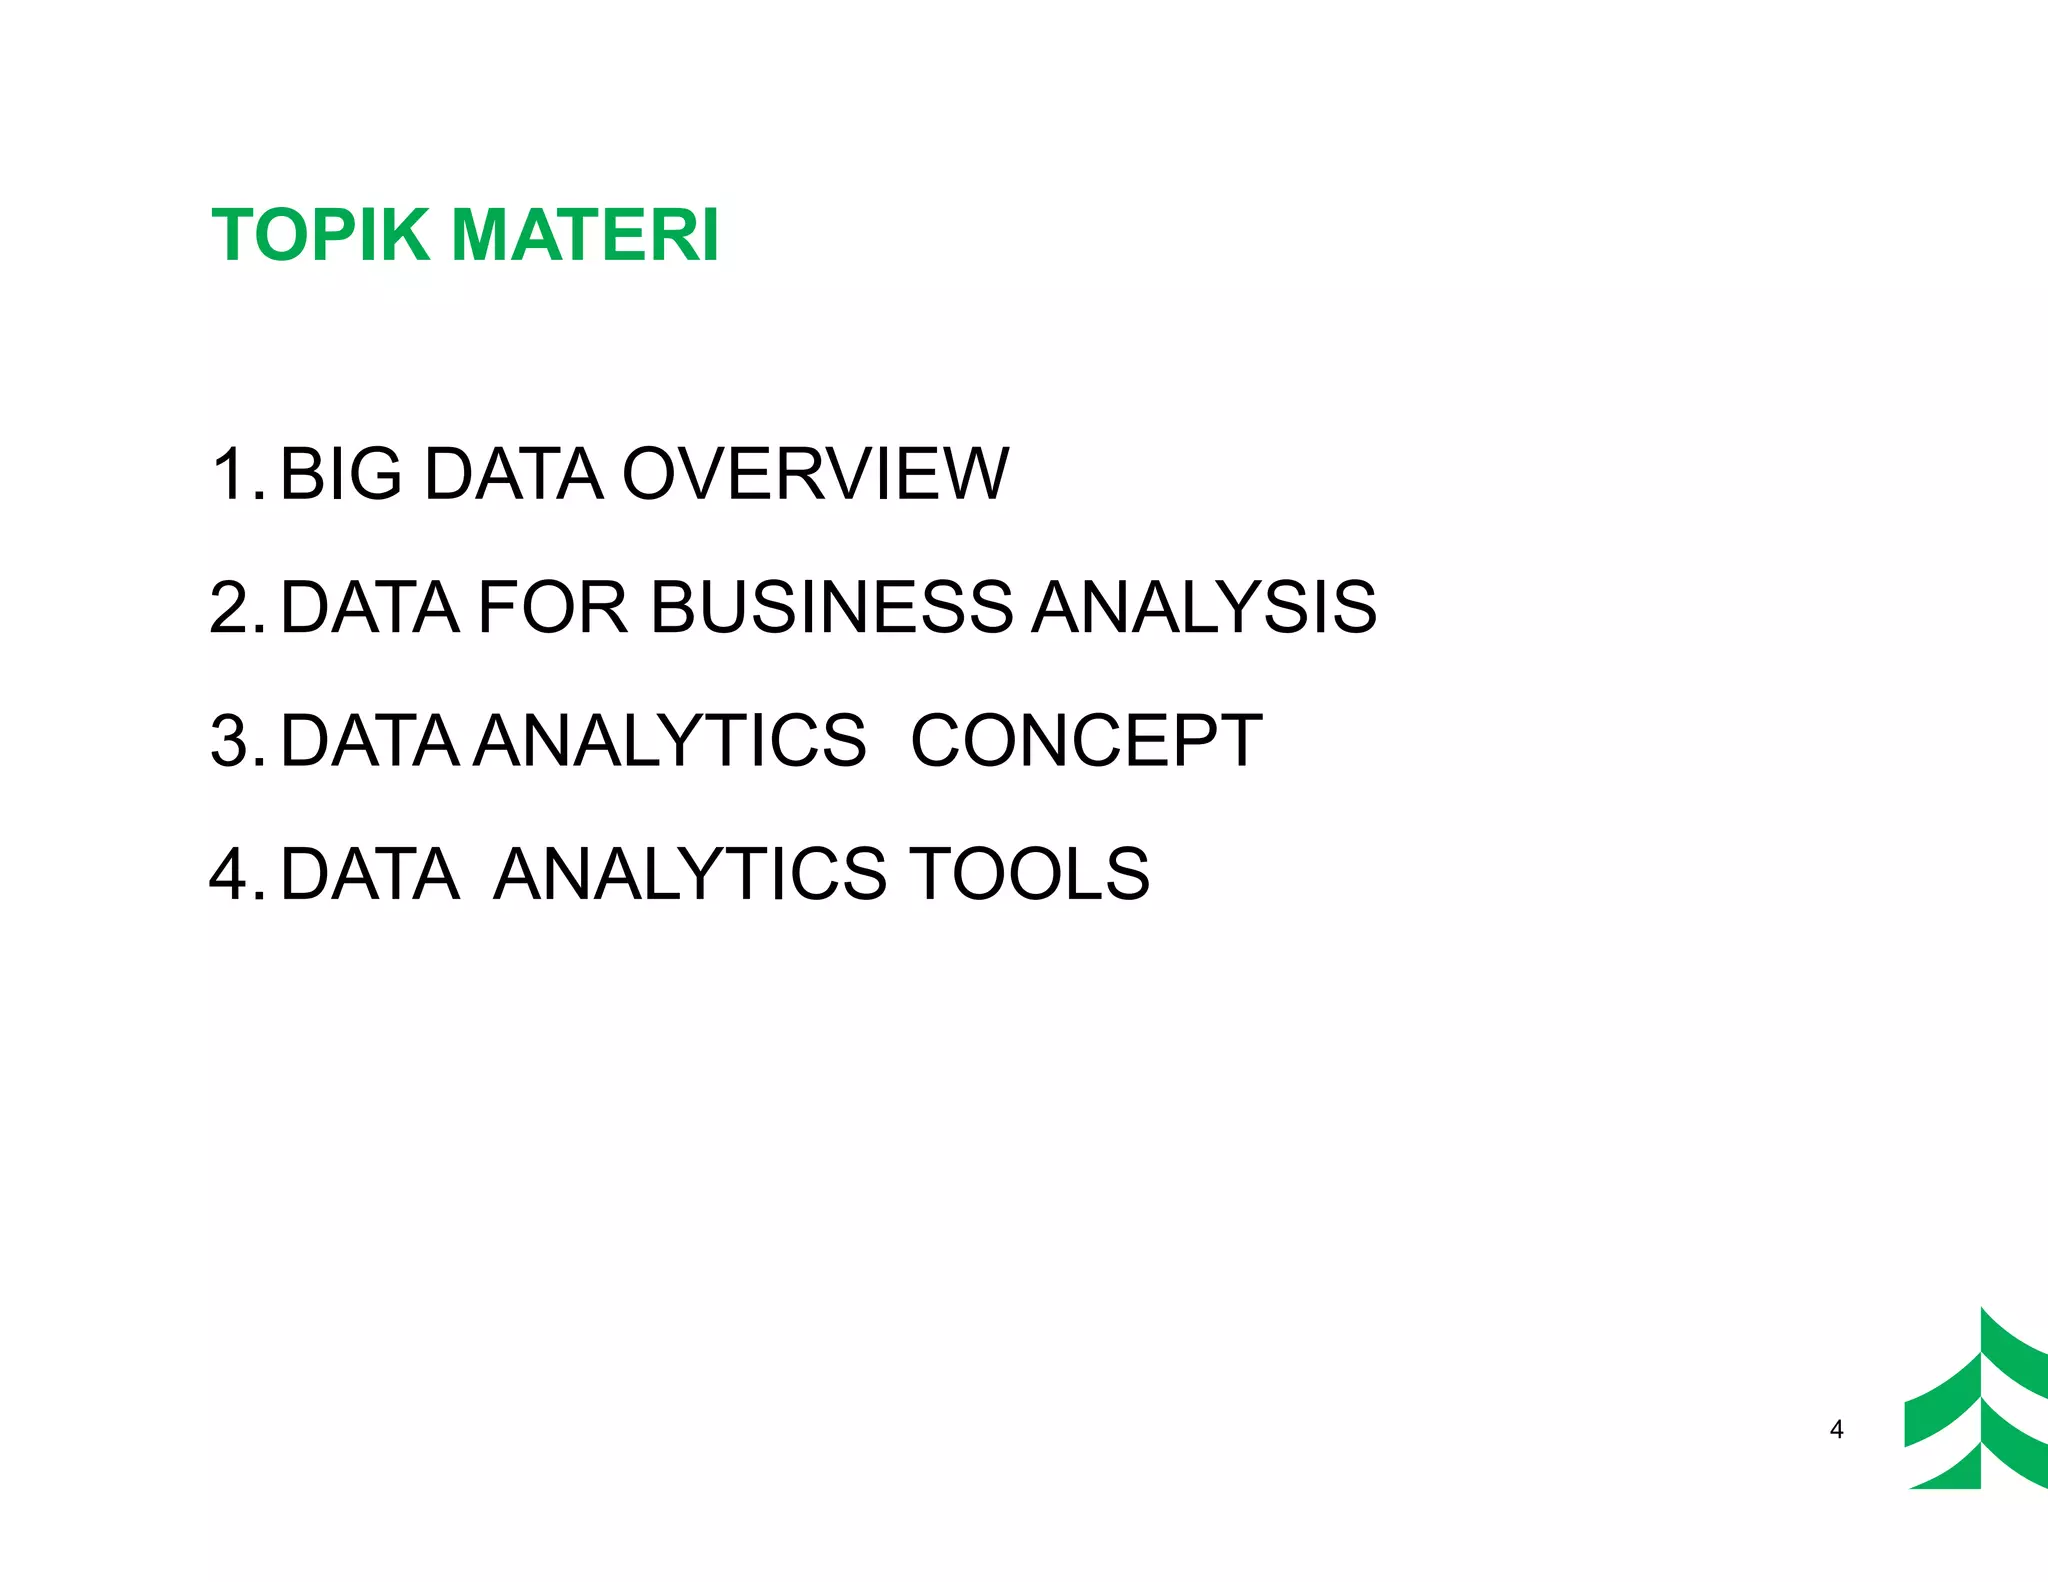
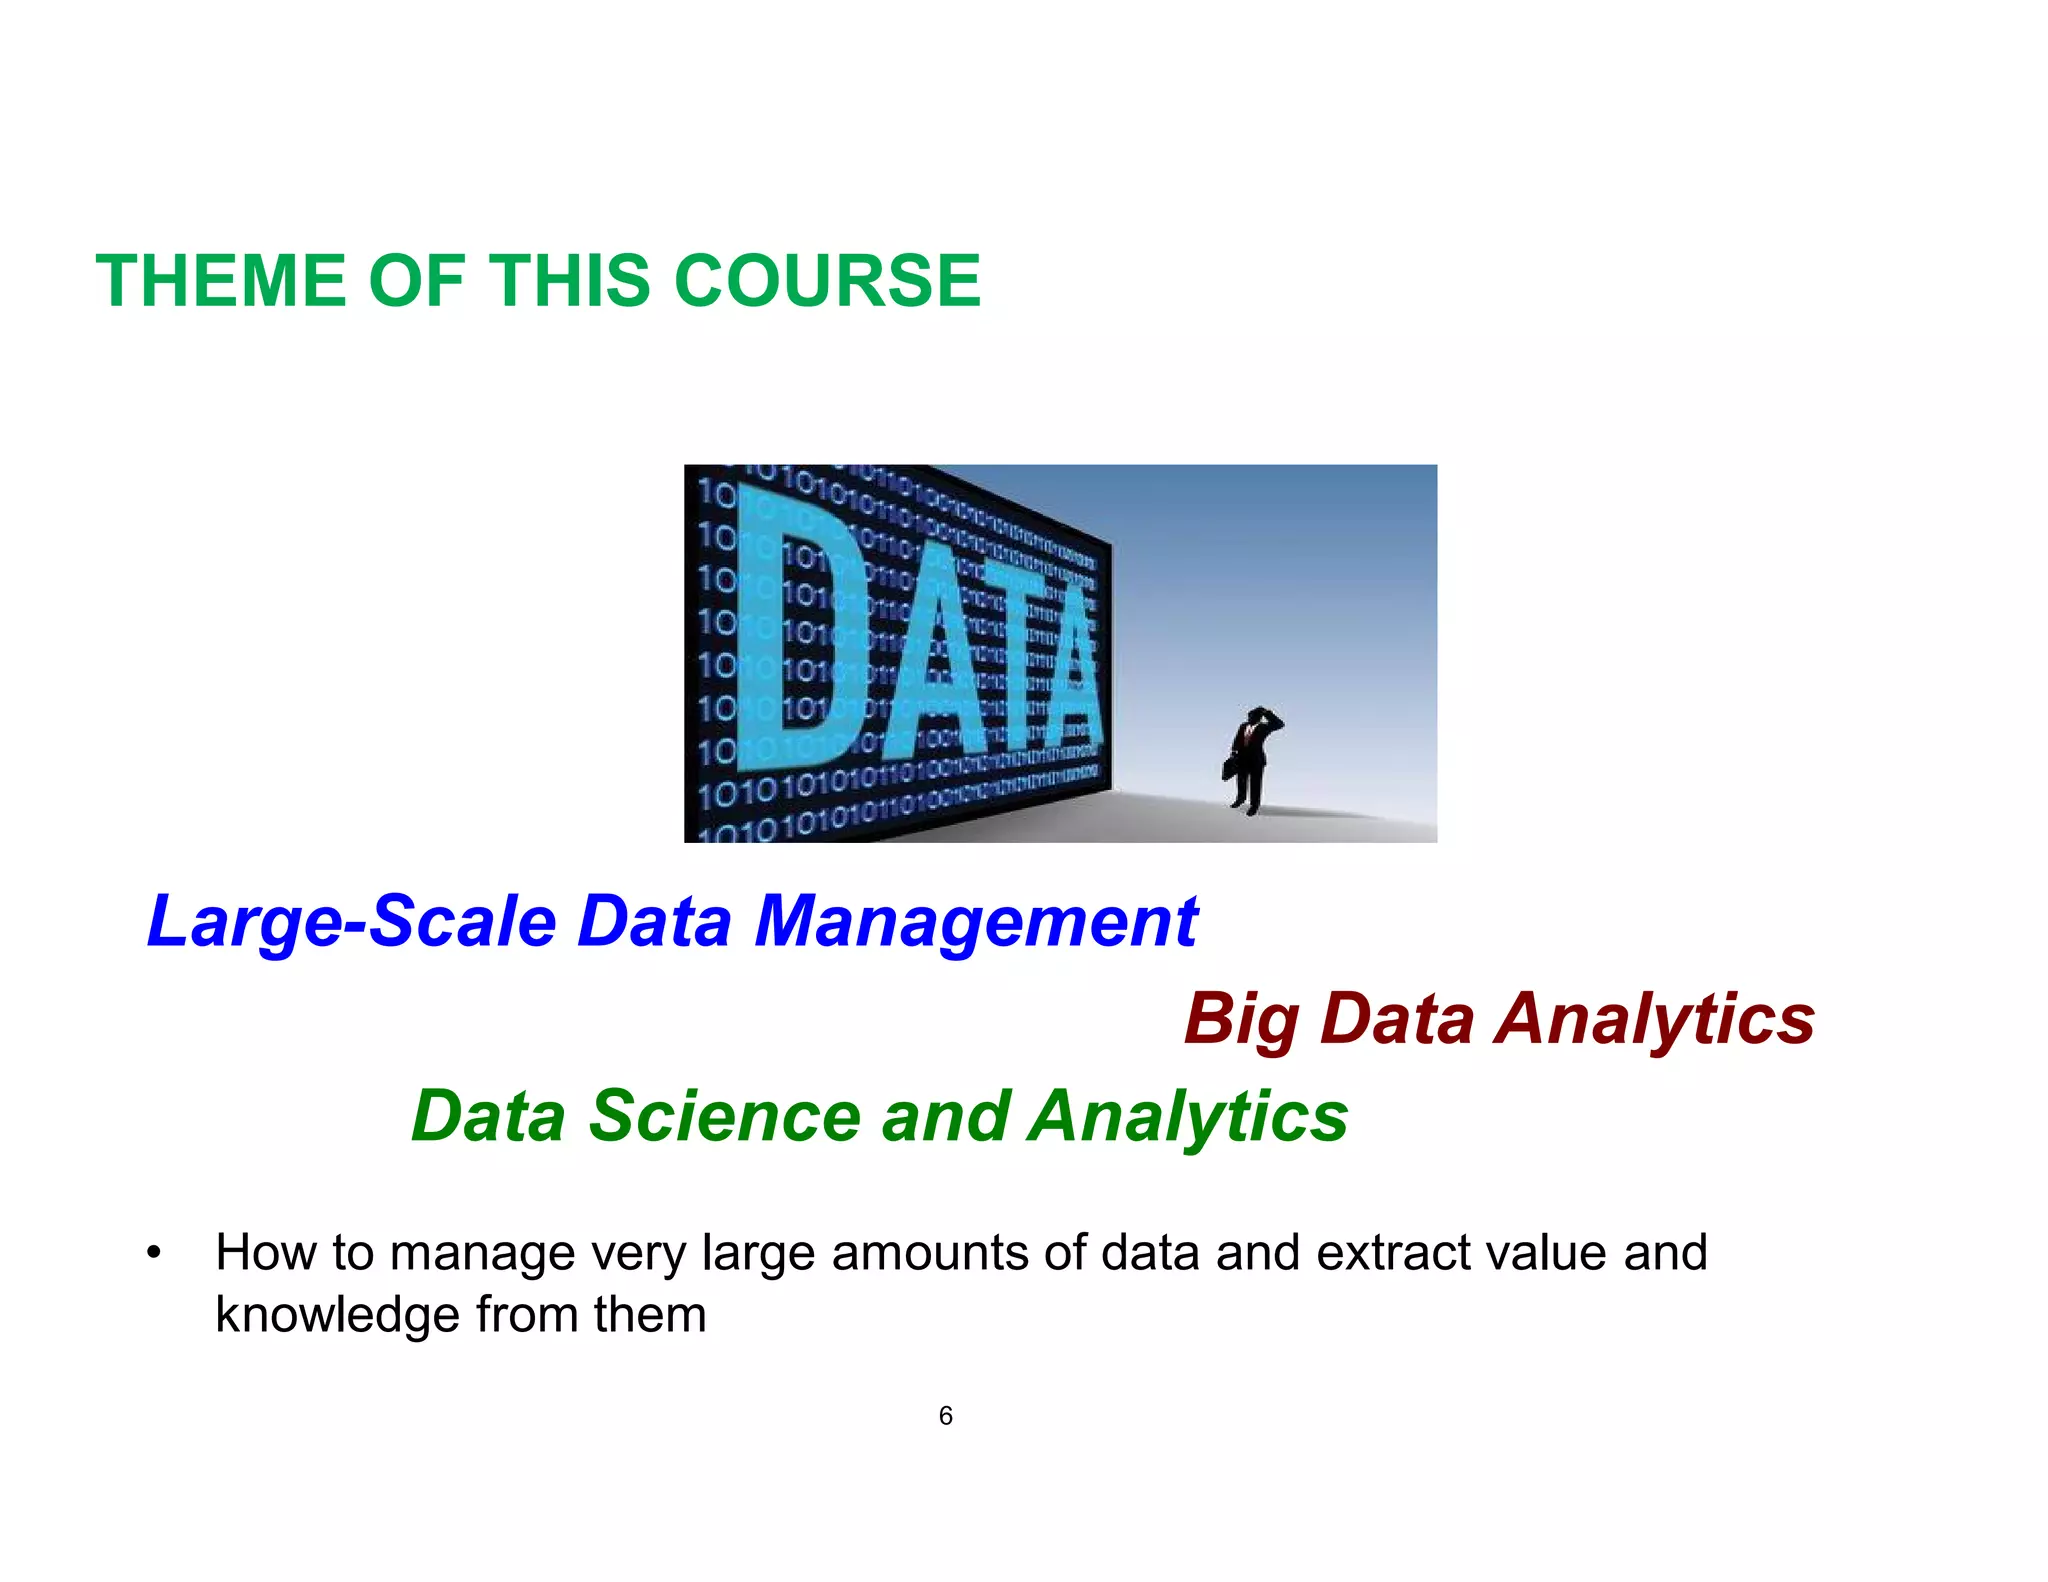
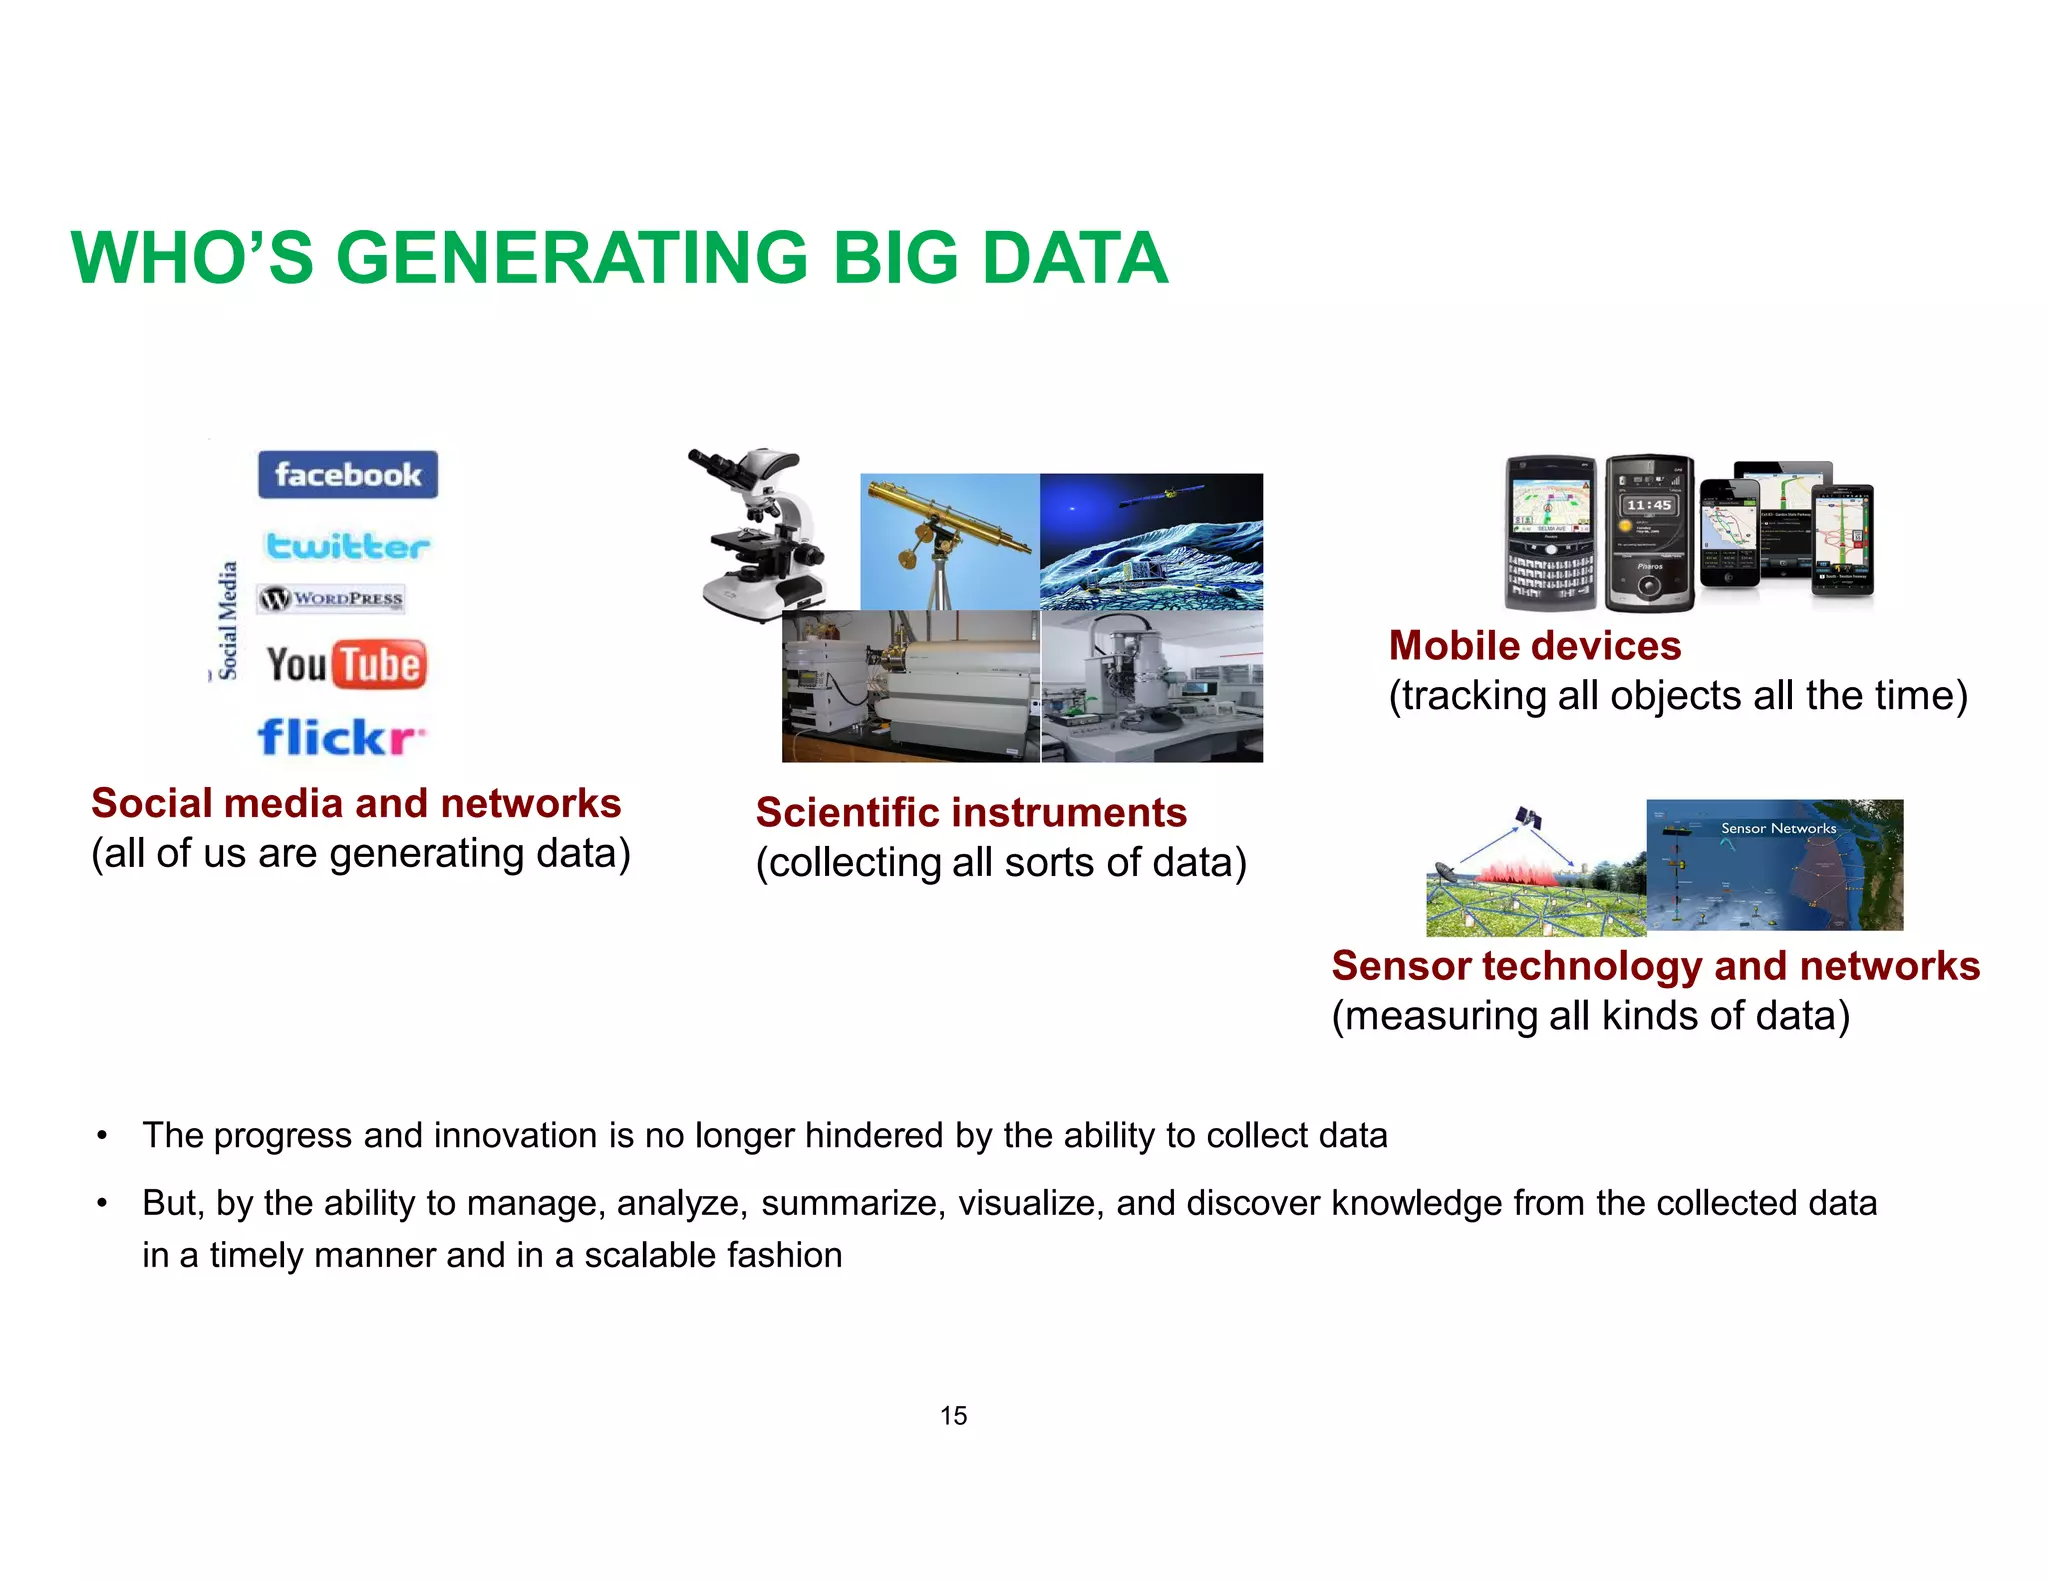
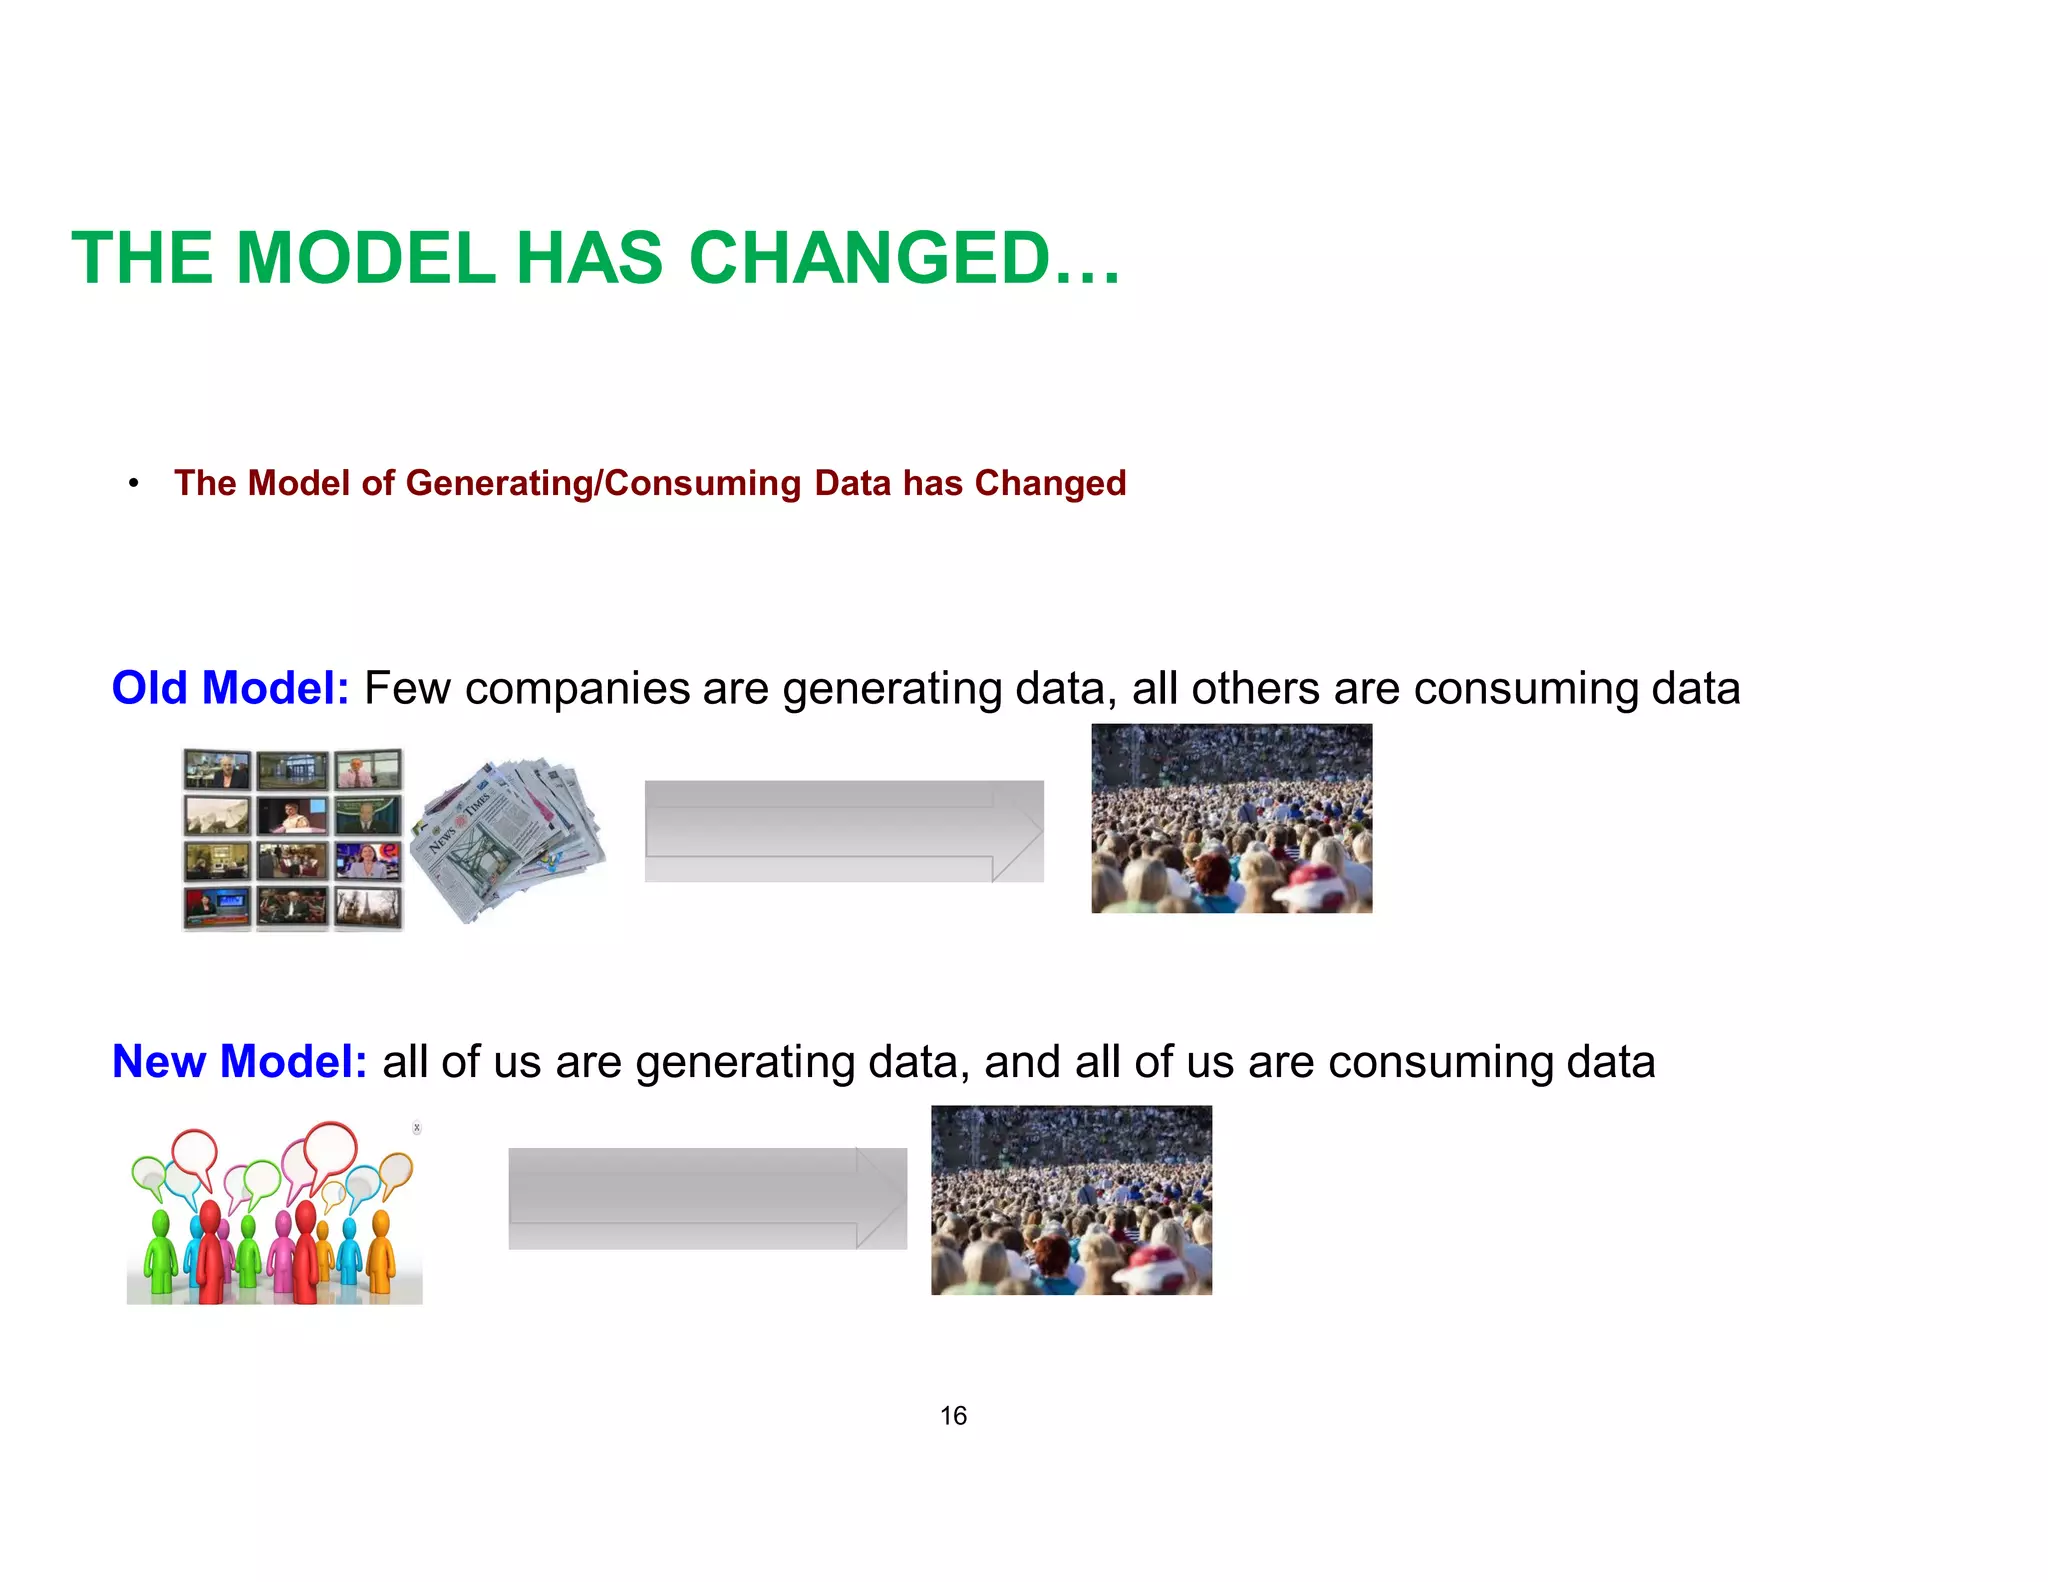
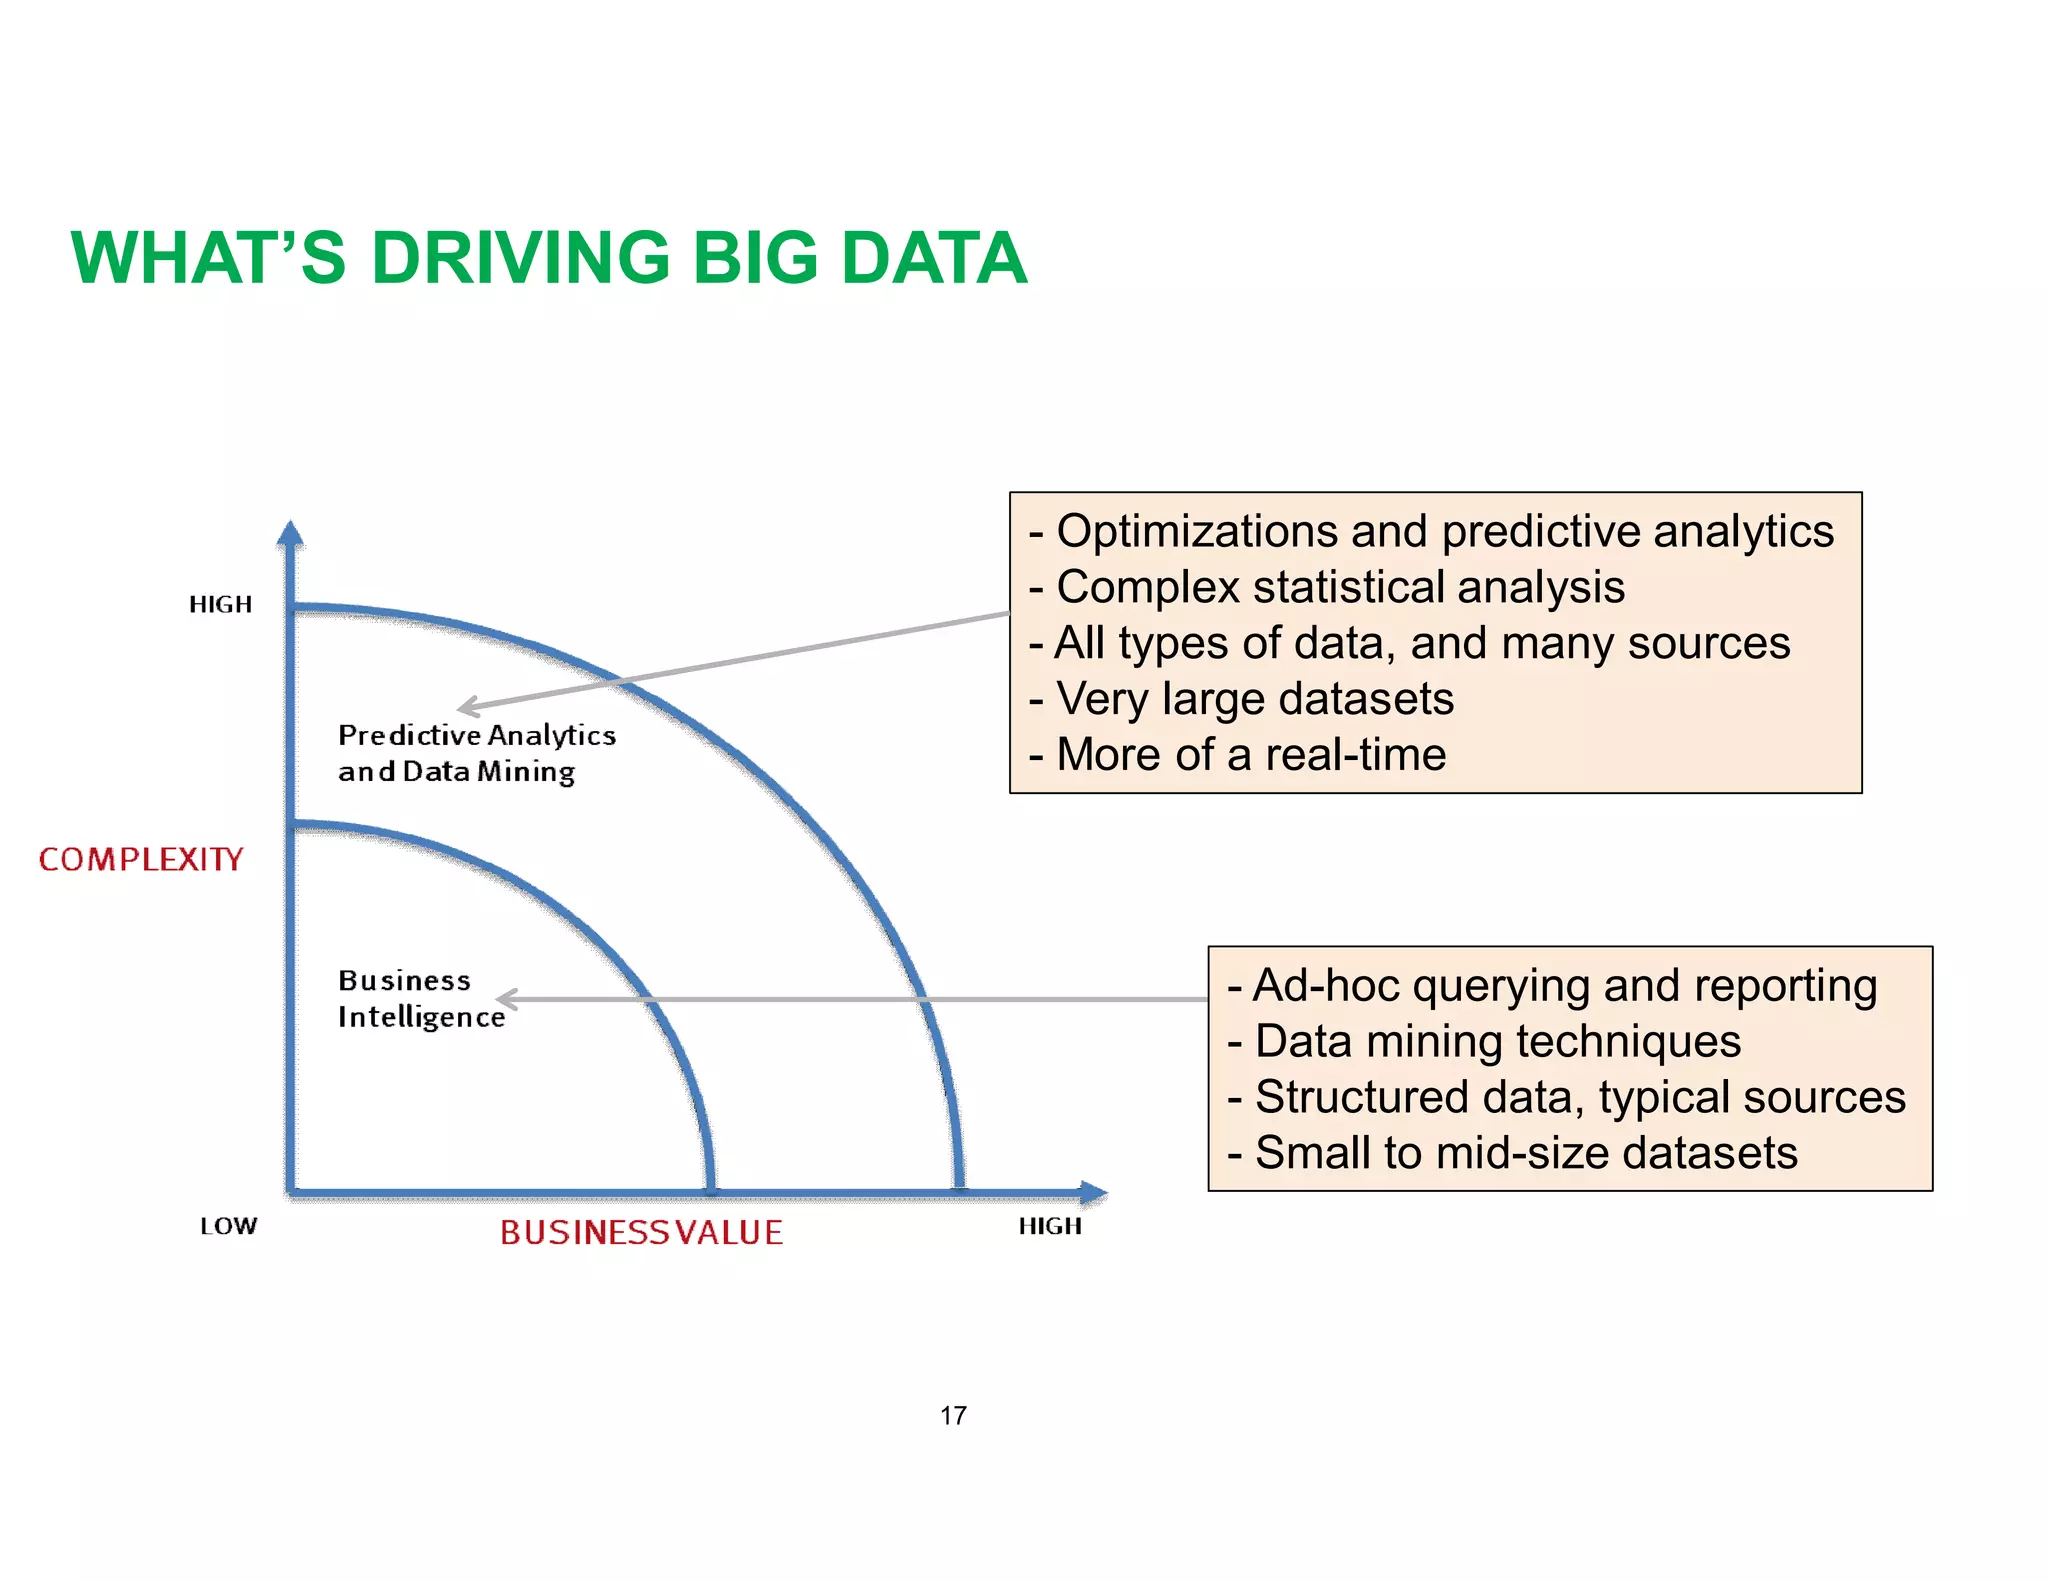
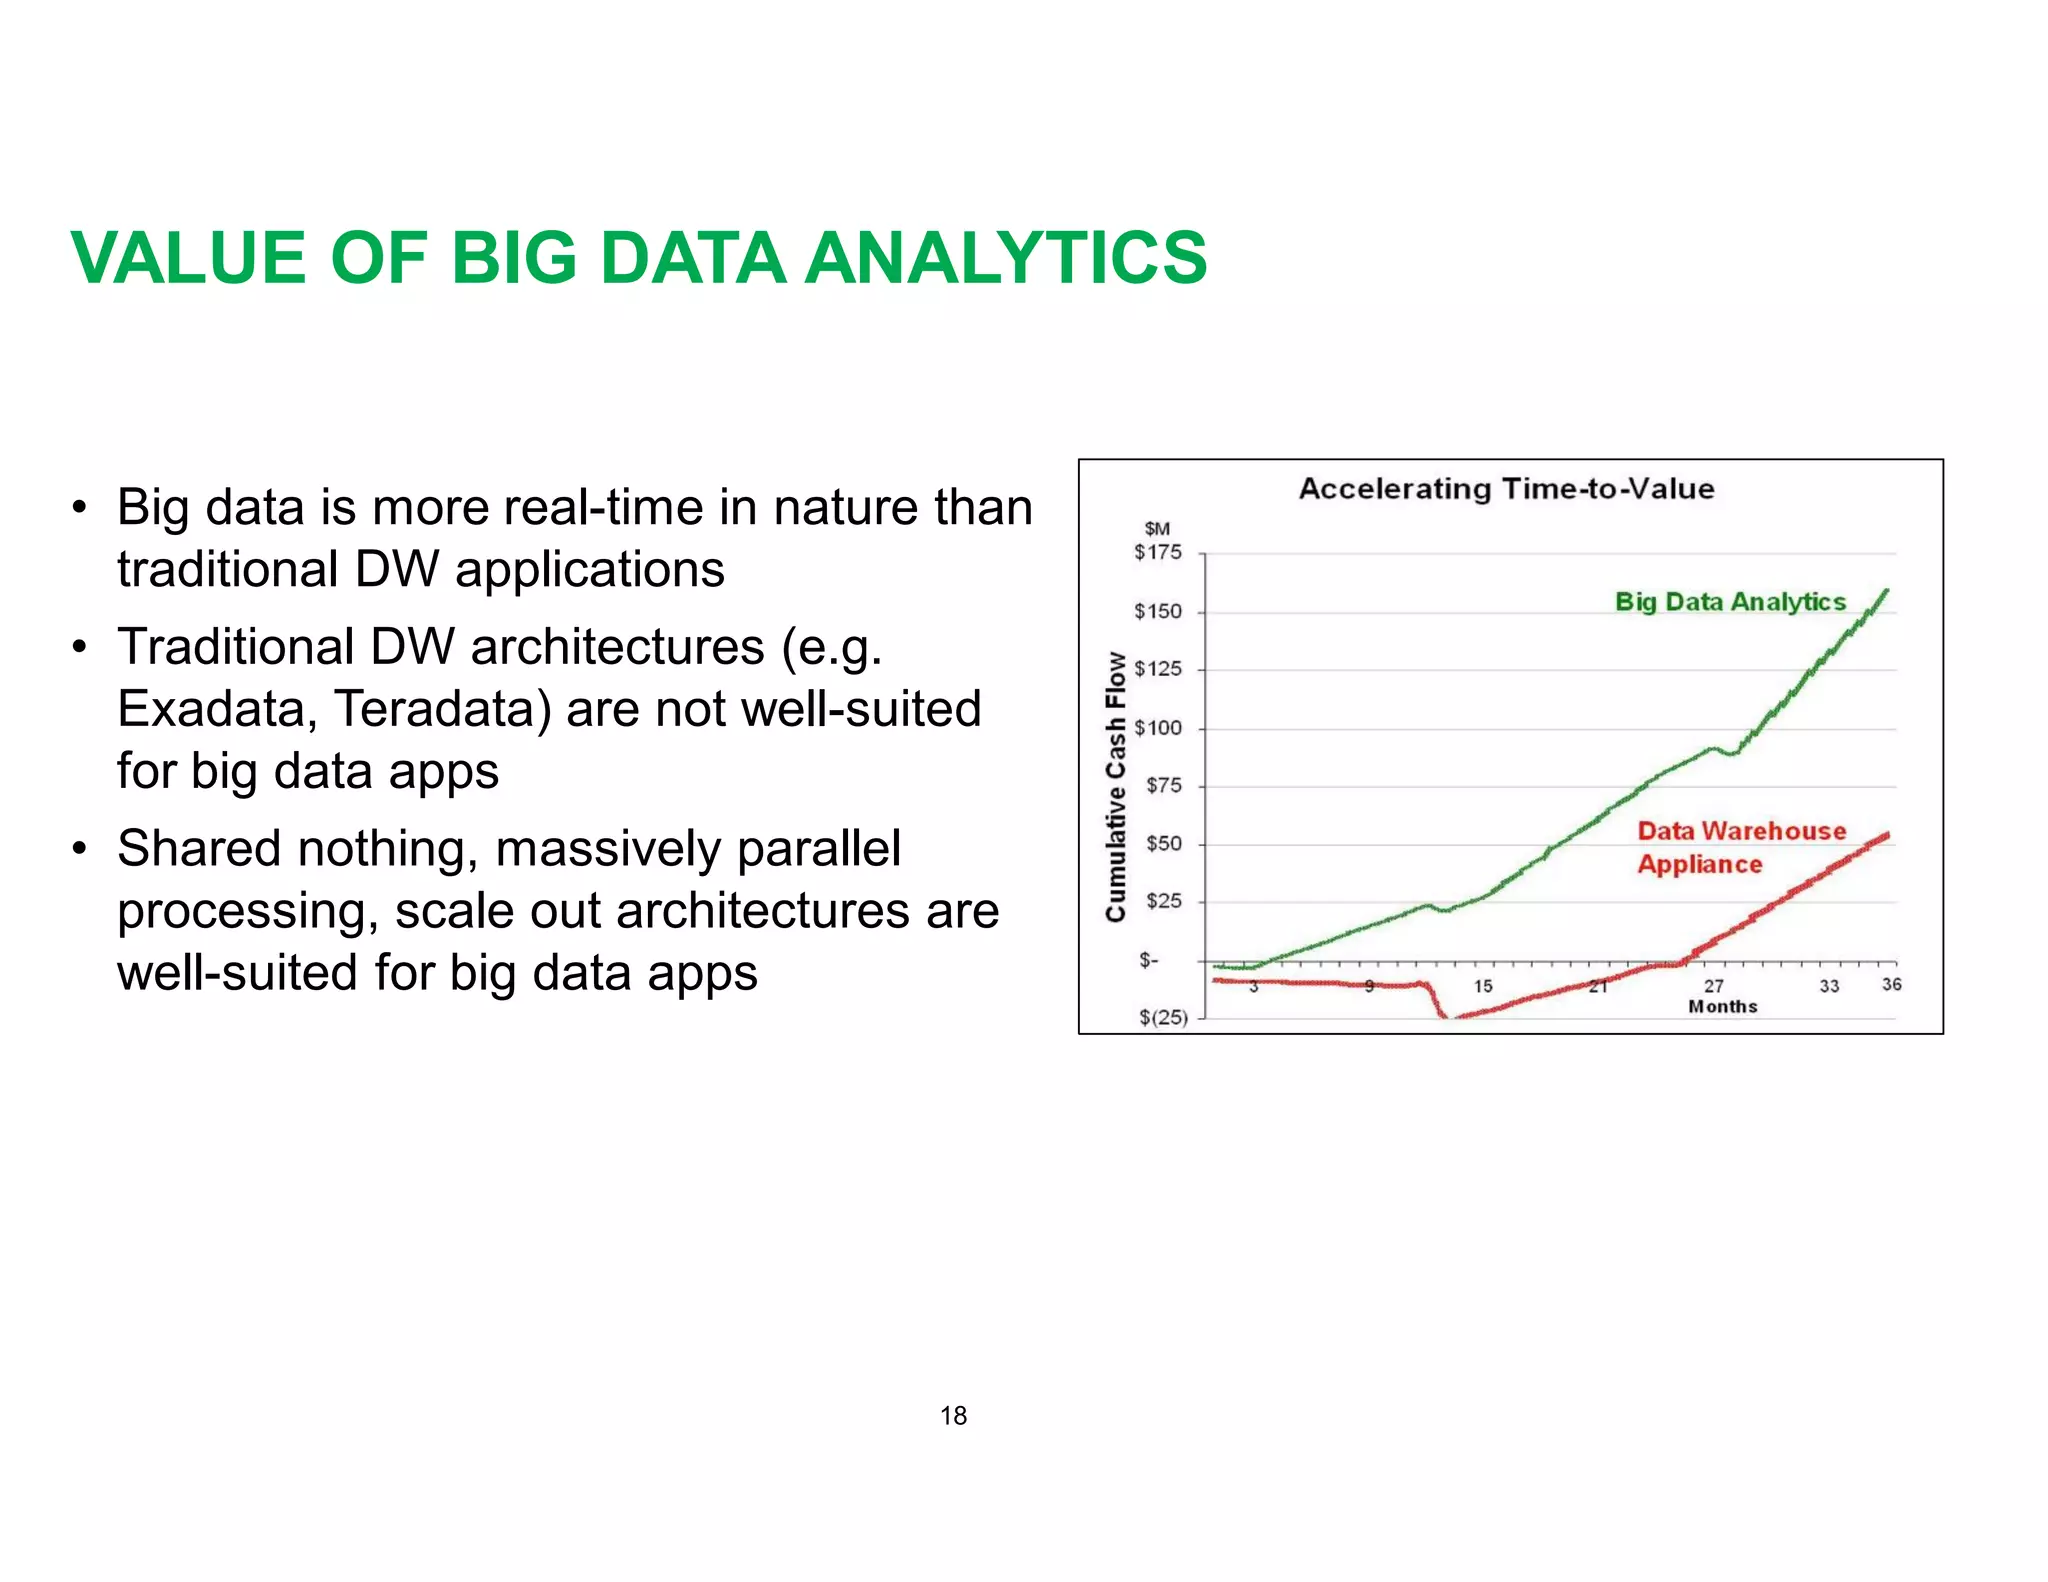
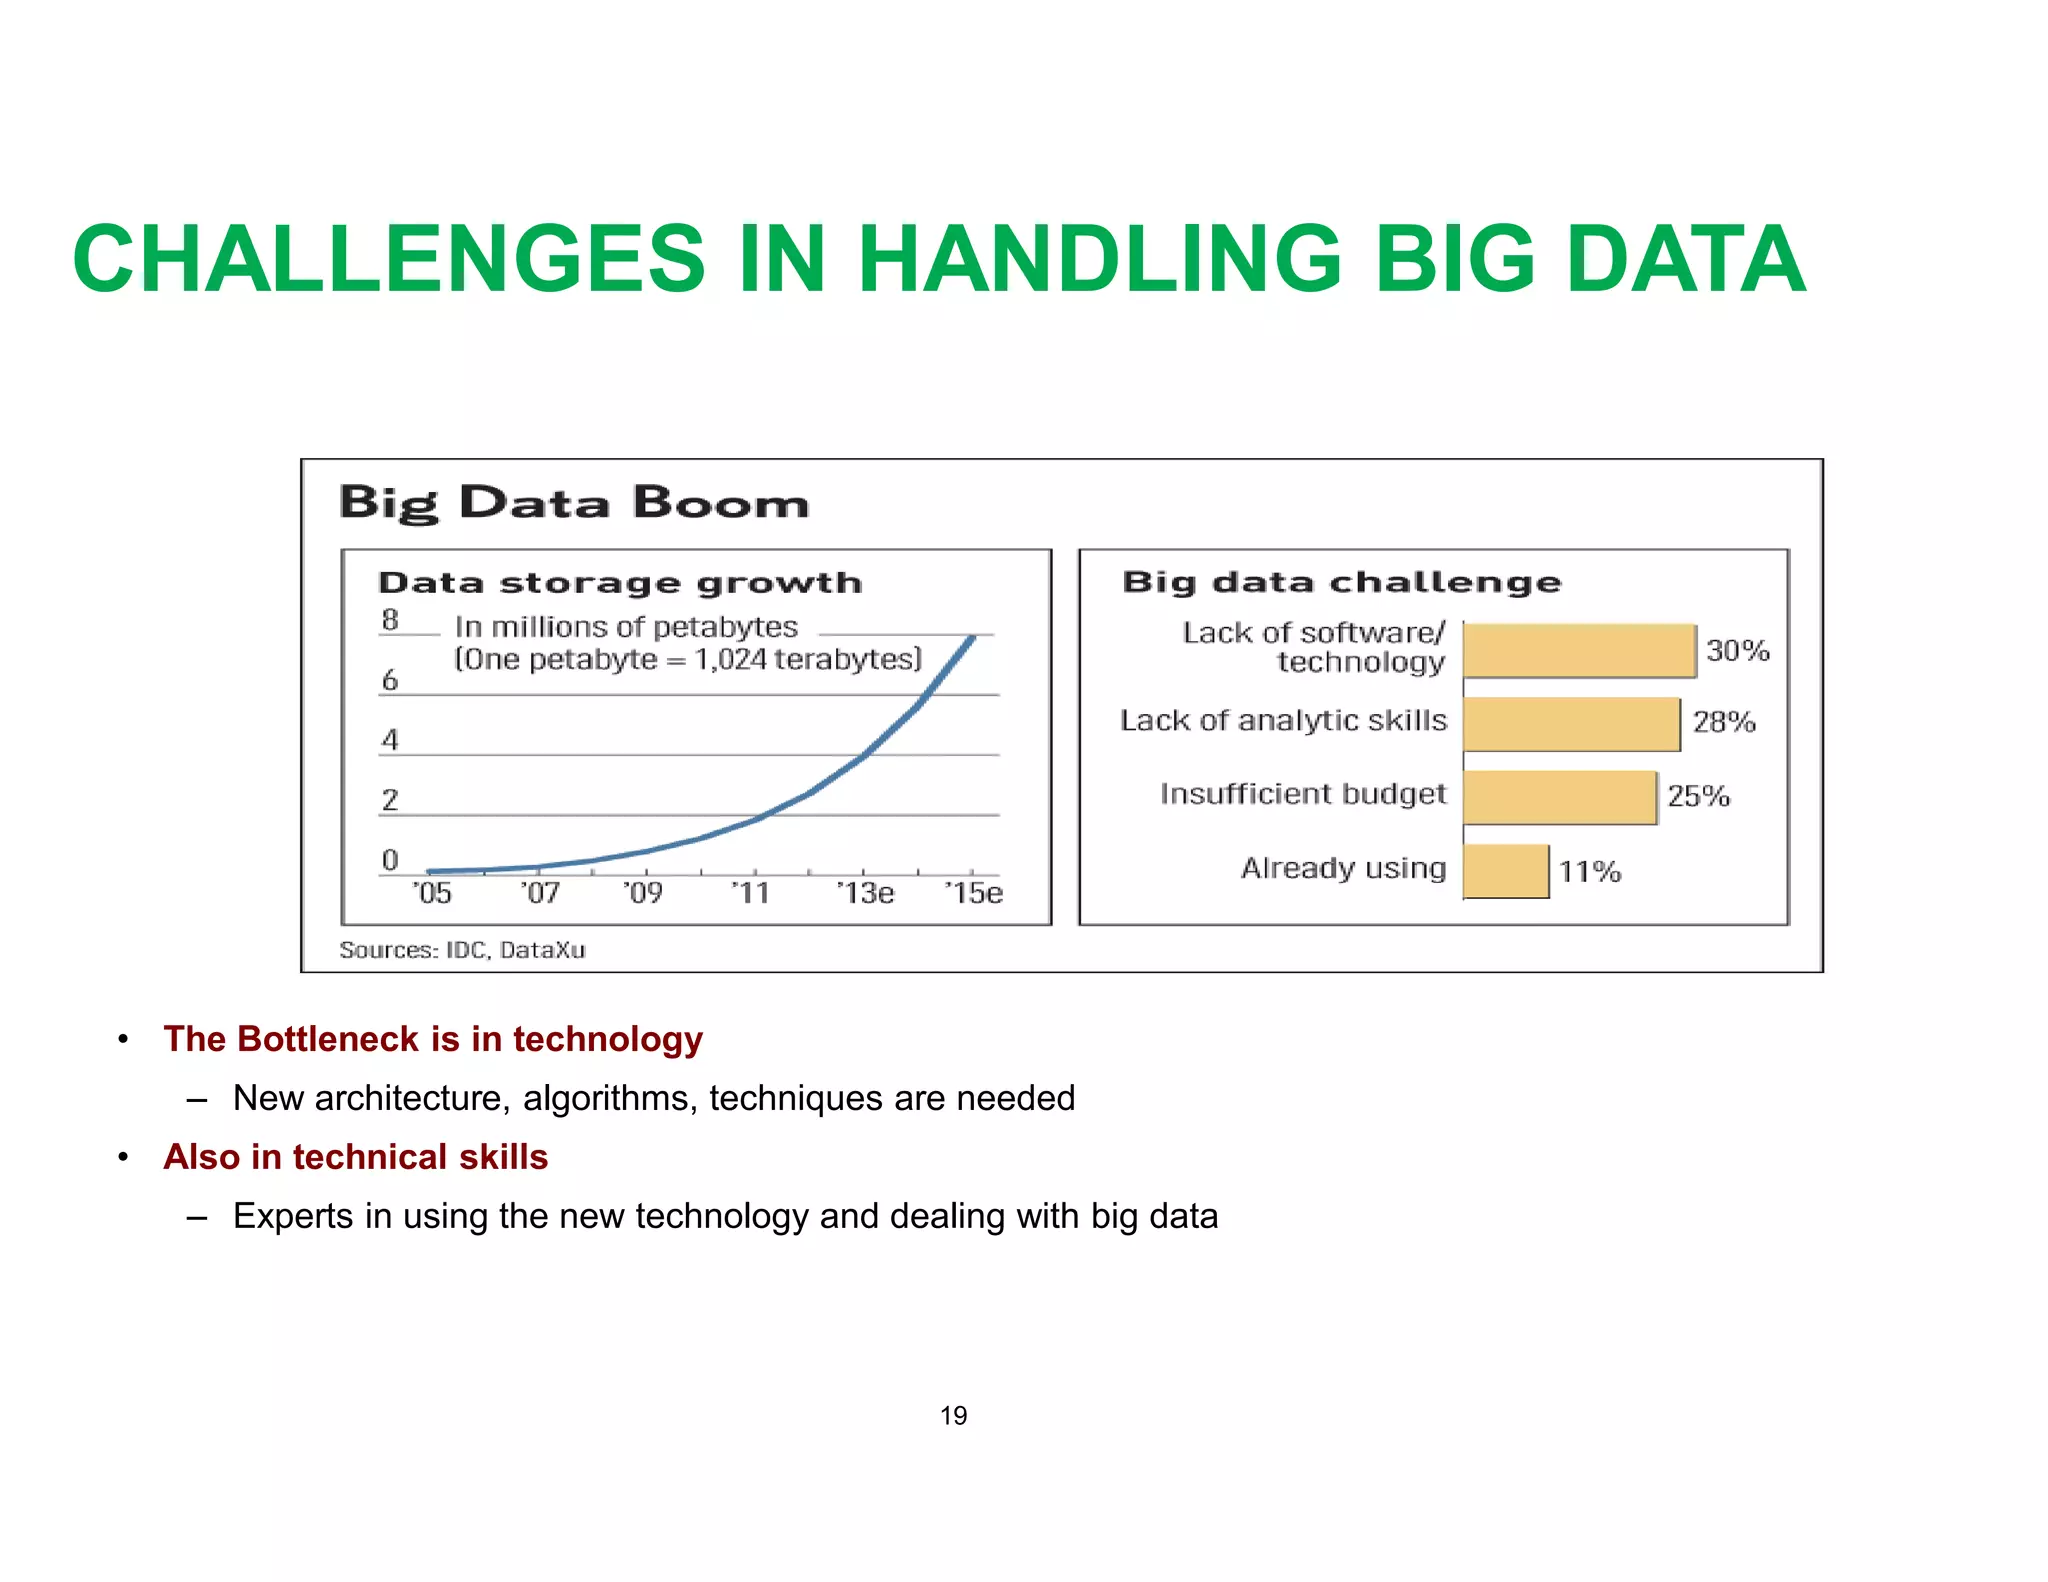
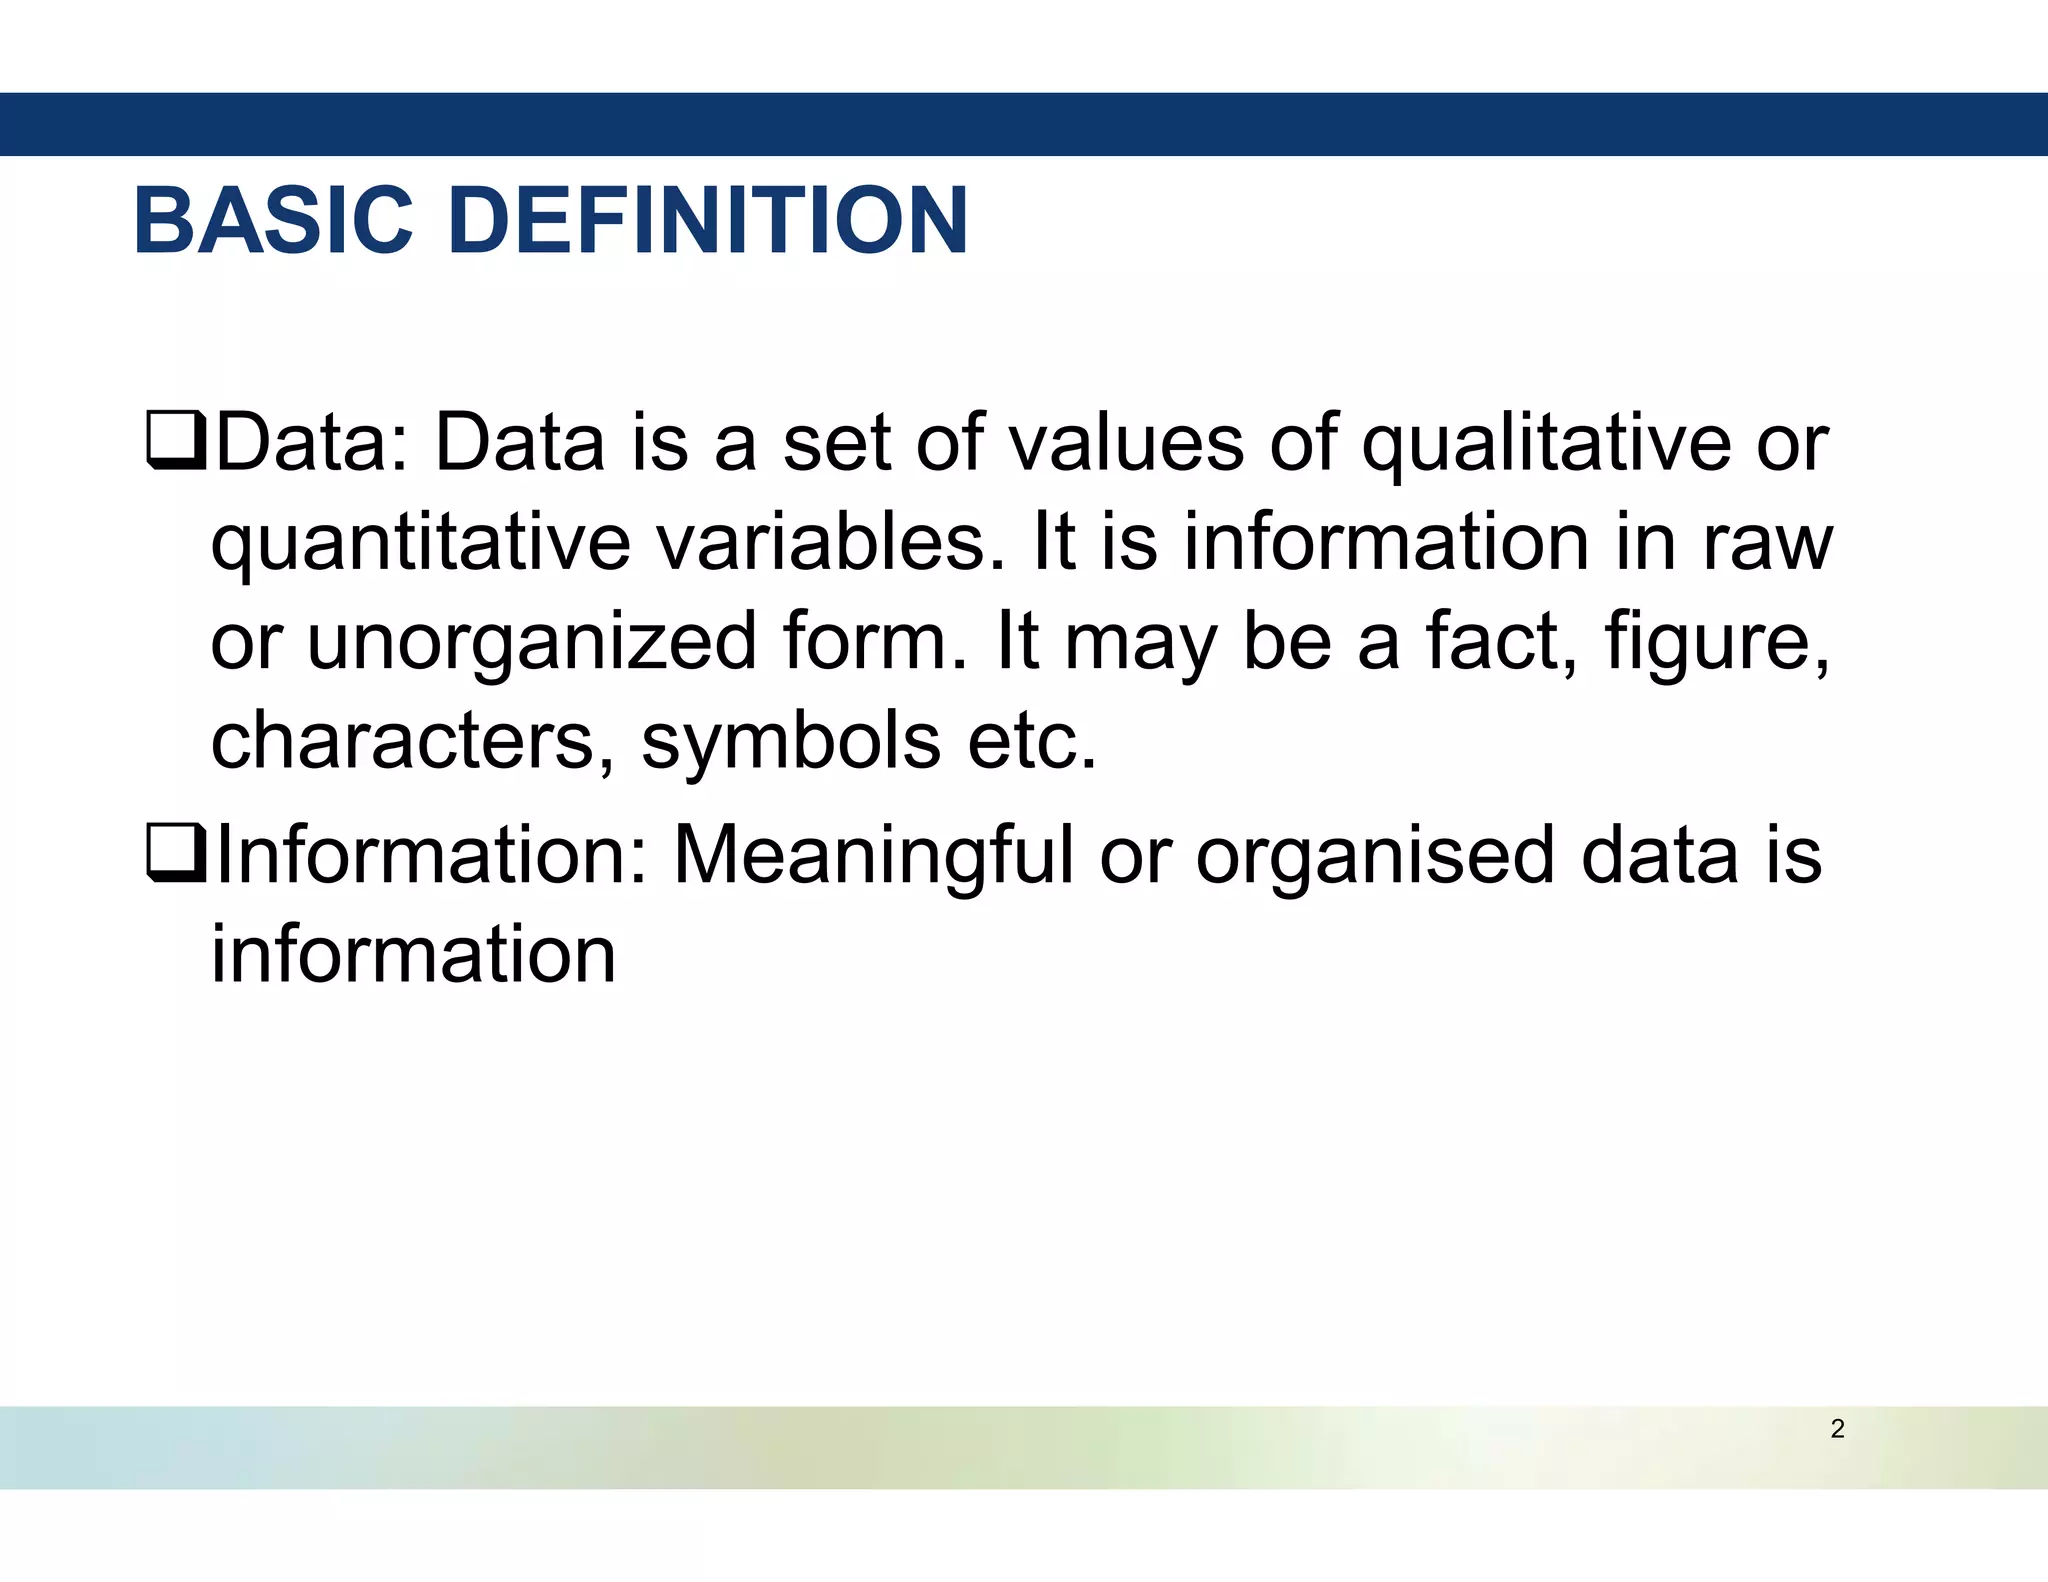
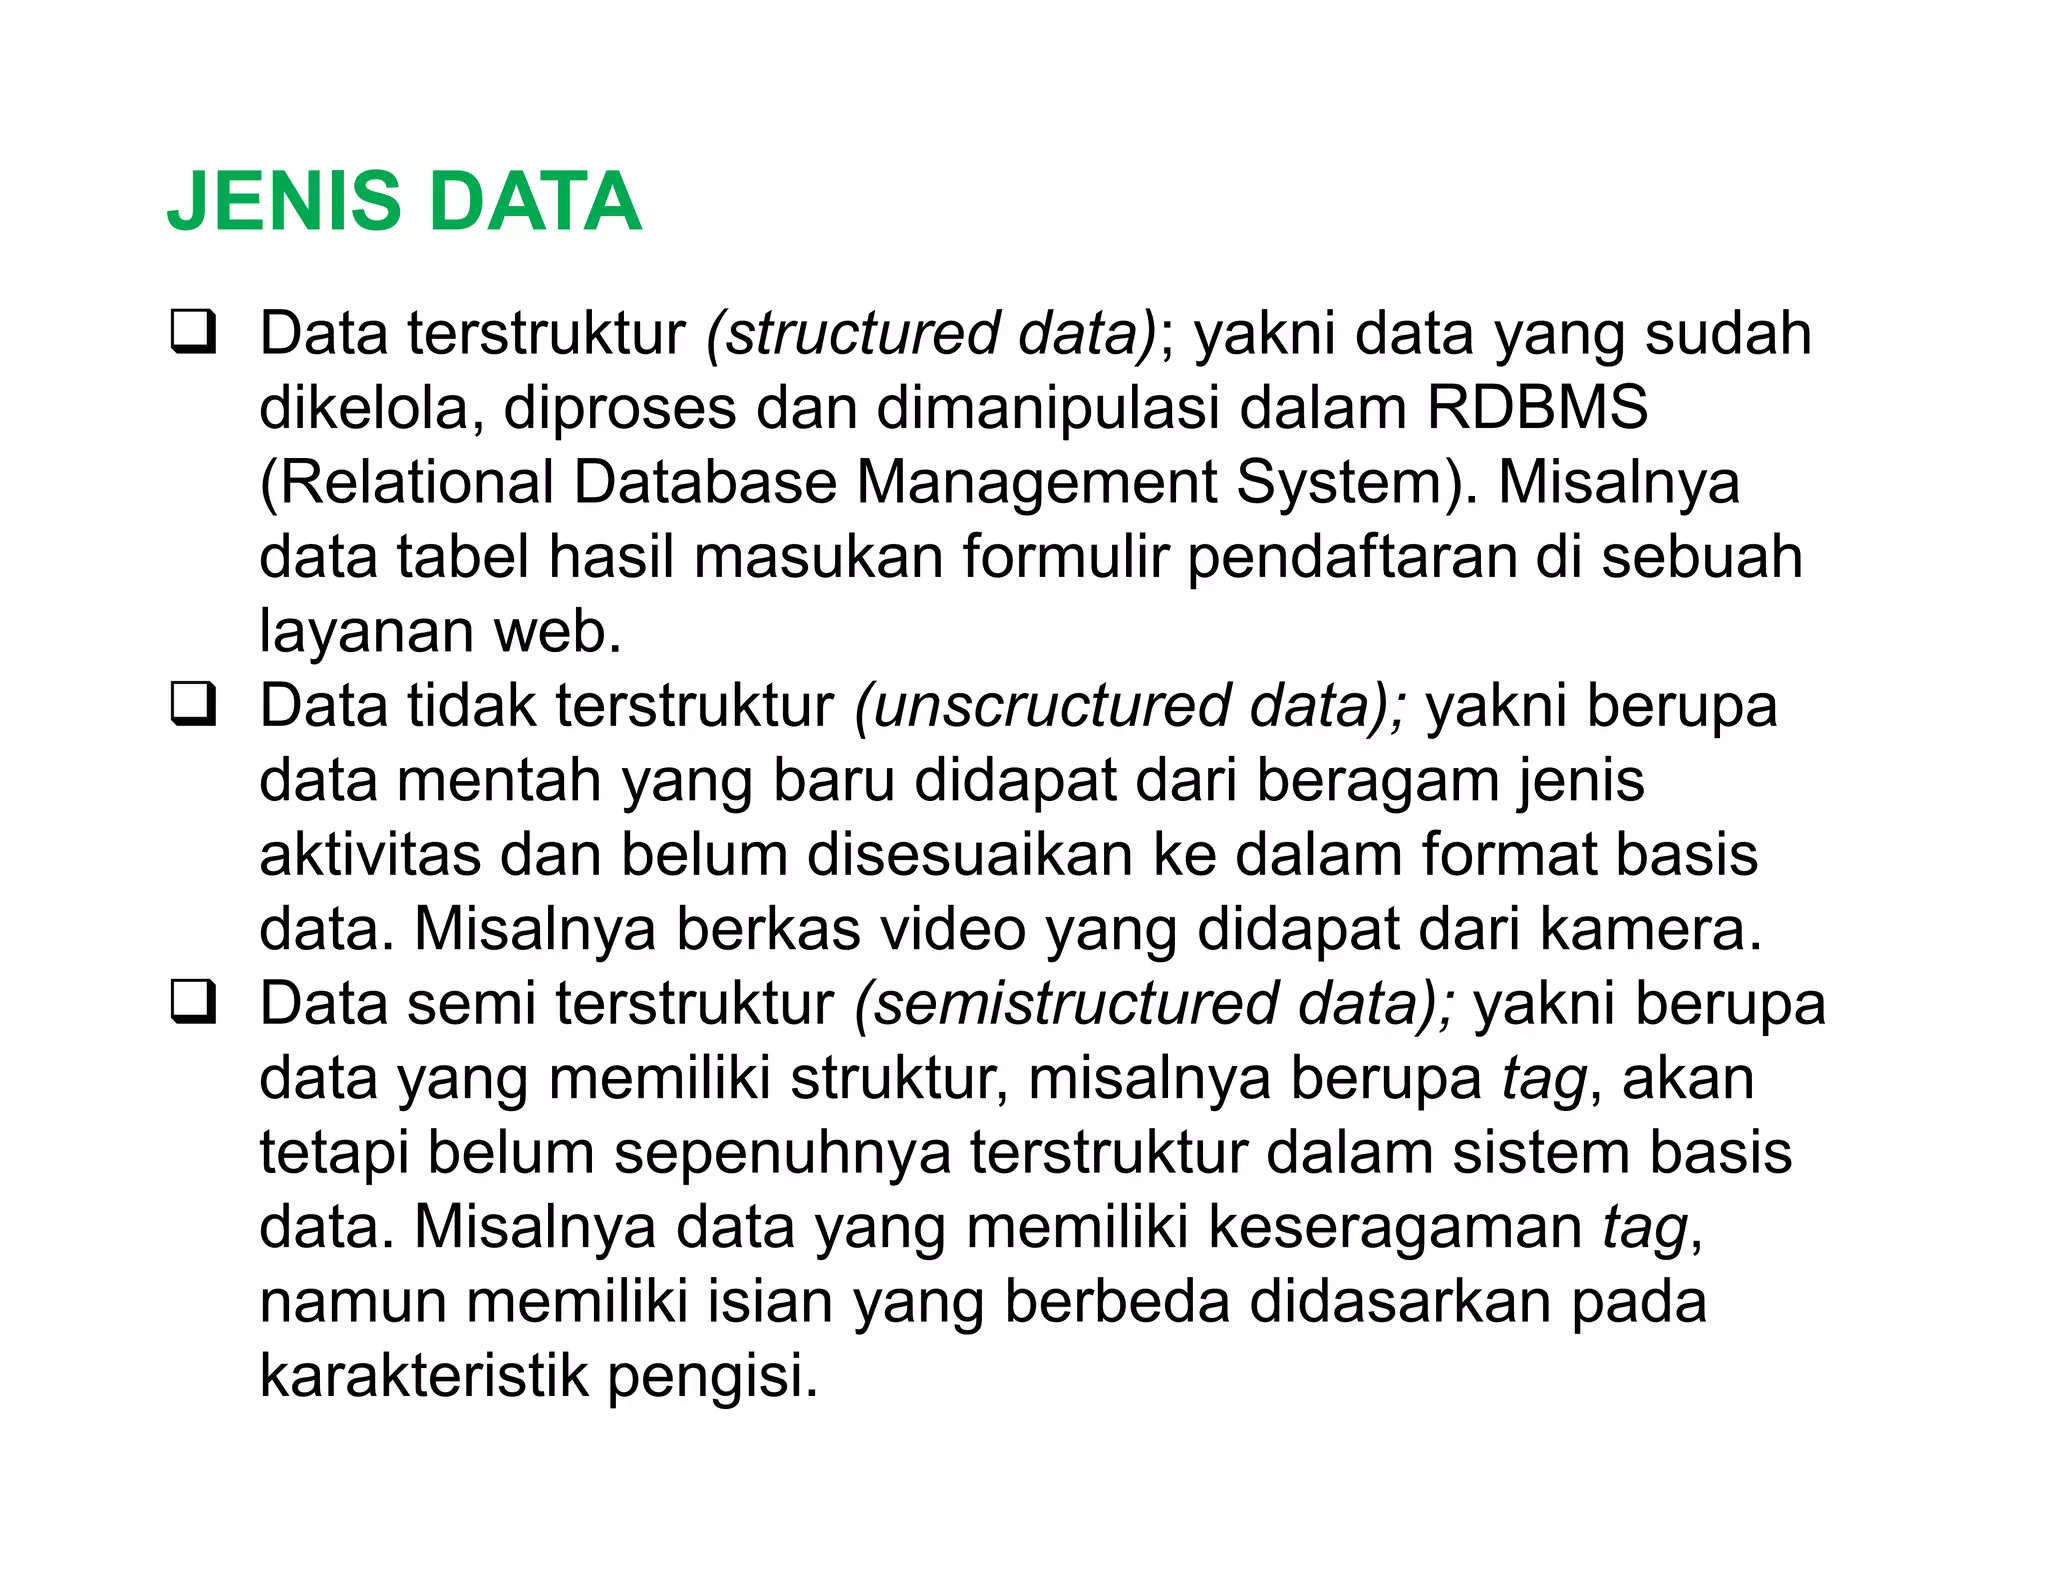
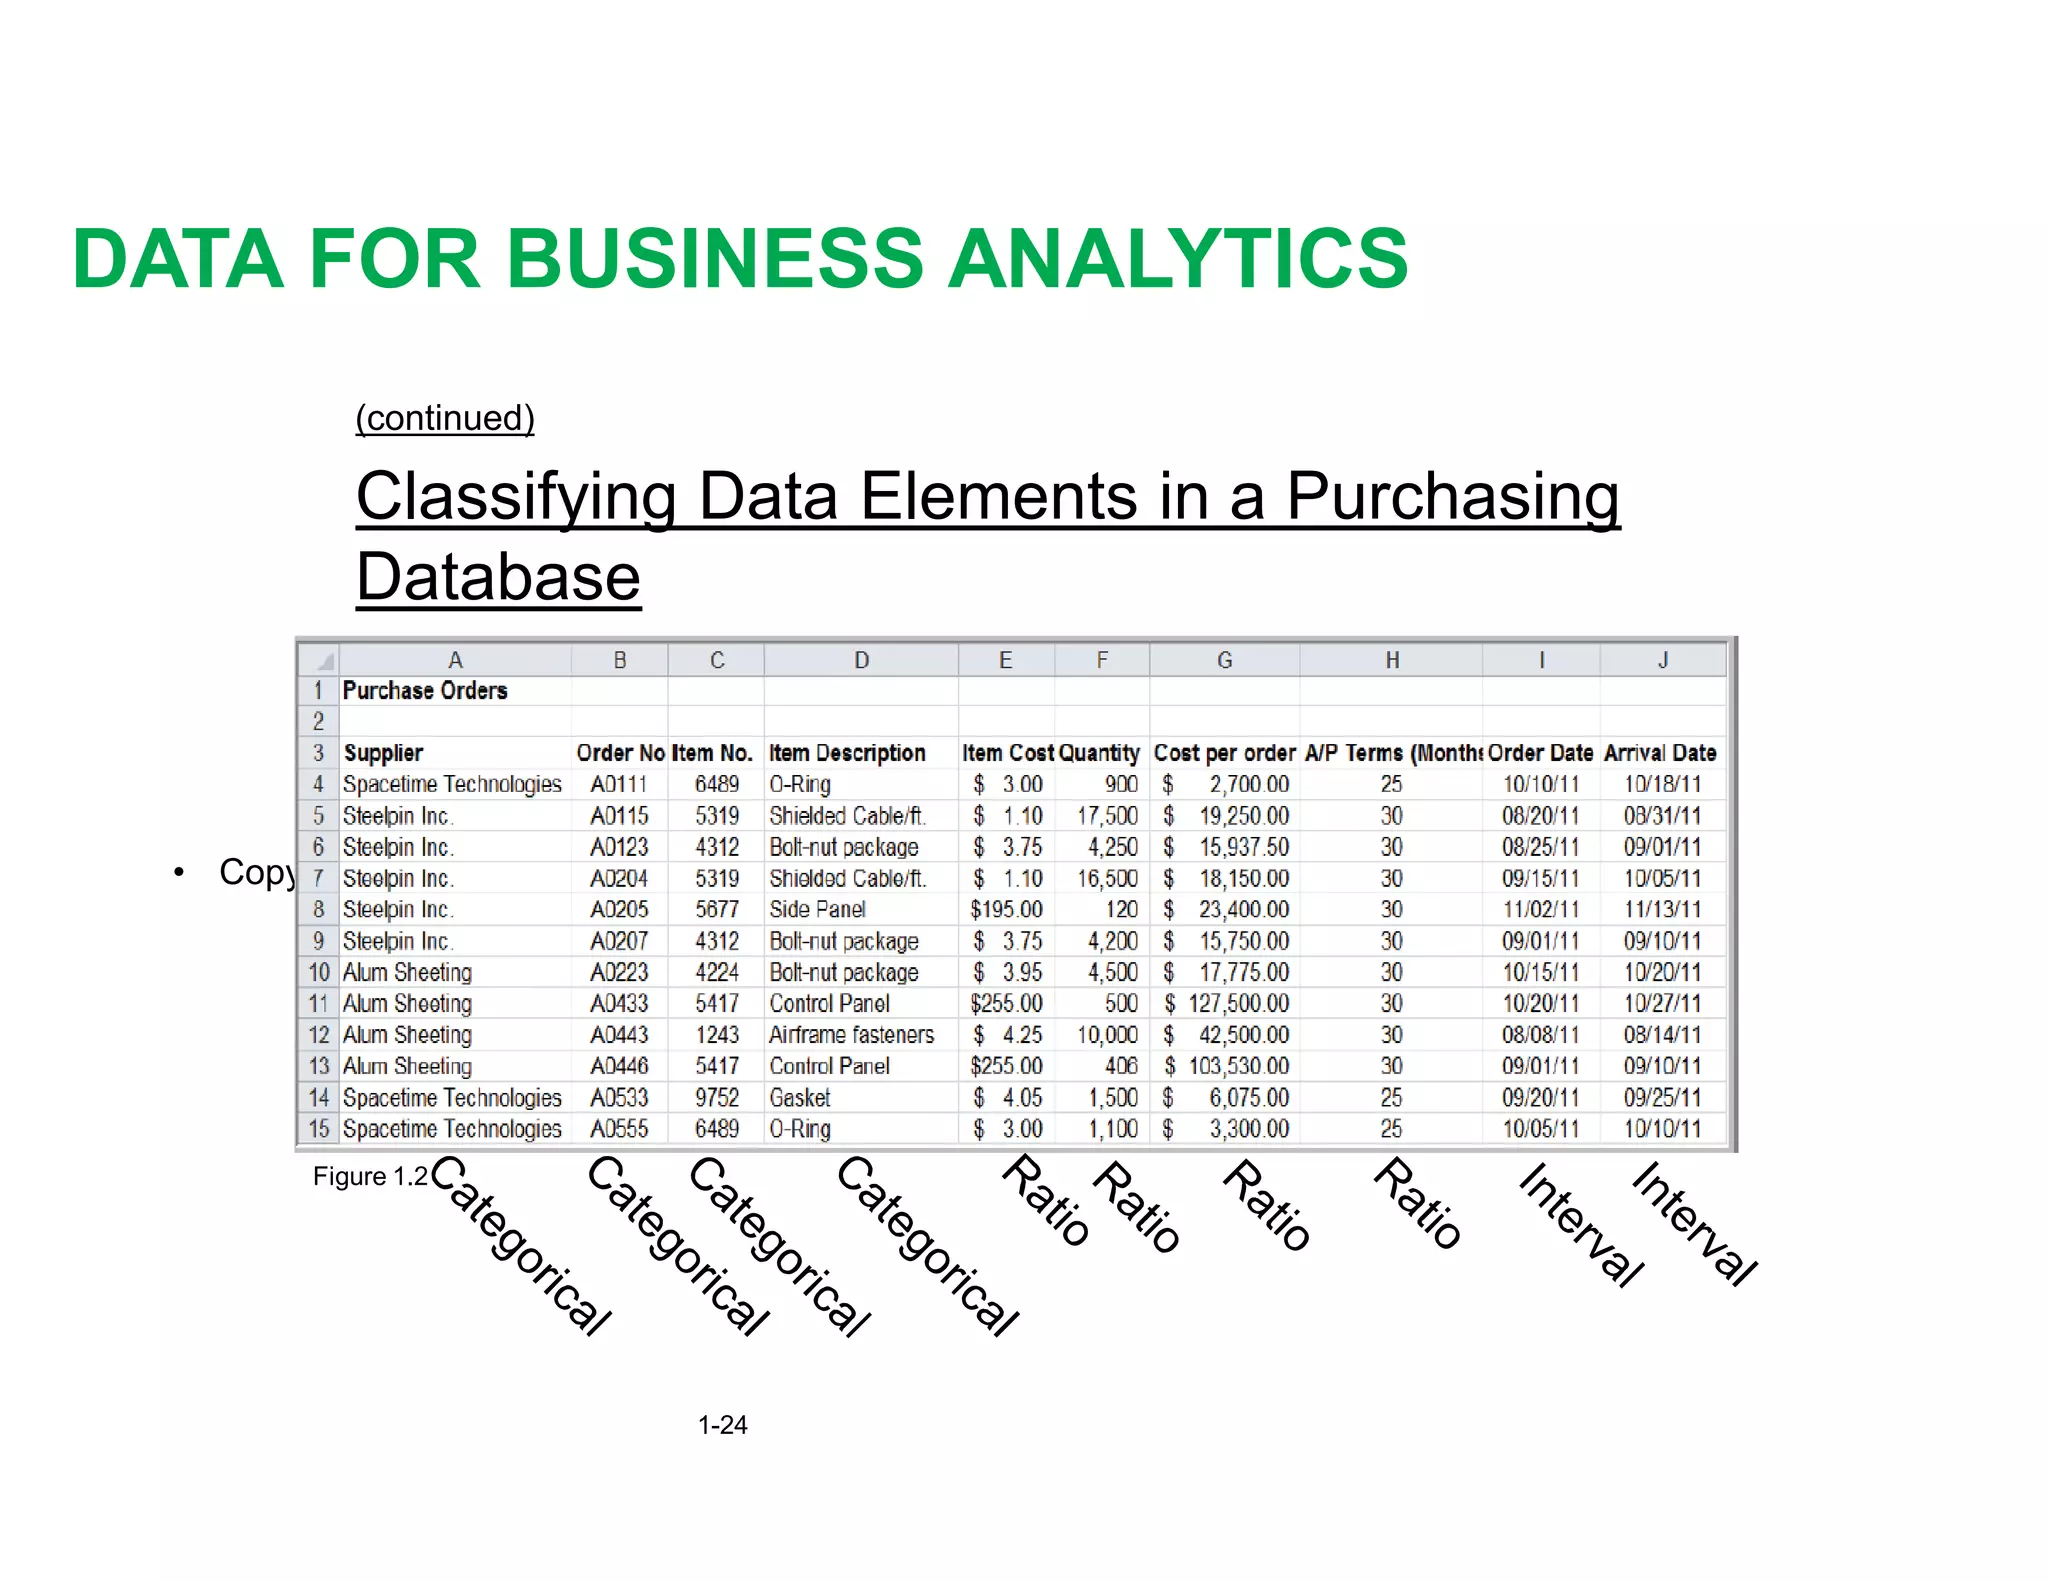
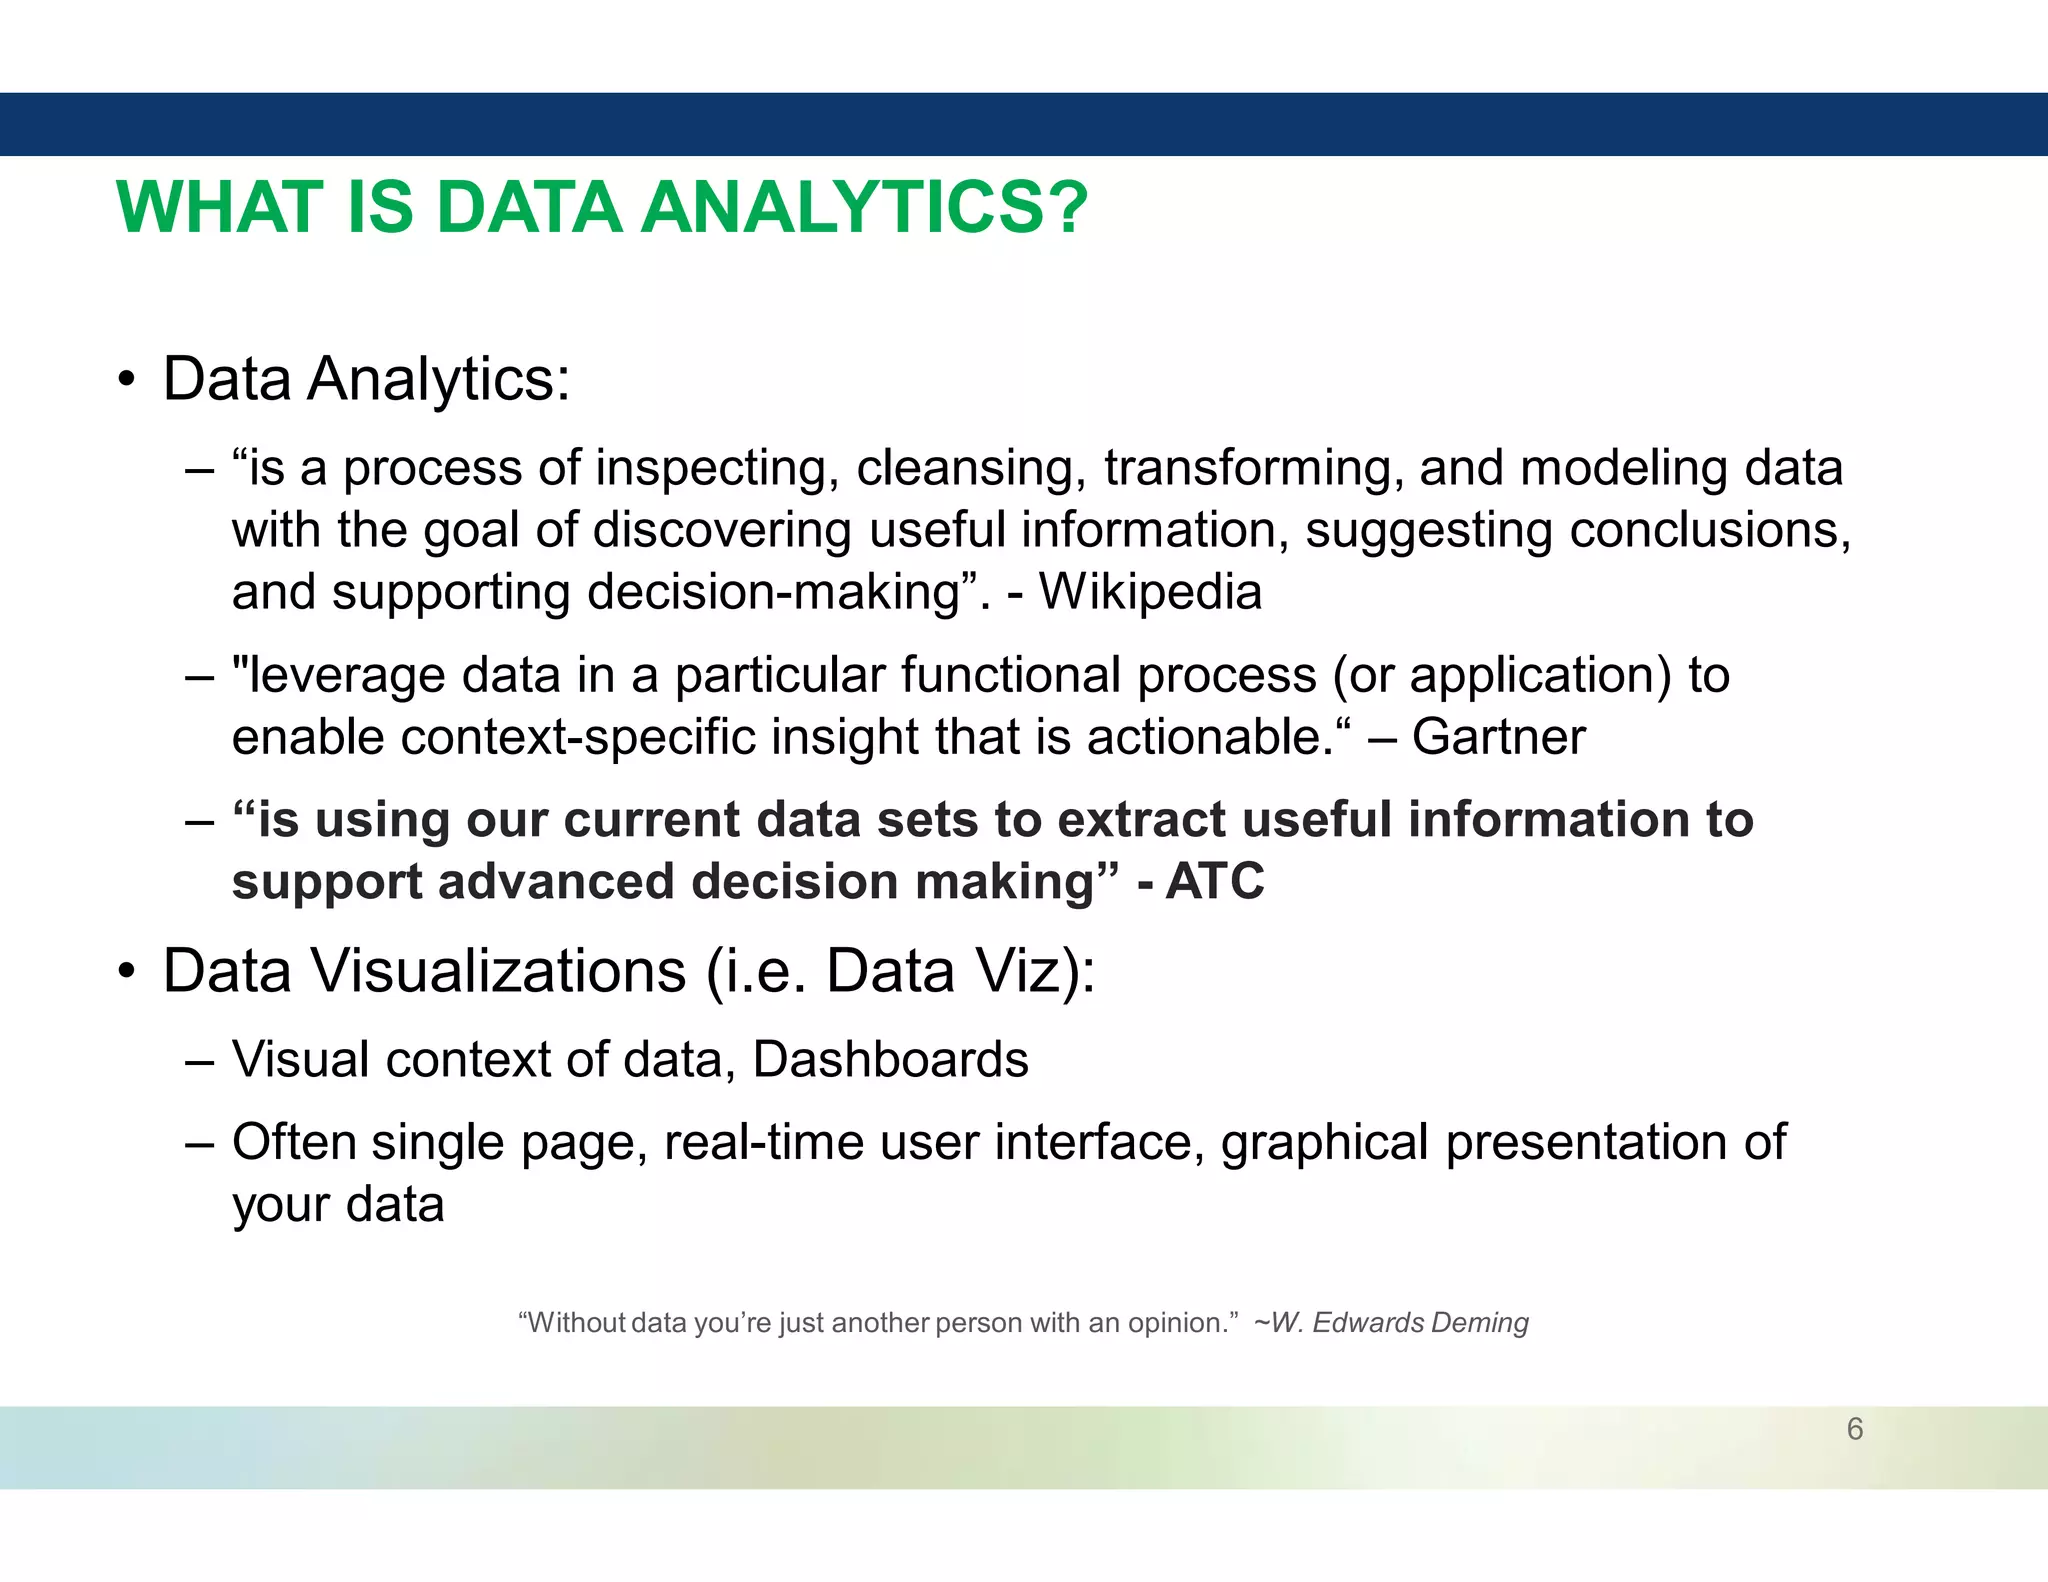
The document provides an overview of a 3-day data analytics training program held in Jakarta, Indonesia from April 24-26, 2019. It discusses topics that will be covered including big data overview, data for business analysis, data analytics concepts, and data analytics tools. The training is led by Dr. Ir. John Sihotang and is aimed at management trainees of the company Sucofindo.
Data Science & AI Road Map by Python & Computer science tutor in MalaysiaAhmed Elmalla
The slides were used in a trial session for a student aiming to learn python to do Data science projects .
The session video can be watched from the link below
https://youtu.be/CwCe1pKOVI8
I have over 20 years of experience in both teaching & in completing computer science projects with certificates from Stanford, Alberta, Pennsylvania, California Irvine universities.
I teach the following subjects:
1) IGCSE A-level 9618 / AS-Level
2) AP Computer Science exam A
3) Python (basics, automating staff, Data Analysis, AI & Flask)
4) Java (using Duke University syllabus)
5) Descriptive statistics using SQL
6) PHP, SQL, MYSQL & Codeigniter framework (using University of Michigan syllabus)
7) Android Apps development using Java
8) C / C++ (using University of Colorado syllabus)
Check Trial Classes:
1) A-Level Trial Class : https://youtu.be/v3k7A0nNb9Q
2) AS level trial Class : https://youtu.be/wj14KpfbaPo
3) 0478 IGCSE class : https://youtu.be/sG7PrqagAes
4) AI & Data Science class: https://youtu.be/CwCe1pKOVI8
https://elmalla.info/blog/68-tutor-profile-slide-share
You can get your trial Class now by booking : https://calendly.com/ahmed-elmalla/30min
And you can contact me on
https://wa.me/0060167074241
by Python & Computer science tutor in Malaysia
What is data mining? The process of analyzing data to discover hidden patterns and relationships that can help you manage and improve your business.
Check out: www.eleaderstochange.com
Follow #eleaders2change
Understanding big data and data analytics big dataSeta Wicaksana
Big Data helps companies to generate valuable insights. Companies use Big Data to refine their marketing campaigns and techniques. Companies use it in machine learning projects to train machines, predictive modeling, and other advanced analytics applications.
The growth in the use of technology has led organizations to generate data for which they need Data Analytics to analyze the data to make business decisions.
The presentation includes the following topics:
- Introduction to Data Analytics
- Data Analytics Process
- Data Analytics Skills
- Certifications Information for Data Analytics
DST Consulting menyelenggarakan pelatihan publik:
1) Pelatihan Corporate University Development and Implementation (2 hari)
2) Pelatihan ToT sertfikasi BNSP (2 hari belajar + 1 hari Ujian)
3) Pelatihan Professional Secretary (2 hari)
Silahkan daftar bagi yang berminat ke Junita (081281695648) atau email ke info@digital-corpu.com.
Informasi lengkap bisa di lihat di https://digital-corpu.com
Hampir semua instansi baik yang berorientasi bisnis maupun non-bisnis, menyadari bahwa melakukan investasi di bidang modal manusia (human capital) dan aset pengetahuan merupakan kunci sukses organisasi dalam menghadapi perkembangan lingkungan yang terus berubah. Namun, tak dapat dipungkiri masih banyak organisasi/perusahaan yang melakukan pengembangan modal manusia dan aset pengetahuan mereka secara parsial dan bersifat reaktif, sehingga masih kurang efektif dalam mendukung strategi organisasi dalam mencapai visi, misi dan tujuannya.
Pada tahun 1950, Corporate University mulai dibentuk untuk membantu organisasi dalam menghubungkan (lingkage) dan menselaraskan (alignment) program-program pembelajaran dengan visi, misi dan sasaran strategis organisasi.
Meskipun industri Corporate University belum sepenuhnya sepakat mengenai definisi Corporate University yang sudah diterima secara universal, namun berbagai tingkat strategi dan nilai yang dikembangkan oleh industri Corporate University tampaknya secara umum memiiki disain CU yang bersifat jangka panjang. Tujuan utama CU, diantaranya adalah untuk membangun kompetensi inti oranisasi, mendorong perubahan organisasi, mempertahankan daya saing perusahaan, merekrut dan mempertahankan talent, atau pelayanan pelanggan. Sebagian besar CU didirikan atas praktik bisnis strategis dan kesadaran sendiri akan tanggung jawab mereka untuk berkontribusi terhadap pertumbuhan organisasi dan/atau efektifitasnya. CU adalah strategis karena direncanakan dan dimodelkan untuk memenuhi misi organisasi. CU berorientasi pada hasil (result oriented) dan akan tetap ada selama dapat memberikan nilai (value) kepada organisasi/perusahaan.
Teknologi dan layanan IPTV di Indonesia relatif masih baru, bahkan PT Telekomunikasi Indonesia sebagai pionir layanan telekomunikasi baru mengimplementasikan IPTV pada awal tahun 2011. Presentasi inio akan memberikan wawasan tentang implementasi IPTV. (Oleh John Sihotang)
Cloud computing atau komputasi awan adalah suatu model atau generasi penyediaan layanan komputing baru yang diberikan penyedia layanan IT kepada pelanggannya. Dimana dengan layanan cloud akan mampu menyediakan layanan IT dimana yang lebih cepat, fleksibel dan ekonomis.
Chatty Kathy - UNC Bootcamp Final Project Presentation - Final Version - 5.23...John Andrews
SlideShare Description for "Chatty Kathy - UNC Bootcamp Final Project Presentation"
Title: Chatty Kathy: Enhancing Physical Activity Among Older Adults
Description:
Discover how Chatty Kathy, an innovative project developed at the UNC Bootcamp, aims to tackle the challenge of low physical activity among older adults. Our AI-driven solution uses peer interaction to boost and sustain exercise levels, significantly improving health outcomes. This presentation covers our problem statement, the rationale behind Chatty Kathy, synthetic data and persona creation, model performance metrics, a visual demonstration of the project, and potential future developments. Join us for an insightful Q&A session to explore the potential of this groundbreaking project.
Project Team: Jay Requarth, Jana Avery, John Andrews, Dr. Dick Davis II, Nee Buntoum, Nam Yeongjin & Mat Nicholas
Opendatabay - Open Data Marketplace.pptxOpendatabay
Opendatabay.com unlocks the power of data for everyone. Open Data Marketplace fosters a collaborative hub for data enthusiasts to explore, share, and contribute to a vast collection of datasets.
First ever open hub for data enthusiasts to collaborate and innovate. A platform to explore, share, and contribute to a vast collection of datasets. Through robust quality control and innovative technologies like blockchain verification, opendatabay ensures the authenticity and reliability of datasets, empowering users to make data-driven decisions with confidence. Leverage cutting-edge AI technologies to enhance the data exploration, analysis, and discovery experience.
From intelligent search and recommendations to automated data productisation and quotation, Opendatabay AI-driven features streamline the data workflow. Finding the data you need shouldn't be a complex. Opendatabay simplifies the data acquisition process with an intuitive interface and robust search tools. Effortlessly explore, discover, and access the data you need, allowing you to focus on extracting valuable insights. Opendatabay breaks new ground with a dedicated, AI-generated, synthetic datasets.
Leverage these privacy-preserving datasets for training and testing AI models without compromising sensitive information. Opendatabay prioritizes transparency by providing detailed metadata, provenance information, and usage guidelines for each dataset, ensuring users have a comprehensive understanding of the data they're working with. By leveraging a powerful combination of distributed ledger technology and rigorous third-party audits Opendatabay ensures the authenticity and reliability of every dataset. Security is at the core of Opendatabay. Marketplace implements stringent security measures, including encryption, access controls, and regular vulnerability assessments, to safeguard your data and protect your privacy.
Explore our comprehensive data analysis project presentation on predicting product ad campaign performance. Learn how data-driven insights can optimize your marketing strategies and enhance campaign effectiveness. Perfect for professionals and students looking to understand the power of data analysis in advertising. for more details visit: https://bostoninstituteofanalytics.org/data-science-and-artificial-intelligence/
Levelwise PageRank with Loop-Based Dead End Handling Strategy : SHORT REPORT ...Subhajit Sahu
Abstract — Levelwise PageRank is an alternative method of PageRank computation which decomposes the input graph into a directed acyclic block-graph of strongly connected components, and processes them in topological order, one level at a time. This enables calculation for ranks in a distributed fashion without per-iteration communication, unlike the standard method where all vertices are processed in each iteration. It however comes with a precondition of the absence of dead ends in the input graph. Here, the native non-distributed performance of Levelwise PageRank was compared against Monolithic PageRank on a CPU as well as a GPU. To ensure a fair comparison, Monolithic PageRank was also performed on a graph where vertices were split by components. Results indicate that Levelwise PageRank is about as fast as Monolithic PageRank on the CPU, but quite a bit slower on the GPU. Slowdown on the GPU is likely caused by a large submission of small workloads, and expected to be non-issue when the computation is performed on massive graphs.
6. THEME OF THIS COURSE
Large-Scale Data Management
Big Data Analytics
Data Science and Analytics
• How to manage very large amounts of data and extract value and
knowledge from them
6
8. BIG DATA DEFINITION
• No single standard definition…
“Big Data” is data whose scale, diversity, and
complexity require new architecture, techniques,
algorithms, and analytics to manage it and extract
value and hidden knowledge from it…
8
9. CHARACTERISTICS OF BIG DATA:
1-SCALE (VOLUME)
• Data Volume
– 44x increase from 2009 2020
– From 0.8 zettabytes to 35zb
• Data volume is increasing exponentially
9
Exponential increase in
collected/generated data
10. CHARACTERISTICS OF BIG DATA:
2-COMPLEXITY (VARITY)
• Various formats, types, and structures
• Text, numerical, images, audio, video,
sequences, time series, social media data,
multi-dim arrays, etc…
• Static data vs. streaming data
• A single application can be generating/collecting
many types of data
10
To extract knowledgeè all these types of
data need to linked together
11. CHARACTERISTICS OF BIG DATA:
3-SPEED (VELOCITY)
• Data is begin generated fast and need to be processed fast
• Online Data Analytics
• Late decisions è missing opportunities
• Examples
– E-Promotions: Based on your current location, your purchase
history, what you like è send promotions right now for store next to
you
– Healthcare monitoring: sensors monitoring your activities and
body è any abnormal measurements require immediate reaction
11
14. HARNESSING BIG DATA
• OLTP: Online Transaction Processing (DBMSs)
• OLAP: Online Analytical Processing (Data Warehousing)
• RTAP: Real-Time Analytics Processing (Big Data Architecture & technology)
14
15. WHO’S GENERATING BIG DATA
Social media and networks
(all of us are generating data)
Scientific instruments
(collecting all sorts of data)
Mobile devices
(tracking all objects all the time)
Sensor technology and networks
(measuring all kinds of data)
• The progress and innovation is no longer hindered by the ability to collect data
• But, by the ability to manage, analyze, summarize, visualize, and discover knowledge from the collected data
in a timely manner and in a scalable fashion
15
16. THE MODEL HAS CHANGED…
• The Model of Generating/Consuming Data has Changed
Old Model: Few companies are generating data, all others are consuming data
New Model: all of us are generating data, and all of us are consuming data
16
17. WHAT’S DRIVING BIG DATA
- Ad-hoc querying and reporting
- Data mining techniques
- Structured data, typical sources
- Small to mid-size datasets
- Optimizations and predictive analytics
- Complex statistical analysis
- All types of data, and many sources
- Very large datasets
- More of a real-time
17
18. VALUE OF BIG DATA ANALYTICS
• Big data is more real-time in nature than
traditional DW applications
• Traditional DW architectures (e.g.
Exadata, Teradata) are not well-suited
for big data apps
• Shared nothing, massively parallel
processing, scale out architectures are
well-suited for big data apps
18
19. CHALLENGES IN HANDLING BIG DATA
• The Bottleneck is in technology
– New architecture, algorithms, techniques are needed
• Also in technical skills
– Experts in using the new technology and dealing with big data
19
21. 2
BASIC DEFINITION
qData: Data is a set of values of qualitative or
quantitative variables. It is information in raw
or unorganized form. It may be a fact, figure,
characters, symbols etc.
qInformation: Meaningful or organised data is
information
22. q Data terstruktur (structured data); yakni data yang sudah
dikelola, diproses dan dimanipulasi dalam RDBMS
(Relational Database Management System). Misalnya
data tabel hasil masukan formulir pendaftaran di sebuah
layanan web.
q Data tidak terstruktur (unscructured data); yakni berupa
data mentah yang baru didapat dari beragam jenis
aktivitas dan belum disesuaikan ke dalam format basis
data. Misalnya berkas video yang didapat dari kamera.
q Data semi terstruktur (semistructured data); yakni berupa
data yang memiliki struktur, misalnya berupa tag, akan
tetapi belum sepenuhnya terstruktur dalam sistem basis
data. Misalnya data yang memiliki keseragaman tag,
namun memiliki isian yang berbeda didasarkan pada
karakteristik pengisi.
JENIS DATA
23. TYPE OF DATA
Data types are an important concept because statistical methods can only be
used with certain data types. You have to analyze continuous data differently
than categorical data otherwise it would result in a wrong analysis. Therefore
knowing the types of data you are dealing with, enables you to choose the
correct method of analysis.
25. • Nominal or categorical data is data that comprises of categories that
cannot be rank ordered – each category is just different.
• The categories available cannot be placed in any order and no
judgement can be made about the relative size or distance from one
category to another.
Ø Categories bear no quantitative relationship to one another
Ø Examples:
ü customer’s location (America, Europe, Asia)
ü employee classification (manager, supervisor, associate)
• What does this mean? No mathematical operations can be performed
on the data relative to each other.
• Therefore, nominal data reflect qualitative differences rather than
quantitative ones.
Categorical (Nominal) data
26. Examples:
Nominal data
What is your gender? (please tick)
Male
Female
Did you enjoy the film? (please tick)
Yes
No
Nominal values represent
discrete units and are used to
label variables, that have no
quantitative value. Just think of
them as „labels“. Note that
nominal data that has no order.
Therefore if you would change
the order of its values, the
meaning would not change. You
can see two examples of
nominal features below:
27. q Systems for measuring nominal data must
ensure that each category is mutually
exclusive and the system of measurement
needs to be exhaustive.
q Variables that have only two responses
i.e. Yes or No, are known as
dichotomies.
Nominal data
28. Nominal data
When you are dealing with nominal data, you collect information through:
1. Frequencies: The Frequency is the rate at which something occurs over a
period of time or within a dataset.
2. Proportion: You can easily calculate the proportion by dividing the frequency
by the total number of events. (e.g how often something happened divided by
how often it could happen)
3. Percentage.
4. Visualization Methods: To visualize nominal data you can use a pie chart or a
bar chart.
29. § Ordinal data is data that comprises of categories that can
be rank ordered.
§ Similarly with nominal data the distance between each
category cannot be calculated but the categories can be
ranked above or below each other.
Ø No fixed units of measurement
Ø Examples:
ü college football rankings
ü survey responses (poor, average, good, very
good, excellent)
§ What does this mean? Can make statistical judgements and
perform limited maths.
Ordinal data
30. Example:
Ordinal data
How satisfied are you with the level of service you have
received? (please tick)
Very satisfied
Somewhat satisfied
Neutral
Somewhat dissatisfied
Very dissatisfied
31. Ordinal data
q When you are dealing with ordinal data, you can
use the same methods like with nominal data, but
you also have access to some additional tools.
q Therefore you can summarize your ordinal data
with frequencies, proportions, percentages.
q And you can visualize it with pie and bar charts.
Additionally, you can use percentiles, median,
mode and the interquartile range to summarize
your data.
q in Data Science, you can use one label encoding,
to transform ordinal data into a numeric feature.
32. q Both interval and ratio data are examples of scale data.
q Scale data:
• data is in numeric format ($50, $100, $150)
• data that can be measured on a continuous scale
• the distance between each can be observed and as a
result measured
• the data can be placed in rank order.
Interval and ratio data
33. Ø Ordinal data but with constant differences
between observations
Ø Ratios are not meaningful
Ø Examples:
§ Time – moves along a continuous measure
or seconds, minutes and so on and is
without a zero point of time.
§ Temperature – moves along a continuous
measure of degrees and is without a true
zero.
§ SAT scores
Interval data
34. • Ratio data measured on a continuous
scale and does have a natural zero point.
Ø Ratios are meaningful
Ø Examples:
• monthly sales
• delivery times
• Weight
• Height
• Age
Ratio data
35. 35
q When you are dealing with continuous data, you can use the most
methods to describe your data. You can summarize your data using
percentiles, median, interquartile range, mean, mode, standard
deviation, and range.
q Visualization Methods: To visualize continuous data, you can use a
histogram or a box-plot. With a histogram, you can check the central
tendency, variability, modality, and kurtosis of a distribution. Note that a
histogram can’t show you if you have any outliers. This is why we also
use box-plots.
Continuous Data
36. 36
q you discovered the different data types that are used
throughout statistics.
q You learned the difference between discrete & continuous
data and learned what nominal, ordinal, interval and ratio
measurement scales are.
q Furthermore, you now know what statistical measurements
you can use at which data type and which are the right
visualization methods.
q You also learned, with which methods categorical variables
can be transformed into numeric variables.
q This enables you to create a big part of an exploratory
analysis on a given dataset.
Summary
38. 2
BASIC DEFINITION
q Analytics: Analytics is the discovery , interpretation, and
communication of meaningful patterns or summery in
data.
q Data Analytics (DA) is the process of examining data
sets in order to draw conclusion about the information it
contains.
q Analytics is not a tool or technology, rather it is the way
of thinking and acting on data.
39. WHAT IS ANALYTICS?
Data on its own is useless unless you can make sense of it!
WHAT IS ANALYTICS?
The scientific process of transforming data into insight for making better
decisions, offering new opportunities for a competitive advantage
www.imarticus.org 39
40. The Case for Business Analytics
• The Business environment today is
more complex than ever before.
• Businesses are expected to be diligently
responsive to the increasing demands of
customers, various stakeholders and
even regulators.
• Organizations have been turning to the
use of analytics.
• More than 83% of Global CIOs surveyed
by IBM in 2010 singled out Business
Intelligence and Analytics as one of their
visionary plans for enhancing
competitiveness.
In most cases the primary objective of an
organization that seeks to turn to analytics
is:
• Revenue/Profit growth
• Optimize expenditure
SOLUTION
BUSINESS NEED
GOAL
www.imarticus.org 40
41. 6
WHAT IS DATA ANALYTICS?
• Data Analytics:
– “is a process of inspecting, cleansing, transforming, and modeling data
with the goal of discovering useful information, suggesting conclusions,
and supporting decision-making”. - Wikipedia
– "leverage data in a particular functional process (or application) to
enable context-specific insight that is actionable.“ – Gartner
– “is using our current data sets to extract useful information to
support advanced decision making” - ATC
• Data Visualizations (i.e. Data Viz):
– Visual context of data, Dashboards
– Often single page, real-time user interface, graphical presentation of
your data
“Without data you’re just another person with an opinion.” ~W. Edwards Deming
43. 11
DATA ANALYTICS ARCHITECTURE
Analysis
Visualization
Translation
Cleaning Processing
Interpretation
Preparation
Data Layer
Integration Data Collection
Business
Information
Technology
Partnership and
Stewardship
Wisdom
Information &
Knowledge
Data
DataRulesTools
Action
Action
“The greatest value of a picture is when it forces to notice what we never expected to
see.” ~John Tukey
44. TYPES OF ANALYTICS
1. Descriptive Analytics; analisis ini mengacu pada histori data
sekaligus data yang ada saat ini. Umumnya digunakan untuk menjawab
pertanyaan semacam “Apa yang terjadi dengan ABC?”, “Apa yang terjadi
jika XYZ?”, dan sebagainya.
2. Diagnostic Analytics; analisis ini digunakan untuk menyimpulkan
kejadian berdasarkan lansiran data terkait. Digunakan untuk menjawab
pertanyaan semacam “Mengapa ABC terjadi saat XYZ?”, “Apa yang salah
dengan strategi DEF?”, dan sebagaiya.
3. Predictive Analytics; analisis ini mencoba menyimpulkan sebuah tren
dan kejadian di masa depan mengacu pada data-data historis yang ada.
Model ini cenderung lebih kompleks dari dua tipe sebelumnya, karena
memerlukan pemodelan dan analisis yang lebih mendalam.
4. Prescriptive Analytics; analisis ini digunakan untuk mengoptimalkan
proses, struktur dan sistem melalui informasi yang dihasilkan dari Predictive
Analytics. Pada dasarnya memberi tahu kepada bisnis tentang hal apa yang
perlu dilakukan untuk mengantisipasi kejadian yang ada datang.
45. BDA-45
Copyright (except where referenced) 2014-2016
Stephen H. Kaisler, Frank Armour, Alberto Espinosa and William H. Money
DESCRIPTIVE ANALYTICS
• Process:
– Identify the attributes, then assess/evaluate the attributes
– Estimate the magnitude to correlate the relative contribution of each attribute to the final
solution
– Accumulate more instances of data from the data sources
– If possible, perform the steps of evaluation, classification and categorization quickly
– Yield a measure of adaptability within the OODA loop
• At some threshold, crossover into diagnostic and predictive analytics
http://v1shal.com/content/25-
cartoons-give-current-big-data-
hype-perspective/
46. 46
DIAGNOSTIC ANALYTICS
• Process:
– Begin with descriptive analytics
– Extract patterns from large data quantities via data mining
– Correlate data types for explanation of near-term behavior – past and present
– Estimate linear/non-linear behavior not easily identifiable through other
approaches.
• Example: by classifying past insurance claims, estimate the number of
future claims to flag for investigation with a high probability of being
fraudulent.
Copyright (except where referenced) 2014-2016
Stephen H. Kaisler, Frank Armour, Alberto Espinosa and William H. Money
47. PREDICTIVE ANALYTICS
• Process:
– Begin with descriptive AND diagnostic analytics
– Choose the right data based on domain knowledge and relationships among
variables
– Choose the right techniques to yield insight into possible outcomes
– Determine the likelihood of possible outcomes given initial boundary conditions
– Remember! Data driven analytics is non-linear; do NOT treat like an engineering
project
47
48. BD
A-
48
PRESCRIPTIVE ANALYTICS
• Process:
– Begin w/ predictive analytics
– Determine what should occur and how to make it so
– Determine the mitigating factors that lead to desirable/undesirable outcomes
– “What-if” analysis w/ local or global optimization
– Ex: Find the best set of prices and advertising frequency to maximize revenue
– Ex: And, the right set of business moves to make to achieve that goal
“Make it so”
Copyright (except where referenced) 2014-2016
Stephen H. Kaisler, Frank Armour, Alberto Espinosa and William H. Money
49. BDA-49
DECISIVE ANALYTICS
Ø Process:
• Given a set of decision
alternatives, choose the one
course of action to do from
possibly many
• But, it may not be the optimal one.
• Visualize alternatives – whole or
partial subset
• Perform exploratory analysis –
what-if and why
– How do I get to there from here?
– How did I get here from there?
Copyright (except where referenced) 2014-2016
Stephen H. Kaisler, Frank Armour, Alberto Espinosa and William H. Money
54. 54
q Analytics deskriptif adalah proses data analytics untuk mendapatkan
gambaran umum dari data yang sudah dikumpulkan.
q Contoh dari analytcs desckriptif adalah Google Analytics. Pada
Google Analytics kita hanya bisa melihat informasi sederhana seperti
ada berapa jumlah visitor per satuan waktu, halaman mana saja
yang paling sering dikunjungi, dan data seperti itu.
q Pada analytics sederhana seperti penjumlahan dan rata-rata tanpa
machine learning sudah lebih dari cukup.
q Analytics deskriptif tidak menampilkan prediksi halaman apa yang
akan dikunjungi pengunjung berikutnya atau kenapa seorang
pengunjung mengunjungi suatu halaman.
q Data analytics jenis ini adalah yang paling umum ditemui. Meskipun
hanya data sederhana tanpa pengolahan machine learning, data
seperti ini sangat diperlukan terutama untuk melakukan
benchmarking untuk mengetahui efek dari perubahan yang kita
lakukan.
Analytics deskriptif (Descriptive Analytics)
55. 55
q Deskriptif model mengukur hubungan data dalam suatu cara yang
sering digunakan untuk mengklasifikasikan pelanggan atau prospek
menjadi kelompok-kelompok.
q Deskriptif model tidak rank-order pelanggan dengan kemungkinan
mereka untuk mengambil tindakan tertentu cara model prediksi.
q Sebaliknya, deskriptif model ini dapat digunakan, misalnya, untuk
mengkategorikan pelanggan dengan produk mereka preferensi dan
tahap kehidupan.
q Deskriptif alat pemodelan dapat dimanfaatkan untuk
mengembangkan lebih lanjut model yang dapat mensimulasikan
sejumlah besar agen individual dan membuat prediksi.
Model Deskriptif
60. Descriptive Analytics
What has occurred?
Descriptive analytics, such as data
visualization, is important in helping users
interpret the output from predictive and
predictive analytics.
• Descriptive analytics, such as reporting/OLAP,
dashboards, and data visualization, have been
widely used for some time.
• They are the core of traditional BI.
65. Predictive Analytics
What will occur?
• Marketing is the target for many predictive analytics
applications.
• Descriptive analytics, such as data visualization, is important
in helping users interpret the output from predictive and
prescriptive analytics.
• Algorithms for predictive analytics, such as regression analysis,
machine learning, and neural networks, have also been around
for some time.
• Prescriptive analytics are often referred to as advanced analytics.
70. Prescriptive Analytics
What should occur?
• For example, the use of mathematical programming for revenue management is
common for organizations that have “perishable” goods (e.g., rental cars, hotel
rooms, airline seats).
• Harrah’s has been using revenue management for hotel room pricing for some
time.
• Prescriptive analytics are often referred to as advanced analytics.
• Regression analysis, machine learning, and neural networks
• Often for the allocation of scarce resources
71. Know Your Tools &
Why Learn About
Them?
DATA ANALYTICS TOOLS
73. TOOLS COVERED IN PROGRAM
The program is developed keeping in mind the needs of an evolving Analytics industry that
requires individuals to be “job-ready” from Day 1.
www.imarticus.org 73
74. Why SAS?
The largest independent
vendor in the business
intelligence market
The De facto industry
standard for Clinical Data
Analysis
##11Market LeaderMarket Leader
in Analyticsin Analytics
Used in 60,000+
companies in
over 135
countries
“Analytics powerhouse”
INTEGRATED PLATFORM FOR END TO END SOLUTIONS:
SAS provides an integrated set of software products and services
and integrated technologies for information management,
advanced analytics and reporting.
BUSINESS SOLUTIONS ACROSS DOMAINS AND INDUSTRIES:
Unmatched domain specific industry focused analytics solutions
The Forrester Wave™: Big Data Predictive Analytics Solutions, Q1 2013 74
75. Why R?
R is the #1 Google Search for Advanced Analytics software Google
Trends, April 2016
Highest Paid IT
Skill
Linkedin Skills and
O'Reilly Survey, 2016
Most-used data
science language
after SQL
O’Reilly Survey,
Jan 2014
75% of data
professionals
use R
Rexer Survey,
Oct 2015 Second best
programming
languages for data
science
O'Reilly Survey, 2016
Supports close to
10,000 free
packages
CRAN Figure as on
December 2016
R is #13 of all Programming Languages
Redmonk Language Ratings, June 2015
Demand for R language skills is on the rise.
BCG
Uber
Lloyds of London
& Many More…
Companies Already Onboard R
Facebook
Google
Twitter
McKinsey
ANZ Bank
www.imarticus.org 75
76. What is Hadoop?
Hadoop is TransformingHadoop is Transforming
Businesses AcrossBusinesses Across
IndustriesIndustries
“The growing use of Apache Hadoop, increasing data warehouse volume sizes and the
accumulation of legacy systems in organizations are fostering structured data growth. These
factors are leading enterprises to understand how to reuse, repurpose and gain critical insight
from this data.” Gartner
BIG DATA STORING AND FASTER PROCESSING
Hadoop is an open source software framework created in 2005
that keeps and processes big data in a distributed manner on
large collection of hardware.
Organizations use Hadoop to
manage their data today
(up from 1 out of 10 in 2012)
1 in 4
BUSINESS SOLUTIONS ACROSS DOMAINS AND INDUSTRIES:
Low cost solution with a high fault tolerance to access and create
value from data.
www.imarticus.org 76
77. Hadoop – Big Data is a comprehensive class room training program that enables you to analyse data and
create useful information for careers in Data Analytics.
WHY HADOOP?
ScalabilityComputing
Power
Top 5 Reasons Organizations are using Hadoop
Low Cost
Storage
Flexibility
Data
Protection
Top 5 Industries using Hadoop:
• Computer Manufacturing
• Business Services
• Finance
• Retail & Wholesale
• Education & Government
Enterprises using Hadoop
www.imarticus.org 77
79. WHY PYTHON?
Cost of
Ownership
Python is an open source software
that is free to download. Versatility
Multi-purpose language that can
be used to build an entire
application
Python is a powerful, flexible, open-source language that is easy to learn, easy to use, and has
powerful libraries for data manipulation and analysis
What are the reasons for its sudden popularity?
A Data Scientists’ Dream
Python is particularly useful in data analytics because
it has a rich library for reading and writing data,
running calculations on the information and creating
graphical representations of data sets.
We can write map reduce programs in python using
PyDoop. Here is where Python scores over R. While R
uses in-memory processing, Python using PyDoop
can process PetaBytes of data
Python offers extensive
analytics capabilities for
Text & Predictive Analytics.
IDLE & Spyder IDE is
widely used for data mining.
Big Data Analytics made
possible by PyDoop and
Scipy
In industry, the data science
trend shows increasing
popularity of Python. A
Python-based application
stack can more easily
integrate a data scientist who
writes Python code, since that
eliminates a key hurdle in
productionizing a data
scientist's work.
Integration
Big data
compatibility
Python has become one of the big go-to languages for big data processing due to its wide
selection of libraries
www.imarticus.org 79
80. WHY PYTHON?
Official
language of
Google
Among top
in-demand data
science skills
KDNuggets,
Dec2014
46% of job ads
mention
Python
(after SQL)
KDNuggets
Dec 2014 Ranked #1 of
all programming
languages
Codeeval rankings,
Feb 2015
2nd most
popular data
science language
KDNuggets 2013
Google
Yahoo
Quora
Nokia
ABN
AMRO Bank
IBM
National Weather
Service
& Many More…
Companies Already
Onboard Python
www.imarticus.org 80
81. WHAT IS DATA VISUALIZATION?
Data visualization is the presentation of data in a pictorial or graphical format. For centuries, people
have depended on visual representations such as charts and maps to understand information more
easily and quickly.
81
82. WHY TABLEAU FOR DATA VISUALIZATION?
Cost of
Ownership
Tableau is a competitively priced
software that is available for a trial
download.
Versatility
Multi-purpose package that can be
used to build an entire application
Tableau is a powerful, flexible Data Visualization tool that is easy to learn, easy to use, and has
powerful libraries for data visualization and presentation.
Big data
compatibility
Tableau has become one of the big go-to software programs for Data visualization due to the
wide variety of tools it provides and compatibility with Big Data platforms such as Hadoop.
82
83. WHY TABLEAU FOR DATA VISUALIZATION?
A BUSINESS ANALYSTS’ DREAM
Tableau is easy to learn, use, and significantly faster
than existing solutions. One can easily see patterns,
identify trends and discover visual insights in
seconds. No wizards, no scripts.
Tableau facilitates live, up-to-date data analysis that
taps into the power of the firm’s data warehouse.
Extract data into Tableau’s data engine and take
advantage of breakthrough in-memory architecture.
Tableau offers Powerful
visualization capabilities,
without a single line of code.
Experiment with trend
analyses, regressions,
correlations.
Scalable, secure and
Reliable Cloud and Mobile
Connectivity.
Tableau integrates
exceptionally well with R and
Hadoop, making it a powerful
visualization tool for analytics
and big data use cases.
Developers creating web
applications can integrate fully
interactive Tableau content
into their applications via the
JavaScript API.
INTEGRATION
www.imarticus.org 83