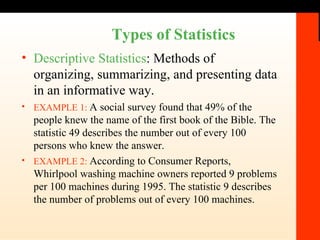
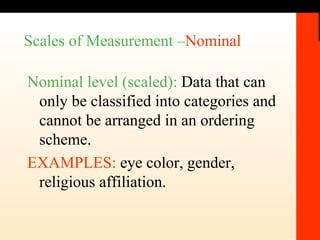
1. Statistics is the science of collecting, organizing, presenting, analyzing, and interpreting numerical data to assist in making effective decisions. It is used extensively in many fields including marketing, healthcare, sports, education and more.
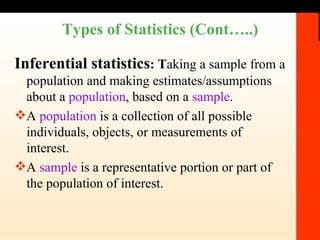
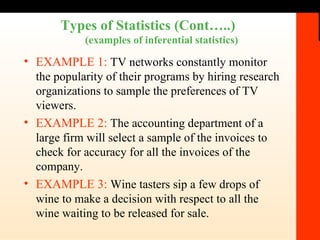
2. There are two main types of statistics - descriptive statistics which summarize and organize data, and inferential statistics which make estimates about populations based on samples.
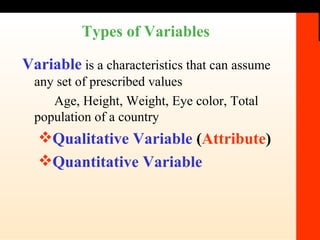
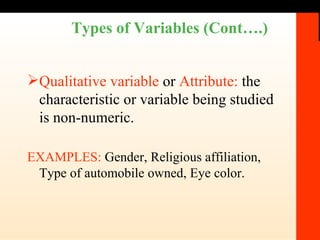
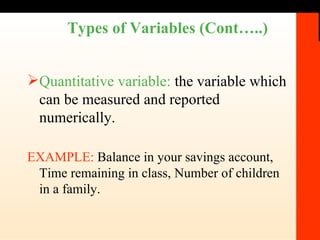
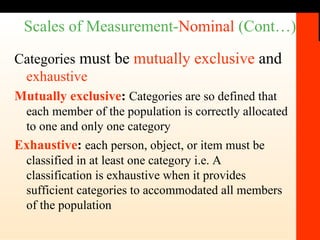
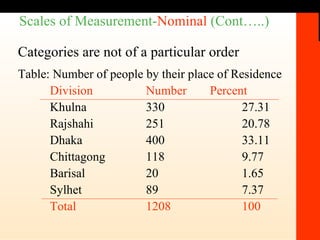
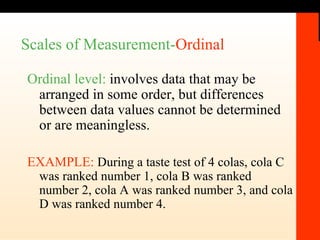
3. Variables can be qualitative like gender or eye color, or quantitative like number of children in a family. Quantitative variables can be discrete like number of bedrooms or continuous like time.


![Getting Started with Apache Spark: Big Data Made Simple [Free Meetup]](https://cdn.slidesharecdn.com/ss_thumbnails/apachesparkgettingstarted-260203175547-8361bcc3-thumbnail.jpg?width=640&height=640&fit=bounds)


