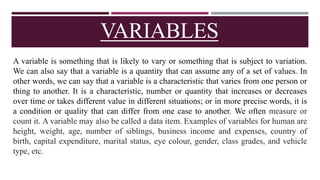
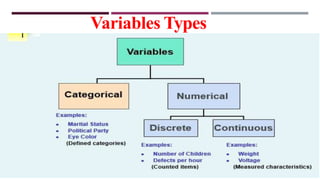
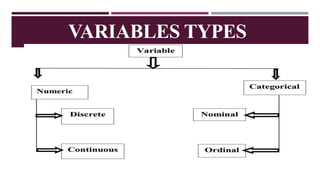
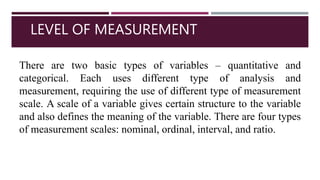
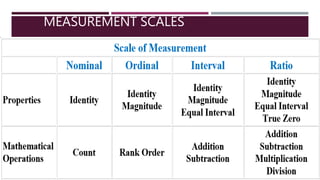
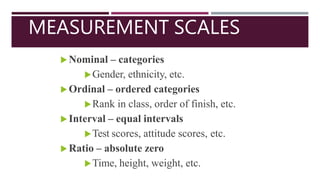
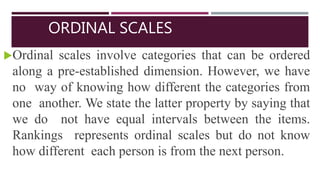
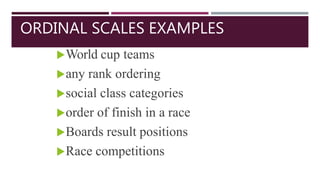
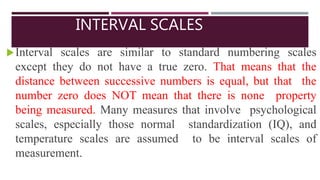
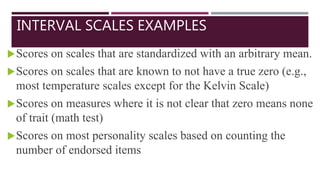
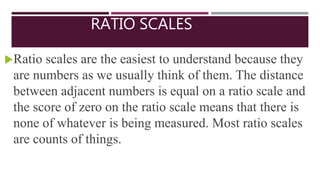
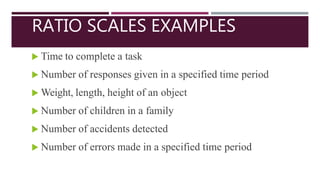
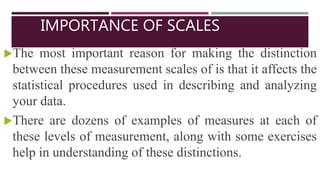
EDUCATIONAL STATISTICS
PRESENTED BY DR. HINA JALAL
Descriptive DataAnalysis
2
VARIABLES
A variable is something that is likely to vary or something that is subject to variation.
We can also say that a variable is a quantity that can assume any of a set of values. In
other words, we can say that a variable is a characteristic that varies from one person or
thing to another. It is a characteristic, number or quantity that increases or decreases
over time or takes different value in different situations; or in more precise words, it is
a condition or quality that can differ from one case to another. We often measure or
count it. A variable may also be called a data item. Examples of variables for human are
height, weight, age, number of siblings, business income and expenses, country of
birth, capital expenditure, marital status, eye colour, gender, class grades, and vehicle
type, etc.
Variables Types
a
VARIABLES TYPES
LEVEL OF MEASUREMENT
There are two basic types of variables – quantitative and
categorical. Each uses different type of analysis and
measurement, requiring the use of different type of measurement
scale. A scale of a variable gives certain structure to the variable
and also defines the meaning of the variable. There are four types
of measurement scales: nominal, ordinal, interval, and ratio.
MEASUREMENT SCALES
 T

MEASUREMENT SCALES
 Nominal – categories
Gender, ethnicity, etc.
 Ordinal – ordered categories
Rank in class, order of finish, etc.
 Interval – equal intervals
Test scores, attitude scores, etc.
 Ratio – absolute zero
Time, height, weight, etc.
NOMINAL SCALES
Nominal scales are naming scales that represent categories
where there is no basis for ordering the categories.
Nominal Scale Examples
diagnostic categories
gender of the participants
classification based on discrete characteristics (hair color)
group affiliation (Republican, Democrat)
ORDINAL SCALES
Ordinal scales involve categories that can be ordered
along a pre-established dimension. However, we have
no way of knowing how different the categories from
one another. We state the latter property by saying that
we do not have equal intervals between the items.
Rankings represents ordinal scales but do not know
how different each person is from the next person.
ORDINAL SCALES EXAMPLES
World cup teams
any rank ordering
social class categories
order of finish in a race
Boards result positions
Race competitions
INTERVAL SCALES
Interval scales are similar to standard numbering scales
except they do not have a true zero. That means that the
distance between successive numbers is equal, but that the
number zero does NOT mean that there is none property
being measured. Many measures that involve psychological
scales, especially those normal standardization (IQ), and
temperature scales are assumed to be interval scales of
measurement.
INTERVAL SCALES EXAMPLES
Scores on scales that are standardized with an arbitrary mean.
Scores on scales that are known to not have a true zero (e.g.,
most temperature scales except for the Kelvin Scale)
Scores on measures where it is not clear that zero means none
of trait (math test)
Scores on most personality scales based on counting the
number of endorsed items
RATIO SCALES
Ratio scales are the easiest to understand because they
are numbers as we usually think of them. The distance
between adjacent numbers is equal on a ratio scale and
the score of zero on the ratio scale means that there is
none of whatever is being measured. Most ratio scales
are counts of things.
RATIO SCALES EXAMPLES
 Time to complete a task
 Number of responses given in a specified time period
 Weight, length, height of an object
 Number of children in a family
 Number of accidents detected
 Number of errors made in a specified time period
IMPORTANCE OF SCALES
The most important reason for making the distinction
between these measurement scales of is that it affects the
statistical procedures used in describing and analyzing
your data.
There are dozens of examples of measures at each of
these levels of measurement, along with some exercises
help in understanding of these distinctions.
SCIENTIFIC METHOD
There are many disciplines ranging from medicine and
astrophysics to agriculture, zoology and social sciences, where
scientists a process called scientific method is used to advance
their knowledge and understanding.
Scientific method is a tool for:
(a) forming and framing questions,
(b) collecting information to answer those questions, and
(c) revising old and developing new questions.
STEPS OF
SCIENTIFIC
METHOD

Basics of Educational Statistics (Variables and types)

  • 1.
    EDUCATIONAL STATISTICS PRESENTED BYDR. HINA JALAL Descriptive DataAnalysis 2
  • 2.
    VARIABLES A variable issomething that is likely to vary or something that is subject to variation. We can also say that a variable is a quantity that can assume any of a set of values. In other words, we can say that a variable is a characteristic that varies from one person or thing to another. It is a characteristic, number or quantity that increases or decreases over time or takes different value in different situations; or in more precise words, it is a condition or quality that can differ from one case to another. We often measure or count it. A variable may also be called a data item. Examples of variables for human are height, weight, age, number of siblings, business income and expenses, country of birth, capital expenditure, marital status, eye colour, gender, class grades, and vehicle type, etc.
  • 3.
  • 4.
  • 5.
    LEVEL OF MEASUREMENT Thereare two basic types of variables – quantitative and categorical. Each uses different type of analysis and measurement, requiring the use of different type of measurement scale. A scale of a variable gives certain structure to the variable and also defines the meaning of the variable. There are four types of measurement scales: nominal, ordinal, interval, and ratio.
  • 6.
  • 7.
    MEASUREMENT SCALES  Nominal– categories Gender, ethnicity, etc.  Ordinal – ordered categories Rank in class, order of finish, etc.  Interval – equal intervals Test scores, attitude scores, etc.  Ratio – absolute zero Time, height, weight, etc.
  • 8.
    NOMINAL SCALES Nominal scalesare naming scales that represent categories where there is no basis for ordering the categories. Nominal Scale Examples diagnostic categories gender of the participants classification based on discrete characteristics (hair color) group affiliation (Republican, Democrat)
  • 9.
    ORDINAL SCALES Ordinal scalesinvolve categories that can be ordered along a pre-established dimension. However, we have no way of knowing how different the categories from one another. We state the latter property by saying that we do not have equal intervals between the items. Rankings represents ordinal scales but do not know how different each person is from the next person.
  • 10.
    ORDINAL SCALES EXAMPLES Worldcup teams any rank ordering social class categories order of finish in a race Boards result positions Race competitions
  • 11.
    INTERVAL SCALES Interval scalesare similar to standard numbering scales except they do not have a true zero. That means that the distance between successive numbers is equal, but that the number zero does NOT mean that there is none property being measured. Many measures that involve psychological scales, especially those normal standardization (IQ), and temperature scales are assumed to be interval scales of measurement.
  • 12.
    INTERVAL SCALES EXAMPLES Scoreson scales that are standardized with an arbitrary mean. Scores on scales that are known to not have a true zero (e.g., most temperature scales except for the Kelvin Scale) Scores on measures where it is not clear that zero means none of trait (math test) Scores on most personality scales based on counting the number of endorsed items
  • 13.
    RATIO SCALES Ratio scalesare the easiest to understand because they are numbers as we usually think of them. The distance between adjacent numbers is equal on a ratio scale and the score of zero on the ratio scale means that there is none of whatever is being measured. Most ratio scales are counts of things.
  • 14.
    RATIO SCALES EXAMPLES Time to complete a task  Number of responses given in a specified time period  Weight, length, height of an object  Number of children in a family  Number of accidents detected  Number of errors made in a specified time period
  • 15.
    IMPORTANCE OF SCALES Themost important reason for making the distinction between these measurement scales of is that it affects the statistical procedures used in describing and analyzing your data. There are dozens of examples of measures at each of these levels of measurement, along with some exercises help in understanding of these distinctions.
  • 16.
    SCIENTIFIC METHOD There aremany disciplines ranging from medicine and astrophysics to agriculture, zoology and social sciences, where scientists a process called scientific method is used to advance their knowledge and understanding. Scientific method is a tool for: (a) forming and framing questions, (b) collecting information to answer those questions, and (c) revising old and developing new questions.
  • 17.