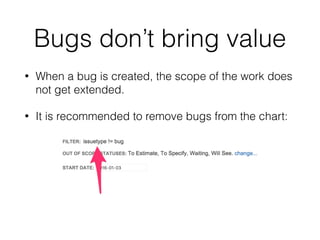
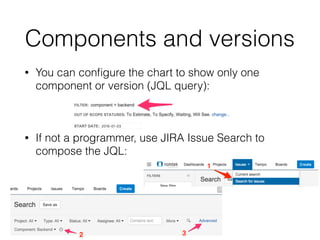
Using primavera to calculate the forward pass and backward pass dates of a project.
There are various ways to calculate the late start and late finish dates of a project.
The document will enable the reader to have a better understanding on the different ways of progress measurement and help decide an individual the reporting type that is beneficial for them.
Gantt charts have evolved to become a primary means of communicating project plans and schedules. However, Gantt charts or bar graphs are limited in what it can present. They lack the ability to show the interrelationships and interdependencies which control the progress of the project. Gantt charts are subjective vs. rule-based, therefore, not reliable tools for construction scheduling. Logic Gantt charts (with CPM logic ties) are not subjective but fail to convey a sense of logical flow. See how the Graphical Planning Method (GPM) is a better alternative to the prior logic Gantt charts.
Apps4.Pro Planner Gantt helps you to visualize tasks in sequence and plan project tasks easily. Apps4.Pro Planner Gantt - is a chrome extension which connects with Microsoft Planner and allows you to
View Planner tasks in Gantt
Set task dependency
Create Sub tasks by drag and drop
Set Actual start / end dates and compare it with baseline dates
Set contribution units for task assignments
Tools for project management is described some of the commonly used tools such as gantt chart, pert chart, logic network, product breakdown structure, work breakdown structure is defined briefly.
NCV 4 Project Management Hands-On Support Slide Show - Module 2Future Managers
This slide show complements the Learner Guide NCV 4 Project Management Hands-On Training by Bert Eksteen, published by Future Managers. For more information visit our website www.futuremanagers.net
Program Management 2.0: Burndown ChartsJohn Carter
From a course titled Program Management 2.0, this presentation shows how Burndown charts can be applied to improve visibility and increase feedback to teams in product development.
This PPT describes about the "Project Tracking" activity & statistical process control at Infosys.
It covers the entire topic such as project tracking, activities tracking, defect tracking, issue tracking, etc.
It covers all main activity of SPC such as SPC analysis, control chart for SPC etc.
This PowerPoint presentation is of "Software Project Management".
Program Management 2.0: Monitoring PerformanceJohn Carter
From a course titled Program Management 2.0, this presentation pulls together a suite of tools for planning work, assessing & monitoring risk, monitoring program progress, clarifying roles, and making decisions.
January 2020 Page 1 of 5 Project Fields to Include .docxShiraPrater50
January 2020
Page 1 of 5
Project Fields to Include in ITP Deliverables
Contents
• Tasks to include in ITP Deliverables
• Project Configuration Settings
• ITP-1 - Project WBS with Durations
• TTP-3 - Project Schedule with Dependency Links
• TTP-4 - Project Resources and Costs
• ITP-3 - Project Risk Assessment
• TTP-5 - Consolidated Project Management Plan
• TTP-6 - Project Execution, Tracking and Changes
Tasks to Include in ITP Deliverables
First, before we get to fields - Please make sure that your WBS (and .mpp file) include the following tasks
as part of your WBS. Note that this these are necessary but far from sufficient. Many more tasks are
needed. This also does not mean that a single task will necessarily suffice for each of these. Rather,
include as many tasks as it takes to do the job, but please include at least the following kinds of tasks in
addition to whatever else you were planning for your WBS:
• Tasks regarding ordering, delivering, and receiving hardware
• Tasks regarding ordering, delivering, and receiving software
• Tasks regarding ordering, delivering, and receiving networking
• Tasks regarding installing hardware
• Tasks regarding installing software
• Tasks regarding installing networking
• Tasks regarding managing, controlling, and monitoring the project and the team
• Project meetings
To reiterate, there is a lot more to the WBS than this. However, you will find these tasks to be needed in
later ITP deliverables. Omitting them would likely be detrimental for many assignments.
January 2020
Page 2 of 5
Project Configuration Settings
Project needs some configuring before you submit these assignments. Hint: This step will count
towards your grade.
NOTE: This is a one-time setup. If you follow the configuration steps for ITP-1, you do not need to
configure Project for later assignments.
Launch Project and open a Blank Project. Open Project Options and adjust your calendar options
settings to look EXACTLY like this:
Verify your scheduling options look EXACTLY like this
Verify your calculation settings look EXACTLY like this
January 2020
Page 3 of 5
ITP-1 – Project WBS with Durations
Please ensure that your .mpp file includes at least the following fields (columns) visible in the
left-hand table portion of the Gantt chart view or the Tracking Gantt view:
• Indicators (white "i" in a solid blue circle, listed in the Columns list as "Indicators") [a
default field]
• Task Mode
• Name (i.e., task name) [a default field]
• Duration [a default field]
TTP-3 - Project Schedule with Dependency Links
Before we get to TTP-3 fields, a note about the general structure of the TTP-3 schedule: The
Gantt Chart and the Network Diagram should not look like waterfalls, wherein each task has
only one predecessor and only one successor. That is not only unrealistic, but is problematic for
most projects. There should be parallelism. Th ...
What is Project Monitoring?
Purpose of Project Monitoring
Benefits of Project Monitoring
Case study of Project Monitoring- Toll Administration Block (G+1)
Conclusion
These slides are from the Metrics-Based Process Mapping webinar delivered 09-29-2021.
Companion resources:
• View the recording - https://tkmg.com/webinars/metrics-based-process-mapping-3/
• Buy the book - https://tkmgacademy.com/products/metrics-based-process-mapping/
• Take the TKMG Academy course - https://tkmgacademy.com/courses/metrics-based-process-mapping/
The primary metric in an Agile project is whether working software actually exists, and is demonstrably suitable for its intended purpose. This is determined empirically, by demonstration, at the end of every single iteration and product increment
All teams and projects are encouraged to pivot most of their measuring-attention to this fact. All other metrics are subordinate to that objective and the overriding goal of keeping the focus on rapid delivery of quality, working software.
Utilocate offers a comprehensive solution for locate ticket management by automating and streamlining the entire process. By integrating with Geospatial Information Systems (GIS), it provides accurate mapping and visualization of utility locations, enhancing decision-making and reducing the risk of errors. The system's advanced data analytics tools help identify trends, predict potential issues, and optimize resource allocation, making the locate ticket management process smarter and more efficient. Additionally, automated ticket management ensures consistency and reduces human error, while real-time notifications keep all relevant personnel informed and ready to respond promptly.
The system's ability to streamline workflows and automate ticket routing significantly reduces the time taken to process each ticket, making the process faster and more efficient. Mobile access allows field technicians to update ticket information on the go, ensuring that the latest information is always available and accelerating the locate process. Overall, Utilocate not only enhances the efficiency and accuracy of locate ticket management but also improves safety by minimizing the risk of utility damage through precise and timely locates.
What is Augmented Reality Image Trackingpavan998932
Augmented Reality (AR) Image Tracking is a technology that enables AR applications to recognize and track images in the real world, overlaying digital content onto them. This enhances the user's interaction with their environment by providing additional information and interactive elements directly tied to physical images.
E-commerce Application Development Company.pdfHornet Dynamics
Your business can reach new heights with our assistance as we design solutions that are specifically appropriate for your goals and vision. Our eCommerce application solutions can digitally coordinate all retail operations processes to meet the demands of the marketplace while maintaining business continuity.
Essentials of Automations: The Art of Triggers and Actions in FMESafe Software
In this second installment of our Essentials of Automations webinar series, we’ll explore the landscape of triggers and actions, guiding you through the nuances of authoring and adapting workspaces for seamless automations. Gain an understanding of the full spectrum of triggers and actions available in FME, empowering you to enhance your workspaces for efficient automation.
We’ll kick things off by showcasing the most commonly used event-based triggers, introducing you to various automation workflows like manual triggers, schedules, directory watchers, and more. Plus, see how these elements play out in real scenarios.
Whether you’re tweaking your current setup or building from the ground up, this session will arm you with the tools and insights needed to transform your FME usage into a powerhouse of productivity. Join us to discover effective strategies that simplify complex processes, enhancing your productivity and transforming your data management practices with FME. Let’s turn complexity into clarity and make your workspaces work wonders!
Atelier - Innover avec l’IA Générative et les graphes de connaissancesNeo4j
Atelier - Innover avec l’IA Générative et les graphes de connaissances
Allez au-delà du battage médiatique autour de l’IA et découvrez des techniques pratiques pour utiliser l’IA de manière responsable à travers les données de votre organisation. Explorez comment utiliser les graphes de connaissances pour augmenter la précision, la transparence et la capacité d’explication dans les systèmes d’IA générative. Vous partirez avec une expérience pratique combinant les relations entre les données et les LLM pour apporter du contexte spécifique à votre domaine et améliorer votre raisonnement.
Amenez votre ordinateur portable et nous vous guiderons sur la mise en place de votre propre pile d’IA générative, en vous fournissant des exemples pratiques et codés pour démarrer en quelques minutes.
AI Pilot Review: The World’s First Virtual Assistant Marketing SuiteGoogle
AI Pilot Review: The World’s First Virtual Assistant Marketing Suite
👉👉 Click Here To Get More Info 👇👇
https://sumonreview.com/ai-pilot-review/
AI Pilot Review: Key Features
✅Deploy AI expert bots in Any Niche With Just A Click
✅With one keyword, generate complete funnels, websites, landing pages, and more.
✅More than 85 AI features are included in the AI pilot.
✅No setup or configuration; use your voice (like Siri) to do whatever you want.
✅You Can Use AI Pilot To Create your version of AI Pilot And Charge People For It…
✅ZERO Manual Work With AI Pilot. Never write, Design, Or Code Again.
✅ZERO Limits On Features Or Usages
✅Use Our AI-powered Traffic To Get Hundreds Of Customers
✅No Complicated Setup: Get Up And Running In 2 Minutes
✅99.99% Up-Time Guaranteed
✅30 Days Money-Back Guarantee
✅ZERO Upfront Cost
See My Other Reviews Article:
(1) TubeTrivia AI Review: https://sumonreview.com/tubetrivia-ai-review
(2) SocioWave Review: https://sumonreview.com/sociowave-review
(3) AI Partner & Profit Review: https://sumonreview.com/ai-partner-profit-review
(4) AI Ebook Suite Review: https://sumonreview.com/ai-ebook-suite-review
Need for Speed: Removing speed bumps from your Symfony projects ⚡️Łukasz Chruściel
No one wants their application to drag like a car stuck in the slow lane! Yet it’s all too common to encounter bumpy, pothole-filled solutions that slow the speed of any application. Symfony apps are not an exception.
In this talk, I will take you for a spin around the performance racetrack. We’ll explore common pitfalls - those hidden potholes on your application that can cause unexpected slowdowns. Learn how to spot these performance bumps early, and more importantly, how to navigate around them to keep your application running at top speed.
We will focus in particular on tuning your engine at the application level, making the right adjustments to ensure that your system responds like a well-oiled, high-performance race car.
Introducing Crescat - Event Management Software for Venues, Festivals and Eve...Crescat
Crescat is industry-trusted event management software, built by event professionals for event professionals. Founded in 2017, we have three key products tailored for the live event industry.
Crescat Event for concert promoters and event agencies. Crescat Venue for music venues, conference centers, wedding venues, concert halls and more. And Crescat Festival for festivals, conferences and complex events.
With a wide range of popular features such as event scheduling, shift management, volunteer and crew coordination, artist booking and much more, Crescat is designed for customisation and ease-of-use.
Over 125,000 events have been planned in Crescat and with hundreds of customers of all shapes and sizes, from boutique event agencies through to international concert promoters, Crescat is rigged for success. What's more, we highly value feedback from our users and we are constantly improving our software with updates, new features and improvements.
If you plan events, run a venue or produce festivals and you're looking for ways to make your life easier, then we have a solution for you. Try our software for free or schedule a no-obligation demo with one of our product specialists today at crescat.io
Graspan: A Big Data System for Big Code AnalysisAftab Hussain
We built a disk-based parallel graph system, Graspan, that uses a novel edge-pair centric computation model to compute dynamic transitive closures on very large program graphs.
We implement context-sensitive pointer/alias and dataflow analyses on Graspan. An evaluation of these analyses on large codebases such as Linux shows that their Graspan implementations scale to millions of lines of code and are much simpler than their original implementations.
These analyses were used to augment the existing checkers; these augmented checkers found 132 new NULL pointer bugs and 1308 unnecessary NULL tests in Linux 4.4.0-rc5, PostgreSQL 8.3.9, and Apache httpd 2.2.18.
- Accepted in ASPLOS ‘17, Xi’an, China.
- Featured in the tutorial, Systemized Program Analyses: A Big Data Perspective on Static Analysis Scalability, ASPLOS ‘17.
- Invited for presentation at SoCal PLS ‘16.
- Invited for poster presentation at PLDI SRC ‘16.
Mobile App Development Company In Noida | Drona InfotechDrona Infotech
Looking for a reliable mobile app development company in Noida? Look no further than Drona Infotech. We specialize in creating customized apps for your business needs.
Visit Us For : https://www.dronainfotech.com/mobile-application-development/
Software Engineering, Software Consulting, Tech Lead, Spring Boot, Spring Cloud, Spring Core, Spring JDBC, Spring Transaction, Spring MVC, OpenShift Cloud Platform, Kafka, REST, SOAP, LLD & HLD.
Enterprise Resource Planning System includes various modules that reduce any business's workload. Additionally, it organizes the workflows, which drives towards enhancing productivity. Here are a detailed explanation of the ERP modules. Going through the points will help you understand how the software is changing the work dynamics.
To know more details here: https://blogs.nyggs.com/nyggs/enterprise-resource-planning-erp-system-modules/
Takashi Kobayashi and Hironori Washizaki, "SWEBOK Guide and Future of SE Education," First International Symposium on the Future of Software Engineering (FUSE), June 3-6, 2024, Okinawa, Japan
Do you want Software for your Business? Visit Deuglo
Deuglo has top Software Developers in India. They are experts in software development and help design and create custom Software solutions.
Deuglo follows seven steps methods for delivering their services to their customers. They called it the Software development life cycle process (SDLC).
Requirement — Collecting the Requirements is the first Phase in the SSLC process.
Feasibility Study — after completing the requirement process they move to the design phase.
Design — in this phase, they start designing the software.
Coding — when designing is completed, the developers start coding for the software.
Testing — in this phase when the coding of the software is done the testing team will start testing.
Installation — after completion of testing, the application opens to the live server and launches!
Maintenance — after completing the software development, customers start using the software.
Why Mobile App Regression Testing is Critical for Sustained Success_ A Detail...kalichargn70th171
A dynamic process unfolds in the intricate realm of software development, dedicated to crafting and sustaining products that effortlessly address user needs. Amidst vital stages like market analysis and requirement assessments, the heart of software development lies in the meticulous creation and upkeep of source code. Code alterations are inherent, challenging code quality, particularly under stringent deadlines.
2. Goals
• Flexible iteration management
• Pace of work monitoring
• Finish date prediction
• Early learning of failure causes to fix them
3. Setup Step 1/1
Define the scope
• Create JIRA Issues for all work items within the monitored scope.
• Set Original Estimate for every Issue within the scope, example:
4. Original Estimates
• Update only while adding the Issue to the scope or when the
scope of the Issue changes.
• Affects the vertical dotted Scope change line:
5. Remaining Estimates
• Update every day as the work progresses.
• The chart shows the sum of Remaining Estimates of all Issues in the scope, for every day.
6. Iterations Howto (1/2)
• Use JIRA statuses to differentiate Issues that are not a
part of the current iteration (scope) and will not be
displayed:
• To start new iteration, move new issues into the scope by
changing their status
• Example: Waiting -> ToDo.
8. What’s done on that day?
• Hover over the Remaining Work line to get a status
and progress information for a specific day.
9. Bugs don’t bring value
• When a bug is created, the scope of the work does
not get extended.
• It is recommended to remove bugs from the chart:
10. Components and versions
• You can configure the chart to show only one
component or version (JQL query):
• If not a programmer, use JIRA Issue Search to
compose the JQL: