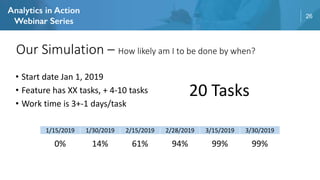
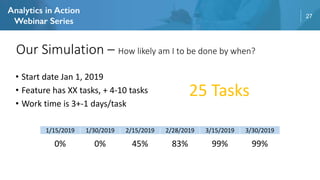
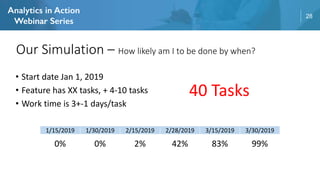
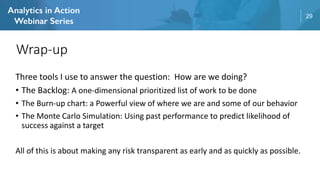
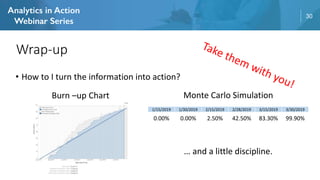
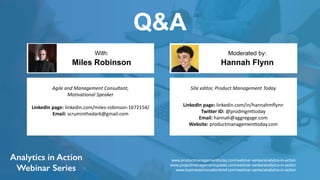
Project Analytics: Visibility that Aids Risk
Management
Miles Robinson Hannah Flynn
With: Moderated by:
TO USE YOUR COMPUTER'S AUDIO:
When the webinar begins, you will be connected to audio
using your computer's microphone and speakers (VoIP). A
headset is recommended.
Webinar will begin:
11:00 am, PST
TO USE YOUR TELEPHONE:
If you prefer to use your phone, you must select "Use Telephone"
after joining the webinar and call in using the numbers below.
United States: +1 (631) 992-3221
Access Code: 408-657-707
Audio PIN: Shown after joining the webinar
--OR--
Revulytics gives any software producers deep and actionable insight into
who is using their software products and how they are being used, and the
out-of-box analytics that enable them to grow incremental revenue, convert
and retain customers, and make decisions about licensing and cloud
transformation strategies.
Click on the Questions panel to
interact with the presenters
www.productmanagementtoday.com/webinar-series/analytics-in-action
www.projectmanagementupdate.com/webinar-series/analytics-in-action
www.businessinnovationbrief.com/webinar-series/analytics-in-action
About Miles Robinson
Miles Robinson has been building cybersecurity solutions with Symantec Corporation for 18 years for both
consumers and enterprises. As a User Experience Manager, Engineer and Artist, he focuses on the human
element when building solutions and developing teams. He also serves as Chief Strategy Officer for Adaptable
Security, a non-profit serving the cybersecurity needs of local government and small businesses.
Miles is currently an Agile/Operational coach living in the California Central Coast. He enjoys good wine, great fire
pit steak and winning the war on gophers.
About Hannah Flynn
Hannah went to The University of Chicago, where she majored in Environmental Studies with a concentration in
Economics and Policy. She now works with Aggregage on social media strategy and webinar production on sites such
as Product Management Today, B2B Marketing Zone, and Customer Experience Update.
Miles Robinson
Ops Consultant
• 18 Years with Symantec Corporation
• Engineer & Engineering Manager B2C products
• Agile Transformation Coach
• Sr Manager User Experience Operations B2B Solutions
• Head of Enterprise Product Design
• B2C and B2B Solutions
• Products serving 50 Million Home Users
• Forbes 500 customers
• CSO Adaptable Security
• Cyber Security Non-profit
• Serving SMB and Municipal Government
6
Agenda
• The Challenge
• Backlog Highlights
• Burn-up Tool
• Future Projections
• Wrap-up
Project Analytics: Visibility that Aids Risk Management
7
• Product Life-cycle
• Finding the Opportunity
• Building the Solution
• Distribution
PM Challenge
• Building the Solution
• The Questions Arise:
• How confident are we on our delivery?
• Can we add features?
• What will the impact be?
• What are the chances we can hit X date?
• Can we cut a feature and go early?
• Here are three tools I use.
8
• The Factors Usually at Play
• Resources – People, Capability and Cost
• Usually fixed, usually non-negotiable
• Scope – What must go in or miss the opportunity
• Fixed for a minimal set, but usually expands as project
continues
• Time – Make the target or miss the opportunity
• Usually fixed
• Quality – How good it needs to be
• Often the hidden casualty of Time and Scope fanaticism
Context – What I need to see
9
• Scope – Monitor what we add as we go
• Time – Map the work to dates
• I want to answer questions
• Are we doing what we need to?
• Are we on time?
• What’s changed?
• I need a task list (scope) and a calendar (time)
Context – What I need to see
1
2
3
4
…
September
10
The Backlog
Monitoring Scope Through a Task List
11
• A one-dimensional prioritized list of work to be done
• One-Dimensional - a forced view, when applied, that
produces a view of cascading effects
Scope: Backlog – A Quick overview
1
2
3
4
5
6
7
…
New Item
MayJune
Change in Date
Something fell off
How is it going to impact the project?
12
• A one-dimensional prioritized list of work to be done
• One-Dimensional - a forced view, when applied, that
produces a view of cascading effects
• Prioritized List – A clear and unambiguous communication
of priorities
Scope: Backlog – A Quick overview
1
2
3
4
5
6
7
…
Communicating broadly and often means
delegation happens how you want, even
when you don’t know it.
13
• A one-dimensional prioritized list of work to be done
• One-Dimensional - a forced view, when applied, that
produces a view of cascading effects
• Prioritized List – A clear and unambiguous communication
of priorities
• Of Work – it needs to be aligned to effort limits
Scope: Backlog – A Quick overview
1
2
3
4
5
6
7
…
May
14
• A one-dimensional prioritized list of work to be done
• One-Dimensional - a forced view, when applied, that
produces a view of cascading effects
• Prioritized List – A clear and unambiguous communication
of priorities
• Of Work – it needs to be aligned to effort
• To be Done – The tasks are finite, with a clear definition of
done
Scope: Backlog – A Quick overview
1
2
3
4
5
6
7
… 12 days
Added Started Completed
15
Scope: Backlog – A Quick overview
1
2
3
4
5
6
7
…
1
2
3
4
…
1
2
3
4
…
1
2
3
4
…
Product Feature 1 Feature 2 Feature 3Garden Vegetables Sheds Irrigation
Irrigation
Sheds
Planters
Lawn
Paving Stone
Gazebo
BBQ Pit
Map current
Cap old lines
Dig Trenches
Lay pipe
Prep location
Install Shed 1
Xfer from old shed
Tear down Old
Relocate Boxes
Gopher proof
Soil Prep
Planting
16
Burn-up Chart
Monitoring Relative Time and Scope
17
A burn-up chart tracks the date an item is added to the
backlog to be done against the date of actual
completion
Scope and Time in One Shot
14 days
Added Started Completed
12 days
Added Started Completed
11 days
Added Started Completed
18
Time: Release Burn-up Chart
• Grey area - Items added to the list
• Blue: Items Complete
• Blue Line before today: average rate of
completion
• Blue line after today: forecast based on
recent historical data
19
Time: Release Burn-up Chart
Process Change for Consistency
• Started then stagnated
• New work in Mar, then again in May
• Bug Jump in June
• New intake process after review in Jun,
resulting in more consistent data
(More Predictability!)
• This is a service rather than release, so
stable consistency and predictability of
response time and throughput is
positive.
20
Time: Release Burn-up Chart
The Out of Bounds Project • Steady intake with leveling in May
• Increase in new work definition starting
in Jun/July
• Intake exceeds rate of work
• Date projection extends beyond
release date
• Project work addition accelerating after
August
• Staff change in early Aug
• Slows work progress during
training
• Accelerates at end of August
21
Time: Release Burn-up Chart
New Manager on the Job • Aug 2017-Nov 2017 mirror pattern
indicates deadline driven process with
much work in parallel finishing just
before deadline.
• More consistent work pattern in Jan
(new management)
• Request lead time shrinks showing
significant increase of response time
(less gap means fast response)
• Work done flattening mapped to better
quality in delivery
22
The No-estimates Disclaimer
• In this model we used issue count only
• It could be using story points with the
same results and value delivery
• No Estimates experiment (our finding)
• over time story sizing becomes
standardized at time of
implementation
• Early story estimates are wildly
inaccurate and are corrected closer
to time of implementation
• In the end, using issue count
history was faster, accurate and
easier.
23
Monte Carlo Simulation
Future Projections using Past Performance
24
• With long ranges of data, we can see how predictable our projects are
• How well defined up front by number of tasks added after beginning
• How consistently off by how widely varied that number is
• What the productivity load is for the team
• What the variance in that productivity is over time
• With this we can say things like
• A feature of this size will have a number of tasks, + 4-10 tasks added after start.
• The team working on it finishes a task in 3, +- 1 days.
• With these numbers we can predict future commitment risks.
Looking Into the Future
25
• Identify the ranges
• A feature of this size will have XX tasks, + 4-10 tasks added after start.
• The team working on it finishes 3 tasks, +- 1 tasks per week.
• Run a simulation
• Use random numbers to come up with the manifested variances
• Calculate the completion date based on simulation
• Run the simulation 10,000 times
• See what you end up with
The Monte Carlo Simulation
26
• Start date Jan 1, 2019
• Feature has XX tasks, + 4-10 tasks
• Work time is 3+-1 days/task
Our Simulation – How likely am I to be done by when?
1/15/2019 1/30/2019 2/15/2019 2/28/2019 3/15/2019 3/30/2019
0% 14% 61% 94% 99% 99%
20 Tasks
27
• Start date Jan 1, 2019
• Feature has XX tasks, + 4-10 tasks
• Work time is 3+-1 days/task
1/15/2019 1/30/2019 2/15/2019 2/28/2019 3/15/2019 3/30/2019
0% 0% 45% 83% 99% 99%
25 Tasks
Our Simulation – How likely am I to be done by when?
28
• Start date Jan 1, 2019
• Feature has XX tasks, + 4-10 tasks
• Work time is 3+-1 days/task
Our Simulation – How likely am I to be done by when?
1/15/2019 1/30/2019 2/15/2019 2/28/2019 3/15/2019 3/30/2019
0% 0% 2% 42% 83% 99%
40 Tasks
29
Three tools I use to answer the question: How are we doing?
• The Backlog: A one-dimensional prioritized list of work to be done
• The Burn-up chart: a Powerful view of where we are and some of our behavior
• The Monte Carlo Simulation: Using past performance to predict likelihood of
success against a target
All of this is about making any risk transparent as early and as quickly as possible.
Wrap-up
30
• How to I turn the information into action?
Wrap-up
1/15/2019 1/30/2019 2/15/2019 2/28/2019 3/15/2019 3/30/2019
0.00% 0.00% 2.50% 42.50% 83.30% 99.90%
Burn –up Chart Monte Carlo Simulation
… and a little discipline.
31
Thank you!
Q&A
Hannah Flynn
With: Moderated by:
Agile and Management Consultant,
Motivational Speaker
LinkedIn page: linkedin.com/miles-robinson-1b72154/
Email: scruminthedark@gmail.com
Miles Robinson
Site editor, Product Management Today
LinkedIn page: linkedin.com/in/hannahmflynn
Twitter ID: @prodmgmttoday
Email: hannah@aggregage.com
Website: productmanagementtoday.com
www.productmanagementtoday.com/webinar-series/analytics-in-action
www.projectmanagementupdate.com/webinar-series/analytics-in-action
www.businessinnovationbrief.com/webinar-series/analytics-in-action

Project Analytics: Visibility that Aids Risk Management

  • 1.
    Project Analytics: Visibilitythat Aids Risk Management Miles Robinson Hannah Flynn With: Moderated by: TO USE YOUR COMPUTER'S AUDIO: When the webinar begins, you will be connected to audio using your computer's microphone and speakers (VoIP). A headset is recommended. Webinar will begin: 11:00 am, PST TO USE YOUR TELEPHONE: If you prefer to use your phone, you must select "Use Telephone" after joining the webinar and call in using the numbers below. United States: +1 (631) 992-3221 Access Code: 408-657-707 Audio PIN: Shown after joining the webinar --OR--
  • 2.
    Revulytics gives anysoftware producers deep and actionable insight into who is using their software products and how they are being used, and the out-of-box analytics that enable them to grow incremental revenue, convert and retain customers, and make decisions about licensing and cloud transformation strategies.
  • 3.
    Click on theQuestions panel to interact with the presenters www.productmanagementtoday.com/webinar-series/analytics-in-action www.projectmanagementupdate.com/webinar-series/analytics-in-action www.businessinnovationbrief.com/webinar-series/analytics-in-action
  • 4.
    About Miles Robinson MilesRobinson has been building cybersecurity solutions with Symantec Corporation for 18 years for both consumers and enterprises. As a User Experience Manager, Engineer and Artist, he focuses on the human element when building solutions and developing teams. He also serves as Chief Strategy Officer for Adaptable Security, a non-profit serving the cybersecurity needs of local government and small businesses. Miles is currently an Agile/Operational coach living in the California Central Coast. He enjoys good wine, great fire pit steak and winning the war on gophers. About Hannah Flynn Hannah went to The University of Chicago, where she majored in Environmental Studies with a concentration in Economics and Policy. She now works with Aggregage on social media strategy and webinar production on sites such as Product Management Today, B2B Marketing Zone, and Customer Experience Update.
  • 5.
    Miles Robinson Ops Consultant •18 Years with Symantec Corporation • Engineer & Engineering Manager B2C products • Agile Transformation Coach • Sr Manager User Experience Operations B2B Solutions • Head of Enterprise Product Design • B2C and B2B Solutions • Products serving 50 Million Home Users • Forbes 500 customers • CSO Adaptable Security • Cyber Security Non-profit • Serving SMB and Municipal Government
  • 6.
    6 Agenda • The Challenge •Backlog Highlights • Burn-up Tool • Future Projections • Wrap-up Project Analytics: Visibility that Aids Risk Management
  • 7.
    7 • Product Life-cycle •Finding the Opportunity • Building the Solution • Distribution PM Challenge • Building the Solution • The Questions Arise: • How confident are we on our delivery? • Can we add features? • What will the impact be? • What are the chances we can hit X date? • Can we cut a feature and go early? • Here are three tools I use.
  • 8.
    8 • The FactorsUsually at Play • Resources – People, Capability and Cost • Usually fixed, usually non-negotiable • Scope – What must go in or miss the opportunity • Fixed for a minimal set, but usually expands as project continues • Time – Make the target or miss the opportunity • Usually fixed • Quality – How good it needs to be • Often the hidden casualty of Time and Scope fanaticism Context – What I need to see
  • 9.
    9 • Scope –Monitor what we add as we go • Time – Map the work to dates • I want to answer questions • Are we doing what we need to? • Are we on time? • What’s changed? • I need a task list (scope) and a calendar (time) Context – What I need to see 1 2 3 4 … September
  • 10.
  • 11.
    11 • A one-dimensionalprioritized list of work to be done • One-Dimensional - a forced view, when applied, that produces a view of cascading effects Scope: Backlog – A Quick overview 1 2 3 4 5 6 7 … New Item MayJune Change in Date Something fell off How is it going to impact the project?
  • 12.
    12 • A one-dimensionalprioritized list of work to be done • One-Dimensional - a forced view, when applied, that produces a view of cascading effects • Prioritized List – A clear and unambiguous communication of priorities Scope: Backlog – A Quick overview 1 2 3 4 5 6 7 … Communicating broadly and often means delegation happens how you want, even when you don’t know it.
  • 13.
    13 • A one-dimensionalprioritized list of work to be done • One-Dimensional - a forced view, when applied, that produces a view of cascading effects • Prioritized List – A clear and unambiguous communication of priorities • Of Work – it needs to be aligned to effort limits Scope: Backlog – A Quick overview 1 2 3 4 5 6 7 … May
  • 14.
    14 • A one-dimensionalprioritized list of work to be done • One-Dimensional - a forced view, when applied, that produces a view of cascading effects • Prioritized List – A clear and unambiguous communication of priorities • Of Work – it needs to be aligned to effort • To be Done – The tasks are finite, with a clear definition of done Scope: Backlog – A Quick overview 1 2 3 4 5 6 7 … 12 days Added Started Completed
  • 15.
    15 Scope: Backlog –A Quick overview 1 2 3 4 5 6 7 … 1 2 3 4 … 1 2 3 4 … 1 2 3 4 … Product Feature 1 Feature 2 Feature 3Garden Vegetables Sheds Irrigation Irrigation Sheds Planters Lawn Paving Stone Gazebo BBQ Pit Map current Cap old lines Dig Trenches Lay pipe Prep location Install Shed 1 Xfer from old shed Tear down Old Relocate Boxes Gopher proof Soil Prep Planting
  • 16.
  • 17.
    17 A burn-up charttracks the date an item is added to the backlog to be done against the date of actual completion Scope and Time in One Shot 14 days Added Started Completed 12 days Added Started Completed 11 days Added Started Completed
  • 18.
    18 Time: Release Burn-upChart • Grey area - Items added to the list • Blue: Items Complete • Blue Line before today: average rate of completion • Blue line after today: forecast based on recent historical data
  • 19.
    19 Time: Release Burn-upChart Process Change for Consistency • Started then stagnated • New work in Mar, then again in May • Bug Jump in June • New intake process after review in Jun, resulting in more consistent data (More Predictability!) • This is a service rather than release, so stable consistency and predictability of response time and throughput is positive.
  • 20.
    20 Time: Release Burn-upChart The Out of Bounds Project • Steady intake with leveling in May • Increase in new work definition starting in Jun/July • Intake exceeds rate of work • Date projection extends beyond release date • Project work addition accelerating after August • Staff change in early Aug • Slows work progress during training • Accelerates at end of August
  • 21.
    21 Time: Release Burn-upChart New Manager on the Job • Aug 2017-Nov 2017 mirror pattern indicates deadline driven process with much work in parallel finishing just before deadline. • More consistent work pattern in Jan (new management) • Request lead time shrinks showing significant increase of response time (less gap means fast response) • Work done flattening mapped to better quality in delivery
  • 22.
    22 The No-estimates Disclaimer •In this model we used issue count only • It could be using story points with the same results and value delivery • No Estimates experiment (our finding) • over time story sizing becomes standardized at time of implementation • Early story estimates are wildly inaccurate and are corrected closer to time of implementation • In the end, using issue count history was faster, accurate and easier.
  • 23.
    23 Monte Carlo Simulation FutureProjections using Past Performance
  • 24.
    24 • With longranges of data, we can see how predictable our projects are • How well defined up front by number of tasks added after beginning • How consistently off by how widely varied that number is • What the productivity load is for the team • What the variance in that productivity is over time • With this we can say things like • A feature of this size will have a number of tasks, + 4-10 tasks added after start. • The team working on it finishes a task in 3, +- 1 days. • With these numbers we can predict future commitment risks. Looking Into the Future
  • 25.
    25 • Identify theranges • A feature of this size will have XX tasks, + 4-10 tasks added after start. • The team working on it finishes 3 tasks, +- 1 tasks per week. • Run a simulation • Use random numbers to come up with the manifested variances • Calculate the completion date based on simulation • Run the simulation 10,000 times • See what you end up with The Monte Carlo Simulation
  • 26.
    26 • Start dateJan 1, 2019 • Feature has XX tasks, + 4-10 tasks • Work time is 3+-1 days/task Our Simulation – How likely am I to be done by when? 1/15/2019 1/30/2019 2/15/2019 2/28/2019 3/15/2019 3/30/2019 0% 14% 61% 94% 99% 99% 20 Tasks
  • 27.
    27 • Start dateJan 1, 2019 • Feature has XX tasks, + 4-10 tasks • Work time is 3+-1 days/task 1/15/2019 1/30/2019 2/15/2019 2/28/2019 3/15/2019 3/30/2019 0% 0% 45% 83% 99% 99% 25 Tasks Our Simulation – How likely am I to be done by when?
  • 28.
    28 • Start dateJan 1, 2019 • Feature has XX tasks, + 4-10 tasks • Work time is 3+-1 days/task Our Simulation – How likely am I to be done by when? 1/15/2019 1/30/2019 2/15/2019 2/28/2019 3/15/2019 3/30/2019 0% 0% 2% 42% 83% 99% 40 Tasks
  • 29.
    29 Three tools Iuse to answer the question: How are we doing? • The Backlog: A one-dimensional prioritized list of work to be done • The Burn-up chart: a Powerful view of where we are and some of our behavior • The Monte Carlo Simulation: Using past performance to predict likelihood of success against a target All of this is about making any risk transparent as early and as quickly as possible. Wrap-up
  • 30.
    30 • How toI turn the information into action? Wrap-up 1/15/2019 1/30/2019 2/15/2019 2/28/2019 3/15/2019 3/30/2019 0.00% 0.00% 2.50% 42.50% 83.30% 99.90% Burn –up Chart Monte Carlo Simulation … and a little discipline.
  • 31.
  • 32.
    Q&A Hannah Flynn With: Moderatedby: Agile and Management Consultant, Motivational Speaker LinkedIn page: linkedin.com/miles-robinson-1b72154/ Email: scruminthedark@gmail.com Miles Robinson Site editor, Product Management Today LinkedIn page: linkedin.com/in/hannahmflynn Twitter ID: @prodmgmttoday Email: hannah@aggregage.com Website: productmanagementtoday.com www.productmanagementtoday.com/webinar-series/analytics-in-action www.projectmanagementupdate.com/webinar-series/analytics-in-action www.businessinnovationbrief.com/webinar-series/analytics-in-action