Download as PDF, PPTX


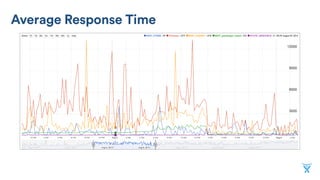


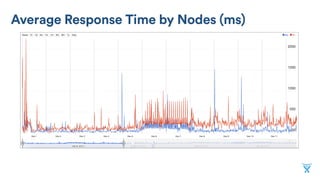
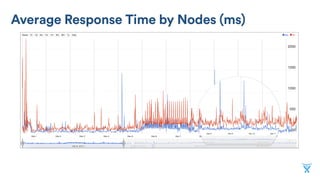


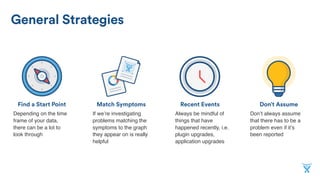


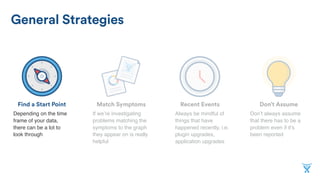


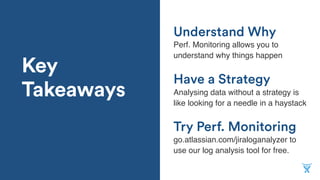

Luke Durkan's presentation focuses on the importance of performance monitoring in software development, particularly using Jira's log analysis tools. He shares insights from his experience at Atlassian, emphasizing the value of understanding performance metrics to quickly address issues. The talk also highlights strategies for analyzing performance data and the significance of contextualizing symptoms with recent changes in the system.