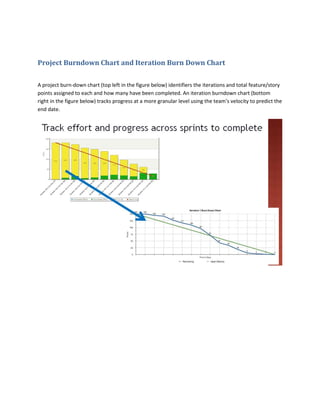
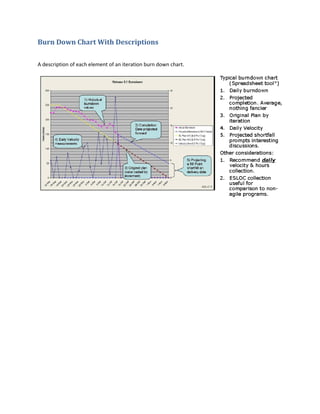
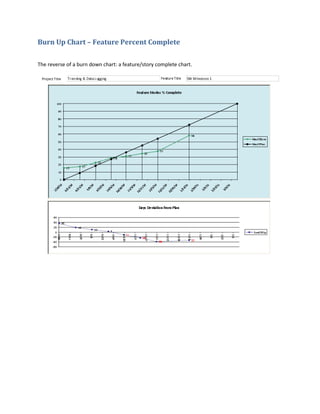
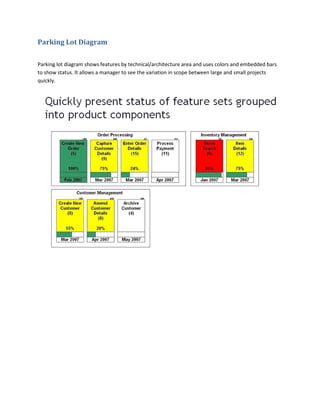
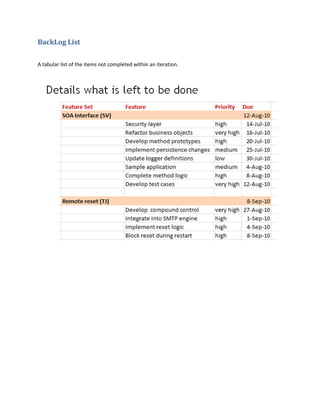
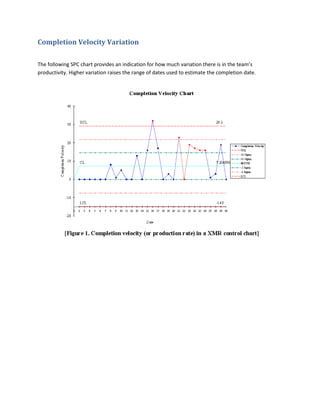
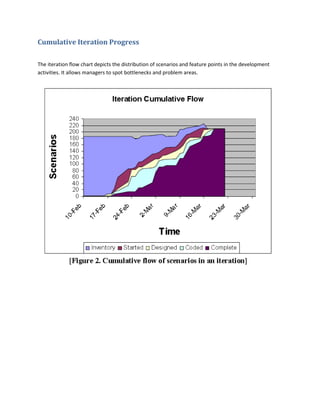
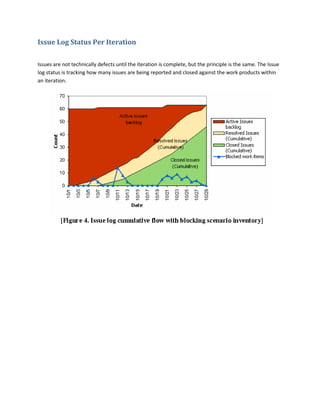
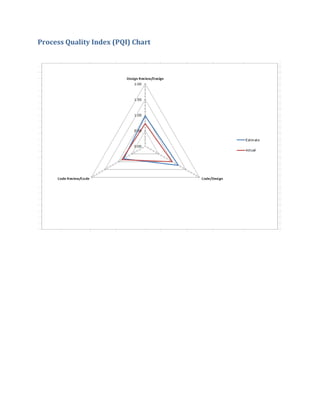
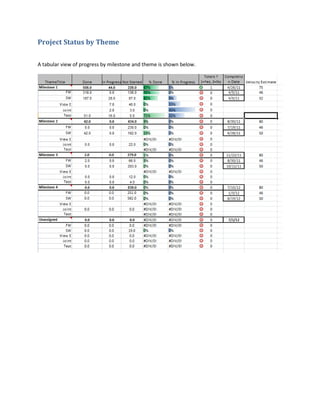
This document provides visual examples of common graphs used to measure and track progress on agile projects, including: burn down charts to track completion of features/stories over time against team velocity; burn up charts to show percent of features complete; parking lot, backlog list, and issue tracking charts; and charts to measure completion velocity variation and track progress by theme.