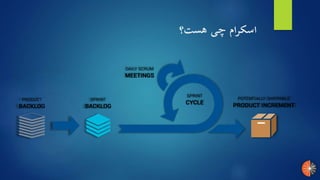
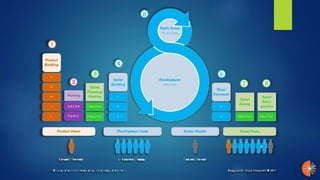
The document provides an overview of Scrum methodology in 8 stages:
1. Product backlog preparation
2. Phase segmentation
3. Sprint planning meeting
4. Sprint document preparation
5. Sprint execution
6. Sprint delivery
7. Sprint review
8. Sprint retrospective
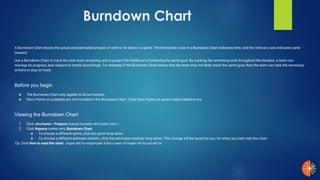
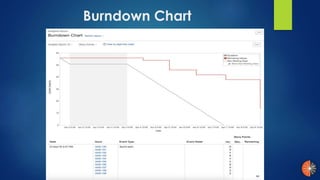
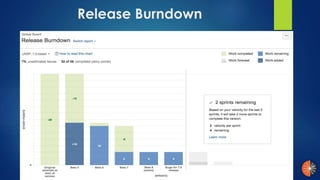
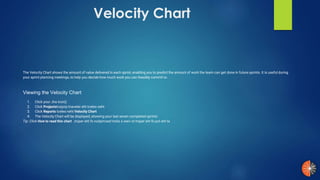
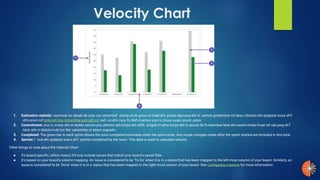
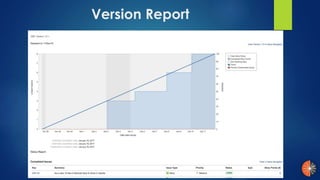
It describes each stage in detail and also discusses burndown charts which are used to track work remaining in a sprint.