Download to read offline


![16
Report Special Issue 2015
Position
2014
Country/Region
Total
capacity
end 2014
[MW]
Added
capacity
2014
[MW]
Growth
rate 2014
[%]
Installed
Capacity
per Capita
W/person
Installed
Capacity
per sqkm
kW/sqkm
Total
capacity
end 2013
[MW]
Total
capacity
end 2012
[MW]
Total
capacity
end 2011
[MW]
Total
capacity
end 2010
[MW]
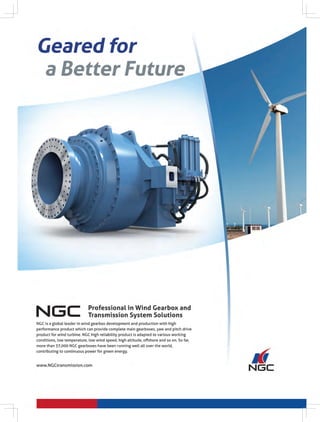
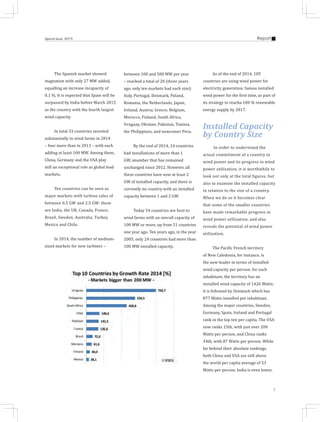
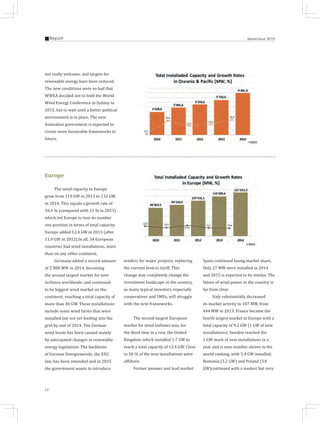
1 China 114'763.0 23'350.0 25.7 84.7 12.0 91'324.0 75'324.0 62'364.0 44'733.0
2 United States 65'754.0 4'854.0 7.6 206.2 6.7 61'108.0 59'882.0 46'919.0 40'180.0
3 Germany 40'468.0 5'808.0 16.8 499.6 113.3 34'660.0 31'315.0 29'075.0 27'215.0
4 Spain 22'986.5 27.5 0.1 481.5 45.5 22'959.0 22'796.0 21'673.0 20'676.0
5 India * 22'465.0 2'315.1 11.5 18.2 6.8 20'150.0 18'321.0 15'880.0 13'065.8
6 United Kingdom 12'440.3 1'736.4 16.1 195.2 51.0 10'710.9 8'635.9 6'018.0 5'203.8
7 Canada 9'694.0 1'871.0 25.9 278.3 1.0 7'698.0 6'201.0 5'265.0 4'008.0
8 France 9'296.0 1'042.0 12.6 140.3 14.4 8'254.0 7'499.8 6'607.6 5'628.7
9 Italy 8'662.8 107.5 1.3 140.4 28.7 8'551.0 8'144.0 6'737.0 5'797.0
10 Brazil 5'961.6 2'495.5 72.0 29.4 0.7 3'466.1 2'507.0 1'429.0 930.0
11 Sweden 5'425.0 1'050.0 21.4 557.9 12.0 4'470.0 3'745.0 2'798.0 2'052.0
12 Portugal * 4'953.0 229.0 4.0 454.4 53.4 4'724.0 4'525.0 4'083.0 3'702.0
13 Denmark 4'883.0 111.0 2.3 876.8 113.3 4'772.0 4'162.0 3'927.0 3'734.0
14 Poland 3'834.0 444.0 13.1 100.0 12.3 3'390.0 2'497.0 1'616.4 1'179.0
15 Australia 3'806.0 757.0 24.8 169.1 0.5 3'049.0 2'584.0 2'226.0 1'880.0
16 Turkey 3'763.0 804.0 27.2 46.1 4.8 2'959.0 2'312.0 1'799.0 1'274.0
17 Romania 3'220.0 437.0 15.7 148.2 12.6 2'783.0 1'905.0 826.0 591.0
18 Netherlands 2'805.0 141.0 4.2 166.2 67.5 2'693.0 2'391.0 2'328.0 2'269.0
19 Japan * 2'788.0 130.4 4.5 21.9 7.4 2'669.0 2'614.0 2'501.0 2'304.0
20 Mexico 2'551.0 559.0 28.1 21.2 1.3 1'992.0 1'348.0 929.0 521.0
21 Ireland 2'272.0 222.0 10.9 470.1 32.1 2'049.0 1'738.0 1'631.0 1'428.0
22 Austria 2'095.0 411.0 24.4 254.8 25.0 1'684.0 1'378.0 1'084.0 1'010.6
23 Greece 1'980.0 114.0 6.2 183.7 15.0 1'865.0 1'749.0 1'626.5 1'208.0
24 Belgium 1'959.0 308.0 18.7 187.5 64.2 1'651.0 1'375.0 1'078.0 886.0
25 Norway 856.0 88.0 11.5 166.3 2.6 768.0 703.0 520.0 434.6
26 Chile 836.0 502.0 149.6 48.1 1.1 335.0 190.0 190.0 170.0
27 Morocco 787.0 300.0 61.6 23.9 1.8 487.0 291.0 291.0 286.0
28 Bulgaria 691.0 10.0 1.5 99.8 6.2 681.0 674.0 503.0 499.0
29 Chinese Taipei 633.0 18.8 3.1 27.1 17.6 614.2 563.8 563.8 518.7
30 Finland 627.0 179.0 40.0 119.0 1.9 448.0 288.0 197.0 197.0
31 New Zealand 623.0 0.0 0.0 141.5 2.3 623.0 622.8 622.8 506.0
32 Egypt 616.0 66.0 12.0 7.1 0.6 550.0 550.0 550.0 550.0
33 Korea, South 609.0 47.7 8.5 12.4 6.1 561.3 482.6 406.3 379.3
34 South Africa 570.0 468.0 458.8 11.8 0.5 102.0 10.1 10.1 10.0
35 Uruguay 529.4 470.0 792.7 158.8 3.0 59.3 55.7 40.5 30.5
36 Ukraine 409.5 126.3 34.0 9.2 0.7 371.0 276.0 151.1 87.4
37 Croatia 347.0 45.0 14.9 77.6 6.1 302.0 180.0 131.0 89.0
38 Hungary 329.4 0.0 0.0 33.2 3.5 329.4 329.4 329.4 295.0
39 Estonia 302.7 22.7 8.1 240.6 6.7 280.0 269.0 184.0 149.0
40 Czech Republic 283.0 14.0 5.2 26.6 3.6 269.0 260.0 217.0 215.0
41 Lithuania 279.0 0.0 0.0 79.6 4.3 279.0 225.0 179.0 163.0
42 Argentina 271.0 53.0 24.8 6.3 0.1 217.1 140.9 129.2 54.0
43 Pakistan 256.0 150.0 141.5 1.3 0.3 106.0 106.0 6.0 6.0
44 Tunisia 245.0 141.0 135.6 22.4 1.5 104.0 104.0 54.0 54.0
45 Thailand 223.0 30.0 15.5 3.3 0.3 193.0 112.0 8.0 0.0
46 Philippines 216.0 183.0 554.5 2.0 0.7 33.0 33.0 33.0 33.0](https://image.slidesharecdn.com/bulletinwind2015-151203175258-lva1-app6891/85/Bulletin-wind-energy-2014-18-320.jpg)
![17
ReportSpecial Issue 2015
Position
2014
Country/Region
Total
capacity
end 2014
[MW]
Added
capacity
2014
[MW]
Growth
rate 2014
[%]
Installed
Capacity
per Capita
W/person
Installed
Capacity
per sqkm
kW/sqkm
Total
capacity
end 2013
[MW]
Total
capacity
end 2012
[MW]
Total
capacity
end 2011
[MW]
Total
capacity
end 2010
[MW]
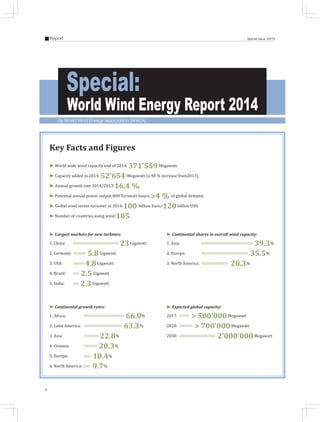
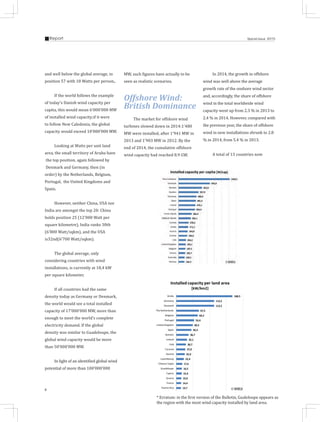
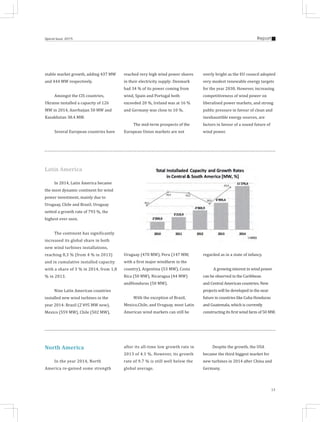
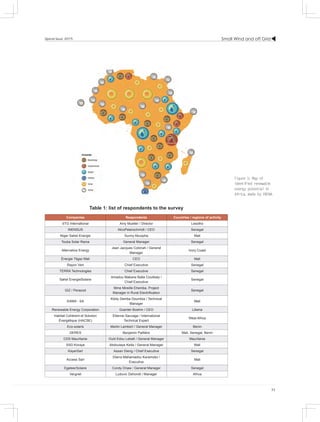
47 Costa Rica 198.0 50.0 33.6 41.6 3.9 148.2 148.2 148.2 123.0
48 Nicaragua 186.0 44.4 31.4 31.8 1.4 141.6 102.0 63.0 63.0
49 Ethiopia 171.0 0.0 0.0 1.8 - 171.0 51.0 30.0 0.0
50 Honduras 152.0 50.0 49.0 17.7 1.4 102.0 102.0 70.0 0.0
51 Peru 148.0 147.3 ∞ 4.9 0.1 0.7 0.7 0.7 0.7
52 Cyprus 147.0 0.0 0.0 125.4 15.9 147.0 147.0 134.0 82.0
53 Puerto Rico 125.0 0.0 0.0 34.5 13.7 125.0 125.0 0.0 0.0
54 Iran 117.5 17.5 17.5 1.5 0.1 100.0 100.0 100.0 100.0
55 Dominican Republic 85.3 0.0 0.0 8.2 0.7 85.3 33.6 33.6 0.2
56 Latvia 68.0 0.0 0.0 31.4 1.1 68.0 68.0 31.0 30.0
57 Switzerland 60.3 0.0 0.0 7.5 1.5 60.3 50.0 45.5 42.3
58 Luxembourg 58.0 0.0 0.0 111.4 22.4 58.0 58.0 44.0 44.0
59 Mongolia 50.9 0.0 0.0 17.2 - 50.9 1.3 1.3 1.3
60 Jamaica 47.7 0.0 0.0 16.3 4.3 47.7 47.7 47.7 29.7
61 New Caledonia 38.2 0.0 0.0 1426.2 2.1 38.2 38.2 38.2 38.2
62 Vietnam 31.0 0.0 0.0 0.3 0.1 31.0 31.0 31.0 31.0
63 Aruba 30.0 0.0 0.0 271.1 168.5 30.0 30.0 30.0 30.0
64 Venezuela 30.0 0.0 0.0 1.0 - 30.0 30.0 0.0 0.0
65 Guadeloupe 26.8 0.0 0.0 5.90 16.5 26.8 26.8 26.8 26.8
66 Cabo Verde 25.5 0.0 0.0 47.4 6.3 25.5 25.5 25.5 2.8
67 Reunion Island 23.4 0.0 0.0 27.8 9.3 23.4 23.4 23.4 23.4
68 Colombia 19.5 0.0 0.0 0.4 - 19.5 19.5 19.5 19.5
69 Ecuador 19.0 0.0 0.0 1.2 0.1 19.0 2.5 2.5 2.5
70 Faroe Islands 18.3 14.3 357.5 366.4 13.1 4.0 4.0 4.0 4.0
71 Russia 16.8 0.0 0.0 0.1 - 16.8 16.8 16.8 15.4
72 Guyana 13.5 0.0 0.0 18.4 0.1 13.5 13.5 13.5 13.5
73 Curacao 12.0 0.0 0.0 81.7 27.0 12.0 12.0 12.0 12.0
74 Cuba 11.7 0.0 0.0 1.1 0.1 11.7 11.7 11.7 11.7
75 Bonaire 10.8 0.0 0.0 652.9 36.7 10.8 10.8 10.8 10.8
76 Algeria 10.1 0.0 0.0 0.3 - 10.1 0.1 0.1 0.1
77 Fiji 10.0 0.0 0.0 11.1 0.5 10.0 10.0 10.0 10.0
78 Dominica 7.2 0.0 0.0 98.0 9.6 7.2 7.2 7.2 7.2
79 Israel 6.0 0.0 0.0 0.8 0.3 6.0 6.0 6.0 6.0
80 Belarus 3.4 0.0 0.0 0.4 - 3.4 3.4 3.4 3.4
81 Nigeria 3.2 1.0 45.5 - - 2.2 2.2 2.2 2.2
82 Iceland 3.0 1.2 66.7 9.5 - 1.8 1.8 0.0 0.0
83 Slovakia 3.0 0.0 0.0 0.6 0.1 3.0 3.0 3.0 3.0
84 Vanuatu 3.0 0.0 0.0 11.2 0.2 3.0 3.0 3.0 3.0
85 St. Kitts and Nevis 2.2 0.0 0.0 40.6 8.4 2.2 2.2 2.2 0.0
86 Azerbaijan 2.0 0.0 0.0 0.2 - 2.0 2.0 2.0 0.0
87 Kazakhstan 2.0 0.0 0.0 0.1 - 2.0 2.0 2.0 0.5
88 Antarctica 1.6 0.0 0.0 - - 1.6 1.6 1.6 1.6
89 Jordan 1.5 0.0 0.0 0.2 - 1.5 1.5 1.5 1.5
90 Indonesia 1.4 0.0 0.0 - - 1.4 1.4 1.4 1.4
91 Madagascar 1.2 0.0 0.0 0.1 - 1.2 1.2 1.2 0.0
92 Martinique 1.1 0.0 0.0 2.8 1.0 1.1 1.1 1.1 1.1](https://image.slidesharecdn.com/bulletinwind2015-151203175258-lva1-app6891/85/Bulletin-wind-energy-2014-19-320.jpg)
![18
Report Special Issue 2015
Position
2014
Country/Region
Total
capacity
end 2014
[MW]
Added
capacity
2014
[MW]
Growth
rate 2014
[%]
Installed
Capacity
per Capita
W/person
Installed
Capacity
per sqkm
kW/sqkm
Total
capacity
end 2013
[MW]
Total
capacity
end 2012
[MW]
Total
capacity
end 2011
[MW]
Total
capacity
end 2010
[MW]
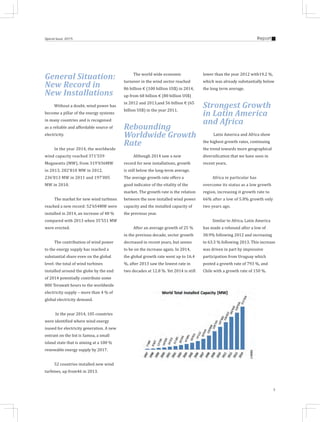
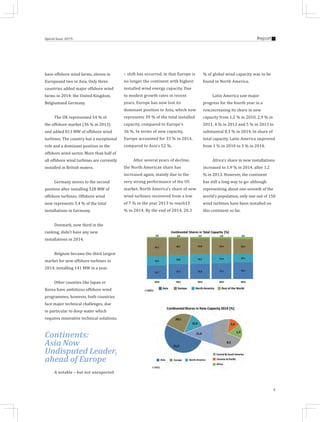
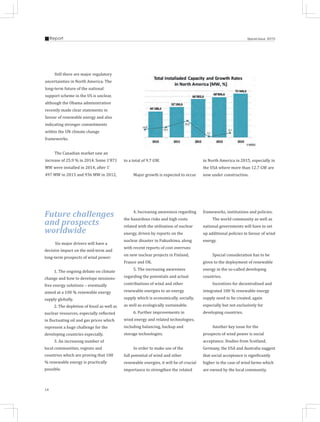
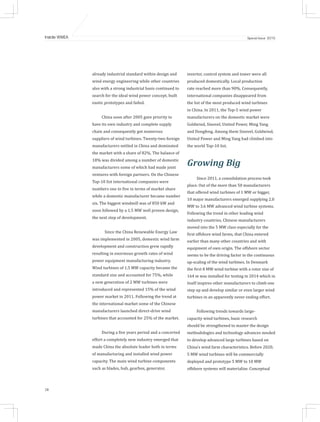
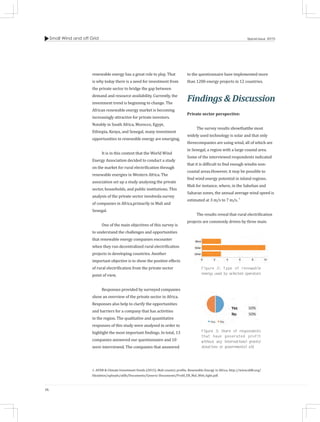
93 Mauritus 1.1 0.0 0.0 0.8 0.5 1.1 1.1 1.1 0.0
94 Falkland Islands 1.0 0.0 0.0 341.1 0.1 1.0 1.0 1.0 1.0
95 United Arab Emirates 0.9 0.0 0.0 0.2 - 0.9 1.0
96 Eritrea 0.8 0.0 0.0 0.1 - 0.8 0.8 0.8 0.8
97 Grenada 0.7 0.0 0.0 6.4 2.0 0.7 0.7 0.7 0.7
98 St. Pierre-et-M. 0.6 0.0 0.0 101.9 2.5 0.6 0.6 0.6 0.6
99 Syria 0.6 0.0 0.0 - - 0.6 0.6 0.6 0.6
100 Samoa 0.5 0.5 ∞ 2.5 - 0.0 0.0 0.0 0.0
101 Namibia 0.2 0.0 0.0 0.1 - 0.2 0.2 0.2 0.2
102 North Korea 0.2 0.0 0.0 - - 0.2 0.2 0.2 0.2
103 Afghanistan 0.1 0.0 0.0 - - 0.1 0.1 - -
104 Bolivia 0.1 0.0 0.0 - - 0.1 0.1 0.1 0.1
105 Nepal 0.1 0.0 0.0 - - 0.1 0.1 - -
Total 371'374 52'565 16.4 318'530 282'608 236'803 197'004
Photo: Tian yucai](https://image.slidesharecdn.com/bulletinwind2015-151203175258-lva1-app6891/85/Bulletin-wind-energy-2014-20-320.jpg)


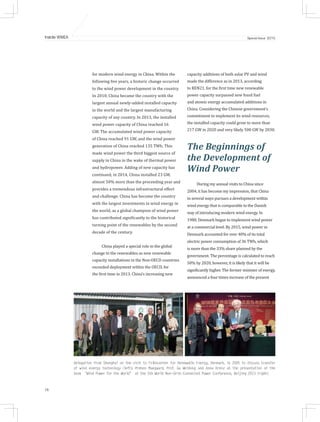
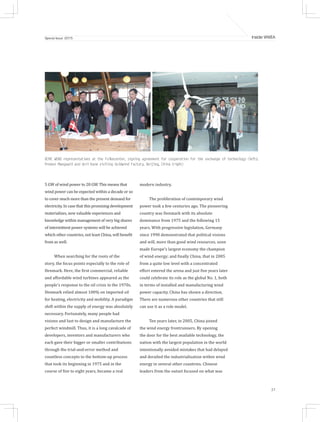


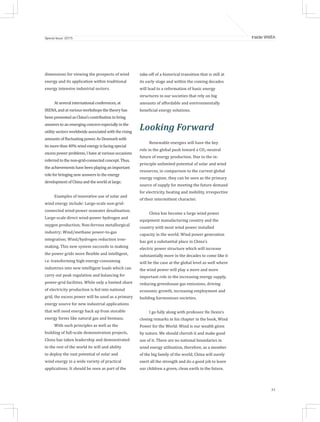

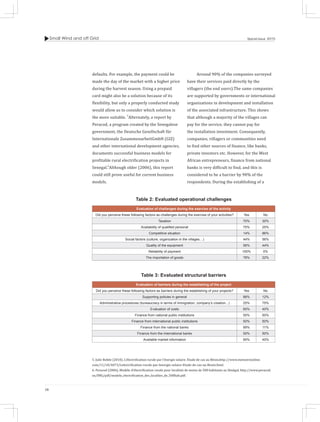
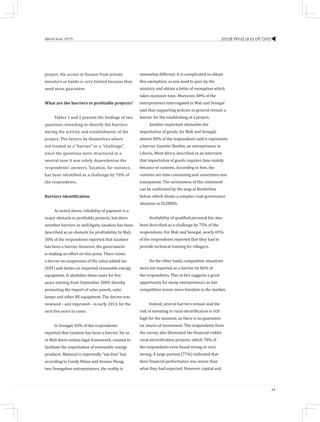
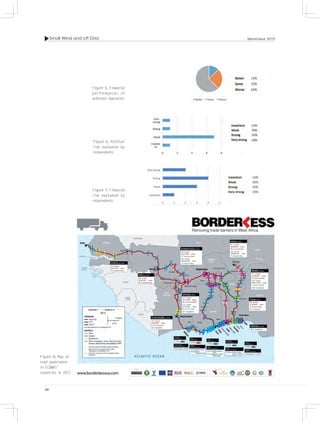
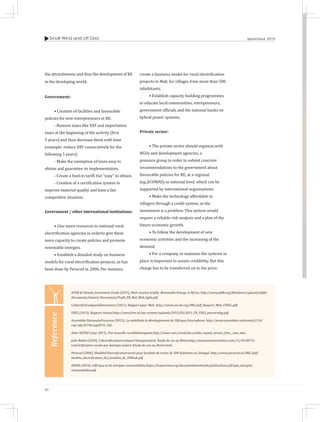

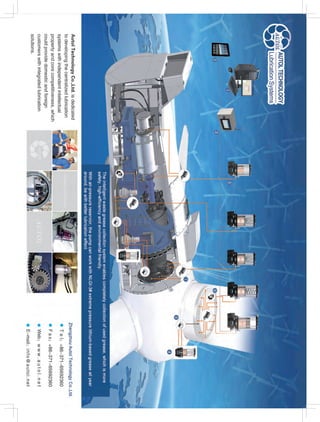
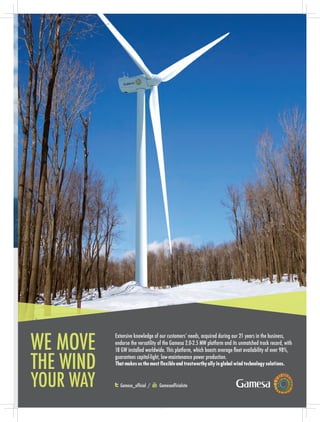


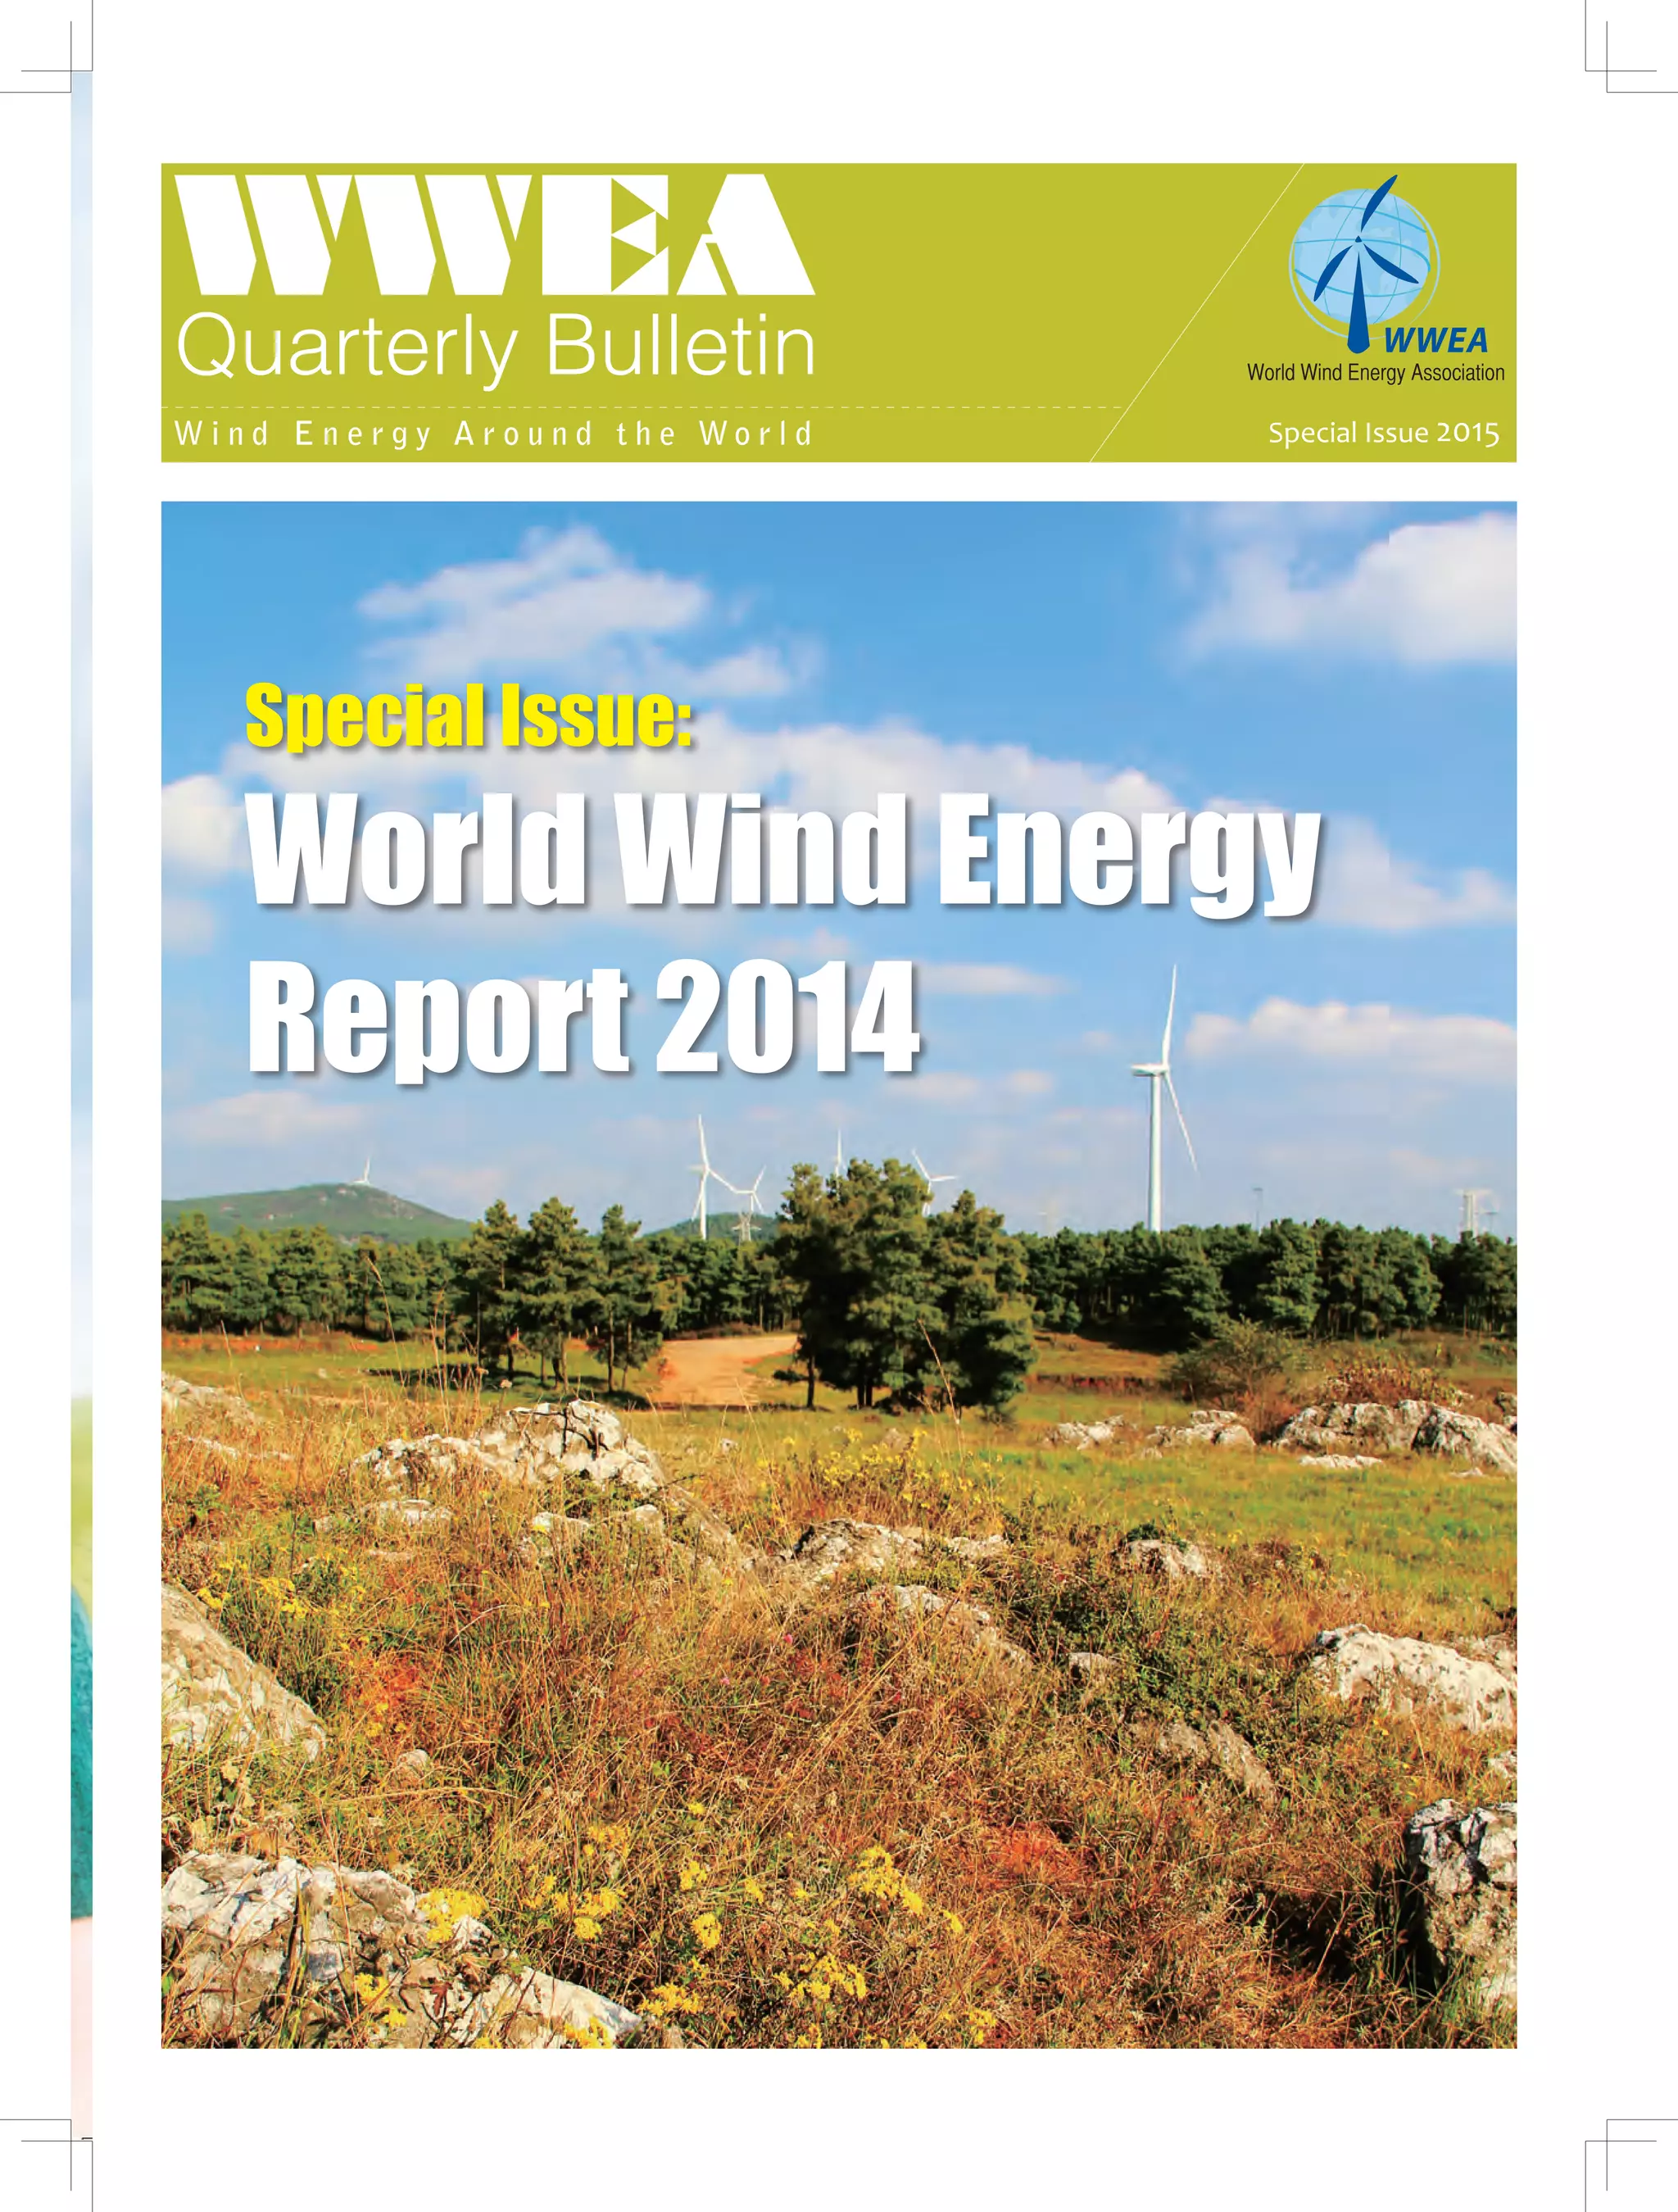
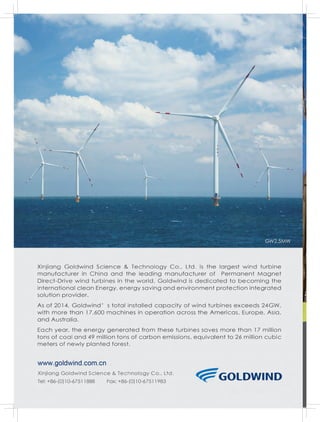
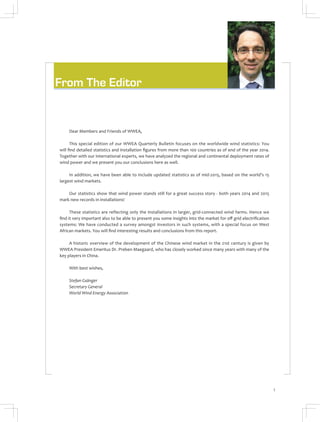
The document provides statistics and analysis on global wind energy development in 2014 and the first half of 2015. Some key findings include: - Global wind capacity reached 371,559 megawatts at the end of 2014, a 16.4% annual growth rate. - A record 52,654 megawatts of new wind capacity was installed in 2014, led by China, Germany, and the US. - Growth rates were highest in Latin America and Africa, at over 60%. - Offshore wind grew but slowed compared to prior years, with the UK dominating nearly half the offshore market.


