Download as PDF, PPTX


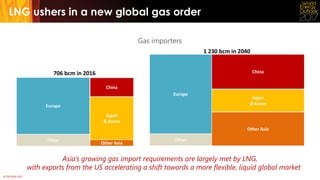
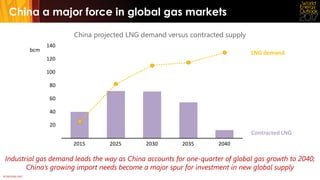
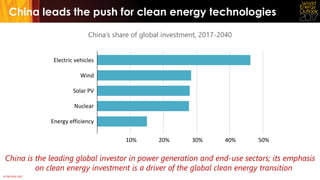
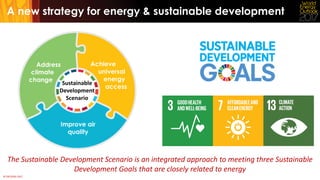
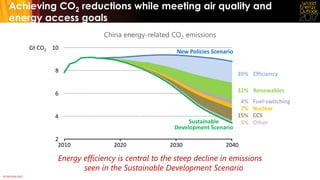
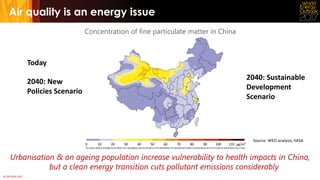
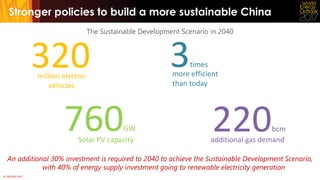
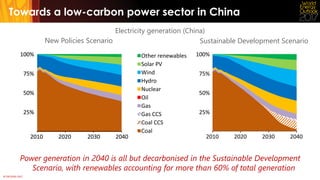

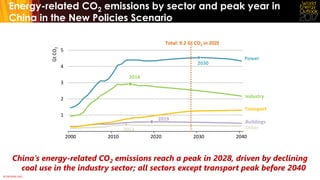
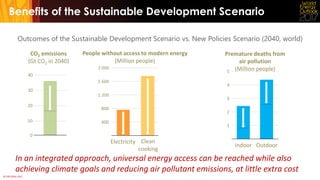
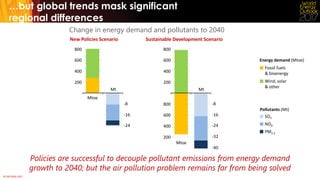

1) China is transitioning to a cleaner energy system focused on renewable energy like solar and wind power, which will have significant domestic and global implications. 2) China is on track to become the world's largest gas importer and will be a major driver of global gas markets and LNG trade. 3) The report analyzes pathways for China to peak its carbon emissions by 2028 and achieve its climate goals in a way that also expands energy access and reduces air pollution, showing the importance of an integrated approach.