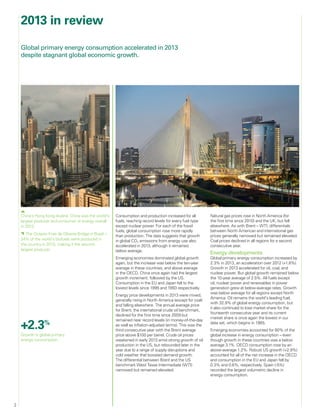
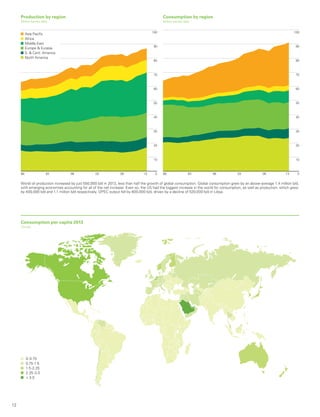
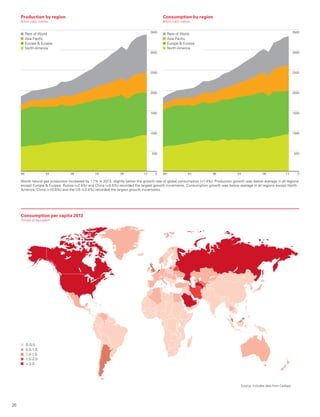
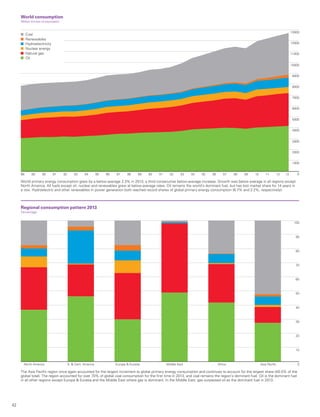
Global energy consumption grew at an accelerated rate in 2013 despite stagnant economic growth. Consumption increased for all fuels except nuclear power and reached record levels. Emerging economies accounted for 80% of growth, led by China, but growth was below the 10-year average in these countries. The US saw the largest increase in oil production in the world and offset supply disruptions elsewhere. Natural gas consumption growth was below average globally except in North America. Coal consumption grew the fastest of the fossil fuels.
The 2015 edition of the BP Statistical Review of World Energy, launched today, highlights how significant changes in global energy production and consumption have had profound implications for prices, for the global fuel mix, and for global carbon dioxide emissions. The 64th annual edition of the Statistical Review highlights the continuing importance of the US shale revolution, with the US overtaking Saudi Arabia as the world’s biggest oil producer and surpassing Russia as the world’s largest producer of oil and gas.
The 65th edition of the BP Statistical Review of World Energy sets out energy data for 2015, revealing a year in which significant long-term trends in both the global demand and supply of energy came to the fore with global energy consumption slowing further and the mix of energy sources shifting towards lower-carbon fuels.
A factsheet with a summary version for many of the findings in the WEO report, published Nov. 2012. The report is an annual publication by the International Energy Agency. The 2012 version calls attention to the world-changing impact of hydraulic fracturing of shale gas and oil deposits in North America. Its worldwide impact, according to the report, is profound.
The annual Energy Outlook reflects our best effort to describe a “most likely” trajectory of the global energy system, based on our views of likely economic and population growth, as well as developments in policy and technology
This 2015 edition updates our view of the likely path of global energy markets to 2035. We make assumptions on changes in policy, technology and the economy, based on extensive internal and external consultations, using a range of analytical tools to build a single “most likely” view.
The Outlook highlights the continuous change in the energy system – the changing fuel mix, the changing patterns of trade – as it adapts to meet the world’s growing energy needs. It also highlights the challenge of delivering energy supplies which are sustainable, secure and affordable. The Outlook emphasizes the role of competition and market forces in driving technology and innovation to help us meet that challenge.
An All-of-the-Above Energy Strategy as a Path to Sustainable Economic GrowthMarcellus Drilling News
A bull crap 42-page report from the Obama White House on his brilliant plans to limit carbon. Oh, and a small bone that "yeah, fracking is OK, for now" thrown in. More erroneous stupidity based on global warming hoaxary. But that's what we come to expect from radicals and the rules they want to enforce on us all.
The BP Energy Outlook outlines the “most likely” path for the global energy landscape - supply and demand - over the next 20 years. Read the full report here
BP's annual energy forecast. This is the first year they've stretched the timeline--from 2030 to 2035. According to BP forecasters, global energy demand will rise 41% from now until 2035 with 95% of that growth coming from "emerging economies." Also, gas as a source of energy is growing fastest for fossil fuels and by 2035 is expected to be at parity with coal--each providing about 27% of power needs in 2035. BP says shale gas will make up 68% of U.S. gas production by 2035.
A report published by the Cleveland Fed researchers that examines national and Fourth District (KY, OH, WV, PA) trends in energy production and prices.
Statistical Review of World Energy 2021 Full report - BPAbdelmounimTOUILEB
The COVID-19 pandemic had a dramatic impact
on energy markets, with both primary energy
and carbon emissions falling at their fastest rates
since the Second World War. Nevertheless,
renewable energy continued to grow, with solar
power recording its largest ever increase.
This is the booklet that accompanies BP's Energy Outlook 2030 presentation.
We hope that sharing this outlook contributes to the wider debate on global energy issues. It identifies long-term energy trends, building on our Statistical Review of World Energy, and then develops projections for world energy markets to 2030, taking account of the potential evolution of the world economy, policy, and technology.
The outlook reflects a ‘to the best of our knowledge’ assessment of the world’s likely path from today’s vantage point, drawing on expertise both within and outside the company. It is not a statement about how we would like the market to evolve.
The outlook highlights the growing role of developing economies in global energy consumption, and the increasing share of non-fossil fuels in global energy supply. It emphasizes the importance of both improving energy efficiency and expanding energy supplies to meet the energy needs of billions of people who aspire to better lifestyles, and doing so in a way that is sustainable and secure. This year’s edition has a special focus on the role of shale gas and tight oil in supporting the growth of gas and oil supply. It also notes the uncertainties attached to any long term projection. The discipline of building a numerical projection sharpens our thinking, but the precise numbers are less important than the underlying story of the challenges we all face and the choices we make in producing and consuming energy.
For more information and to download summary tables in Excel format, please visit: http://bit.ly/BPEO2013
https://www.eia.gov/outlooks/ieo/pdf/0484(2017).pdf
International Energy Outlook 2017
World energy consumption is projected to increase by 28% by 2040, according to the International Energy Outlook 2017 (IEO2017), released today by the U.S. Energy Information Administration (EIA). Most of the world’s growth in energy demand is projected to take place in countries outside of the Organization for Economic Cooperation and Development (OECD). China and the other non-OECD Asia nations alone account for more than 60% of the projected increase in world energy demand
Oil has for decades been perceived as a necessary and highly addictive energy commodity, fueling the world economy. It is a crucial input good for most of the net-oil consumer countries, and it is an important source of revenue for the net-oil supplier countries. This means that any changes in the oil price will affect the entire world economy. Chloé Le Coq and Zorica Trkulja from Stockholm Institute of Transition Economics have written a policy brief that explains to what extent the oil-price fluctuations matter for the economy.
Read more: https://www.hhs.se/site
BP's annual report characterizing current and predicted future energy usage across the planet. BP looks at not only oil and gas, but renewables, nuclear, hydro and other sources as well. BP predicts natgas consumption will continue to grow.
A summary of the climate change protection movement in the U.S. and action needed to further reduce greenhouse gasses and create a clean energy future. Progress has been inadequate. The war against the climate change crisis demands higher priority and more urgent attention by U.S. policy makers, law makers, the business community and citizens.
The BP Energy Outlook 2035 is our 2014 projection for the world's energy future.
This year's outlook reveals that global energy demand continues to grow but that growth is slowing and will mainly be driven by emerging economies - led by China and India.
Shares of the major fossil fuels are converging, with oil, natural gas and coal each expected to make up around 27 per cent of the total mix by 2035 and the remaining share coming from nuclear, hydroelectricity and renewables.
Watch the video to see what else 2035 could bring for the energy industry. To find out more about the BP Energy Outlook 2035, visit http://www.bp.com/energyoutlook
The Executive Summary for the IEA's 2015 Annual Medium-Term Gas Market Report. This year's report predicts global demand for natural gas will slightly decrease to 2% per year, down from 2014's prediction of 2.3% per year. Why? Asia's demand for natgas will decrease over the next five years. Implication: Some U.S. LNG export facilities will get delayed or even canceled.
The Outlook reveals that global energy consumption is expected to rise by 41 per cent from 2012 to 2035 - compared to 52 per cent over the last twenty years and 30 per cent over the last ten. Ninety five per cent of the growth in demand is expected to come from the emerging economies, while energy use in the advanced economies of North America, Europe and Asia as a group is expected to grow only very slowly – and begin to decline in the later years of the forecast period.
A study released by the analysts at consulting firm Deloitte that looks at the top issues facing the oil and gas sector. The study finds that within the next 5-6 years surging shale oil and natural gas production in the U.S. will "cut deeply" into OPEC's influence on setting world oil prices.
BP Energy Outlook
The Energy Outlook explores the forces shaping the global energy transition out to 2040 and the key uncertainties surrounding that transition. It shows how rising prosperity drives an increase in global energy demand and how that demand will be met over the coming decades through a diverse range of supplies including oil, gas, coal and renewables.
Annual report from BP looking at their best guesses about where energy, of all kinds, is heading from now until 2035. In this year's report, BP predicts (1) By 2035, across the entire world, 80% of all energy will come from fossil fuels. (2) Natural gas is the largest-growing fossil fuel and by 2035 it will have replaced coal as the #2 source of energy in the world. (3) The U.S. will achieve overall energy self-sufficiency by 2021, and oil self-sufficiency by 2030.
The theme for this quarter is apprehension. In September, the US Federal Reserve announced a third 75 basis point increase in the federal funds rate. In the aftermath, the two-year treasury rate reached the highest level since before the 2008 financial crisis and the spread between two and ten-year rates went below negative 50basis points for the first time since the early eighties. Equity markets have begun to price in the likelihood of a recession and, if history is any indication, the impact on oil markets could be profound.
The Big Oil Reality Check report finds that the climate pledges and plans of 8 international oil and gas companies fail to align with international agreements to phase out fossil fuels and to limit global temperature rise to 1.5ºC.
Publication May 2021
IEA publication, May 2024
Critical minerals, which are essential for a range of clean energy technologies, have risen up the policy agenda in recent years due to increasing demand, volatile price movements, supply chain bottlenecks and geopolitical concerns. The dynamic nature of the market necessitates greater transparency and reliable information to facilitate informed decision-making, as underscored by the request from Group of Seven (G7) ministers for the IEA to produce medium- and long-term outlooks for critical minerals.
The Global Critical Minerals Outlook 2024 follows the IEA’s inaugural review of the market last year. It provides a snapshot of industry developments in 2023 and early 2024 and offers medium- and long-term outlooks for the demand and supply of key energy transition minerals based on the latest technology and policy trends.
The report also assesses key risks to the reliability, sustainability and diversity of critical mineral supply chains and analyses the consequences for policy and industry stakeholders. It will be accompanied by an updated version of the Critical Minerals Data Explorer, an interactive online tool that allows users to explore the latest IEA projections.
Science Publication
Global projections of macroeconomic climate-change damages typically consider
impacts from average annual and national temperatures over long time horizons1–6
.
Here we use recent empirical fndings from more than 1,600 regions worldwide over
the past 40 years to project sub-national damages from temperature and precipitation,
including daily variability and extremes7,8
. Using an empirical approach that provides
a robust lower bound on the persistence of impacts on economic growth, we fnd that
the world economy is committed to an income reduction of 19% within the next
26 years independent of future emission choices (relative to a baseline without
climate impacts, likely range of 11–29% accounting for physical climate and empirical
uncertainty). These damages already outweigh the mitigation costs required to limit
global warming to 2 °C by sixfold over this near-term time frame and thereafter diverge
strongly dependent on emission choices. Committed damages arise predominantly
through changes in average temperature, but accounting for further climatic
components raises estimates by approximately 50% and leads to stronger regional
heterogeneity. Committed losses are projected for all regions except those at very
high latitudes, at which reductions in temperature variability bring benefts. The
largest losses are committed at lower latitudes in regions with lower cumulative
historical emissions and lower present-day income.
Science Publication: The atlas of unburnable oil for supply-side climate poli...Energy for One World
Nature Communication, Publication 2024
To limit the increase in global mean temperature to 1.5 °C, CO2 emissions must
be drastically reduced. Accordingly, approximately 97%, 81%, and 71% of
existing coal and conventional gas and oil resources, respectively, need to
remain unburned. This article develops an integrated spatial assessment
model based on estimates and locations of conventional oil resources and
socio-environmental criteria to construct a global atlas of unburnable oil. The
results show that biodiversity hotspots, richness centres of endemic species,
natural protected areas, urban areas, and the territories of Indigenous Peoples
in voluntary isolation coincide with 609 gigabarrels (Gbbl) of conventional oil
resources. Since 1524 Gbbl of conventional oil resources are required to be left
untapped in order to keep global warming under 1.5 °C, all of the above-
mentioned socio-environmentally sensitive areas can be kept entirely off-
limits to oil extraction. The model provides spatial guidelines to select
unburnable fossil fuels resources while enhancing collateral socio-
environmental benefits.
Oprah Winfrey: A Leader in Media, Philanthropy, and Empowerment | CIO Women M...CIOWomenMagazine
This person is none other than Oprah Winfrey, a highly influential figure whose impact extends beyond television. This article will delve into the remarkable life and lasting legacy of Oprah. Her story serves as a reminder of the importance of perseverance, compassion, and firm determination.
Modern Database Management 12th Global Edition by Hoffer solution manual.docxssuserf63bd7
https://qidiantiku.com/solution-manual-for-modern-database-management-12th-global-edition-by-hoffer.shtml
name:Solution manual for Modern Database Management 12th Global Edition by Hoffer
Edition:12th Global Edition
author:by Hoffer
ISBN:ISBN 10: 0133544613 / ISBN 13: 9780133544619
type:solution manual
format:word/zip
All chapter include
Focusing on what leading database practitioners say are the most important aspects to database development, Modern Database Management presents sound pedagogy, and topics that are critical for the practical success of database professionals. The 12th Edition further facilitates learning with illustrations that clarify important concepts and new media resources that make some of the more challenging material more engaging. Also included are general updates and expanded material in the areas undergoing rapid change due to improved managerial practices, database design tools and methodologies, and database technology.
The Team Member and Guest Experience - Lead and Take Care of your restaurant team. They are the people closest to and delivering Hospitality to your paying Guests!
Make the call, and we can assist you.
408-784-7371
Foodservice Consulting + Design
Artificial intelligence (AI) offers new opportunities to radically reinvent the way we do business. This study explores how CEOs and top decision makers around the world are responding to the transformative potential of AI.
Bp statistical-review-of-world-energy-2014-full-report
1. BP Statistical Review
ofWorld Energy
June 2014
bp.com/statisticalreview
#BPstats
Introduction
1 Group chief executive’s introduction
2 2013 in review
Oil
6 Reserves
8 Production and consumption
15 Prices
16 Refining
18 Trade movements
Natural gas
20 Reserves
22 Production and consumption
27 Prices
28 Trade movements
Coal
30 Reserves and prices
32 Production and consumption
Nuclear energy
35 Consumption
Hydroelectricity
36 Consumption
Renewable energy
38 Other renewables consumption
39 Biofuels production
Primary energy
40 Consumption
41 Consumption by fuel
Appendices
44 Approximate conversion factors
44 Definitions
45 More information
63rd
edition
2. Disclaimer
The data series for proved oil and gas reserves in BP Statistical Review of World Energy June 2014 does not
necessarily meet the definitions, guidelines and practices used for determining proved reserves at company
level, for instance, under UK accounting rules contained in the Statement of Recommended Practice,
‘Accounting for Oil and Gas Exploration, Development, Production and Decommissioning Activities’ (UK SORP)
or as published by the US Securities and Exchange Commission, nor does it necessarily represent BP’s view of
proved reserves by country. Rather, the data series has been compiled using a combination of primary official
sources and third-party data.
Find more online
For 63 years, the BP Statistical Review of World Energy has
provided high-quality objective and globally consistent data on
world energy markets. The review is one of the most widely
respected and authoritative publications in the field of energy
economics, used for reference by the media, academia, world
governments and energy companies. A new edition is published
every June.
Other features include:
Energy economics blog
Regular blogs on energy economics.
bp.com/energyeconomics
Energy Outlook
Watch the BP Energy Outlook 2035
– January 2014 video, containing our
projections of long-term energy trends.
bp.com/energyoutlook
Charting tool
You can view predetermined reports or
chart specific data according to energy
type, region and year.
bp.com/statisticalreview
Join the conversation
#BPstats
Key information
The website contains all the tables and charts
found in the latest printed edition, plus a number
of extras, including:
• Historical data from 1965 for many sections.
• Additional data for natural gas, coal,
hydroelectricity, nuclear energy, electricity
and renewables.
• An oil, natural gas and LNG conversion
calculator.
• PDF versions and PowerPoint slide packs of
the charts, maps and graphs, plus an Excel
workbook of the data.
• Regional factsheets.
• Videos and speeches.
The BP Statistical Review of World Energy 2014
is available online at bp.com/statisticalreview
About this review
3. 1
Welcome to the 63rd edition of the BP Statistical
Review of World Energy.
The world of energy in 2013 echoed broader
global themes – such as emerging differences
in global economic performance, geopolitical
uncertainty and ongoing debates about the
proper roles of government and markets.
These are important issues, and ones over which
opinions vary widely, and legitimately. It has been
said that everyone is entitled to their own opinion,
but not their own facts. And that is where the
Statistical Review comes in: since 1952, its
mission has always been to provide objective,
global data on energy markets to inform
discussion, debate and decision-making. This first
snap-shot of the global energy picture in 2013 –
together with the historical data that puts today’s
information into context – can help us to
understand how the world around us is changing.
The year 2013 saw an acceleration in the
growth of global energy consumption, despite
a stagnant global economy. Economic growth
remained weak nearly everywhere and relative
to recent history it was weaker in the emerging
non-OECD economies. In line with that economic
pattern, energy consumption growth was below
average in the non-OECD, driven by China, and
above average in the mature economies of the
OECD, driven by the US. Emerging economies
nonetheless continue to dominate global energy
demand, accounting for 80% of growth last year
and nearly 100% of growth over the past decade.
While consumption growth accelerated globally,
it has remained below average – this is again,
consistent with the weak global economic
picture. Regionally, energy consumption growth
was below average everywhere except North
America. EU consumption continued to decline,
hitting the lowest level since 1995 (despite
economic growth of 35% over this period).
Energy production continued to be impacted
by geopolitical events. Oil production in Libya
suffered the world’s largest decline in the face of
renewed civil unrest and the production of oil and
gas was disrupted in a number of other countries
as well. In the face of these disruptions and
heightened risks to supply, average oil prices
exceeded $100 per barrel for a third consecutive
year, despite massive supply growth in the US.
Supply developments also highlighted the
importance of our third topic, namely to get the
balance right between policy and market forces.
Driven by massive investment in shale and other
‘tight’ formations, the US saw the world’s largest
increase in oil production last year, offsetting the
numerous disruptions seen elsewhere and
keeping prices stable. Indeed, the US increase
in 2013 was one of the biggest oil production
increases the world has ever seen.
Elsewhere, and after global coal prices have
fallen for two years in a row, coal is extending
its competitive edge in power generation and
the competitive balance has begun to shift.
Coal was the fastest-growing fossil fuel, with
China and India combined accounting for 88%
of global growth, while natural gas consumption
growth decelerated and grew at a below-average
rate. As was the case for total energy, gas
consumption growth was below average in
all regions except North America, which
continues to enjoy the cheapest prices among
international markets.
The importance of policy is also apparent in the
strength of renewable forms of energy, which
continued to grow robustly, albeit from a low
base. Renewables now account for more than
5% of global power output and nearly 3% of
primary energy consumption. The challenge of
sustaining expensive subsidy regimes, however,
has become visible where penetration rates are
highest, namely the below-average growth of
Europe’s leading renewable producers, who are
grappling with weak economic growth and
strained budgets.
Once again, the data in this review shows a
flexible global energy system adapting to a
changing world. It demonstrates how the world’s
quest for secure and fairly-priced energy can be
met through competitive industries driving
innovation and smart government policies that
amplify the creative ‘energy’. At BP we remain
focused on how to lead this process, delivering
the growing energy requirements of our
customers, safely and sustainably. We do this
by investing in our people and world-leading
technology, while exercising the capital discipline
sought by our investors.
I hope you will find this year’s Statistical Review a
useful resource for a global perspective on energy.
In concluding, let me thank BP’s economics team
and all those around the world who have helped
prepare this review – in particular those in
governments in many countries who contribute
their official data.
Bob Dudley
Group Chief Executive
June 2014
Group chief executive’s introduction
Energy in 2013 – energy markets reflect broader themes.
4. 2
2013 in review
Consumption and production increased for all
fuels, reaching record levels for every fuel type
except nuclear power. For each of the fossil
fuels, global consumption rose more rapidly
than production. The data suggests that growth
in global CO2 emissions from energy use also
accelerated in 2013, although it remained
below average.
Emerging economies dominated global growth
again, but the increase was below the ten-year
average in these countries, and above average
in the OECD. China once again had the largest
growth increment, followed by the US.
Consumption in the EU and Japan fell to the
lowest levels since 1995 and 1993 respectively.
Energy price developments in 2013 were mixed,
generally rising in North America (except for coal)
and falling elsewhere. The annual average price
for Brent, the international crude oil benchmark,
declined for the first time since 2009 but
remained near record levels (in money-of-the-day
as well as inflation-adjusted terms). This was the
third consecutive year with the Brent average
price above $100 per barrel. Crude oil prices
weakened in early 2013 amid strong growth of oil
production in the US, but rebounded later in the
year due to a range of supply disruptions and
cold weather that boosted demand growth.
The differential between Brent and the US
benchmark West Texas Intermediate (WTI)
narrowed but remained elevated.
Natural gas prices rose in North America (for
the first time since 2010) and the UK, but fell
elsewhere. As with Brent – WTI, differentials
between North American and international gas
prices generally narrowed but remained elevated.
Coal prices declined in all regions for a second
consecutive year.
Energy developments
Global primary energy consumption increased by
2.3% in 2013, an acceleration over 2012 (+1.8%).
Growth in 2013 accelerated for oil, coal, and
nuclear power. But global growth remained below
the 10-year average of 2.5%. All fuels except
oil, nuclear power and renewables in power
generation grew at below-average rates. Growth
was below average for all regions except North
America. Oil remains the world’s leading fuel,
with 32.9% of global energy consumption, but
it also continued to lose market share for the
fourteenth consecutive year and its current
market share is once again the lowest in our
data set, which begins in 1965.
Emerging economies accounted for 80% of the
global increase in energy consumption – even
though growth in these countries was a below
average 3.1%. OECD consumption rose by an
above-average 1.2%. Robust US growth (+2.9%)
accounted for all of the net increase in the OECD
and consumption in the EU and Japan fell by
0.3% and 0.6%, respectively. Spain (-5%)
recorded the largest volumetric decline in
energy consumption.
Global primary energy consumption accelerated in 2013
despite stagnant global economic growth.
+2.3%
Growth in global primary
energy consumption.
China’s Hong Kong skyline. China was the world’s
largest producer and consumer of energy overall
in 2013.
The Octavio Frias de Oliveira Bridge in Brazil –
24% of the world’s biofuels were produced in
the country in 2013, making it the second
largest producer.
5. 3
+1.1m b/d
Growth of US oil production,
the largest in the world.
6.3m b/d
China’s net oil imports, the world’s
second largest.
The Trans-Alaska Pipeline is more than 800 miles
long and transports oil between Prudhoe Bay and
Valdez in the US.
Oil
Prices
Dated Brent averaged $108.66 per barrel in 2013,
a decline of $3.01 per barrel from the 2012 level.
WTI continued to trade at a large discount to
Brent ($10.67 per barrel), driven by growing US
production. Since 2011, the WTI discount has
averaged $14.81 per barrel, compared with an
average premium of $1.39 per barrel for the
preceding decade.
Consumption and production
Global oil consumption grew by 1.4 million barrels
per day (b/d), or 1.4% – this is just above the
historical average. Countries outside the OECD
now account for the majority (51%) of global oil
consumption and they once again accounted
for all of the net growth in global consumption.
OECD consumption declined by 0.4%, the
seventh decrease in the past eight years. The US
(+400,000 b/d) recorded the largest increment to
global oil consumption in 2013, outpacing Chinese
growth (+390,000 b/d) for the first time since
1999. Light distillates were the fastest-growing
refined product category by volume.
Global oil production did not keep pace with the
growth in global consumption, rising by just
550,000 b/d or 0.6%. The US (+1.1 million b/d)
recorded the largest growth in the world and the
largest annual increment in the country’s history
for a second consecutive year. The US accounted
for nearly all (97%) of the non-OPEC output
increase of 1.1 million b/d (the strongest since
2002) to reach a record 49.9 million b/d. Increases
in Canada (+210,000 b/d) and Russia (+150,000
b/d) offset declines in Syria (-120,000 b/d), the
UK and Norway (-80,000 b/d each) and Australia
(-70,000 b/d). OPEC output fell by 600,000 b/d,
the first decline since 2009. Declines in
Libya (-520,000 b/d), Iran (-190,000 b/d),
Saudi Arabia (-110,000 b/d) and Nigeria
(-100,000 b/d) outweighed an increase in the
UAE (+250,000 b/d).
Refining and trade
Global refinery crude runs increased by a
below-average 390,000 b/d or 0.5%. Non-OECD
countries accounted for all of the net increase,
rising by 730,000 b/d. OECD throughputs
declined by 340,000 b/d, the seventh decline
in the past nine years despite an increase of
320,000 b/d in US refinery runs, as the US
continued to ramp up net product exports. Global
refinery capacity utilization declined to 80.4%, the
lowest since 1987, while global refining capacity
increased by a robust 1.4 million b/d, with large
capacity additions in China and Saudi Arabia
outpacing capacity reductions in the Atlantic
Basin and Japan.
Global oil trade in 2013 grew by 1.7% or 0.9
million b/d – among importers, growth in Europe
and emerging economies more than offset
declines in the US and Japan. At 55.7 million b/d,
trade accounted for 61.0% of global consumption,
up from 58.3% a decade ago. US net imports fell
by 1.4 million b/d to 6.5 million b/d – just over half
the level of net imports seen in 2005 and the
lowest level since 1988.
6. 4
+2.7%
Growth in North American gas consumption,
the only region with above-average growth.
+1.1%
Growth in global gas production.
Consumption and production
World natural gas consumption grew by 1.4%,
below the historical average of 2.6%. And, as was
the case for primary energy, consumption growth
was above average in the OECD countries
(+1.8%) and below average outside the OECD
(+1.1%). Growth was below average in every
region except North America. China (+10.8%)
and the US (+2.4%) recorded the largest growth
increments in the world, together accounting for
81% of global growth. India (-12.2%) recorded the
largest volumetric decline in the world, while EU
gas consumption fell to the lowest level since
1999. Globally, natural gas accounted for 23.7%
of primary energy consumption.
Global natural gas production grew by 1.1%,
which was well below the 10-year average of
2.5%. Growth was below average in all regions
except Europe and Eurasia. The US (+1.3%)
remained the world’s leading producer, but both
Russia (+2.4%) and China (+9.5%) recorded larger
growth increments in 2013. Nigeria (-16.4%), India
(-16.3%), and Norway (-5%) recorded the largest
volumetric declines.
Trade
Global natural gas trade grew by 1.8% in 2013,
well below the historical average of 5.2%.
Pipeline shipments grew by 2.3%, driven by
a 12% increase in net Russian exports, which
offset declines in Algeria (-17.9%), Norway
(-4.5%) and Canada (-5.5%). Among importers,
growth in Germany (+14%) and China (+32.4%)
more than offset a continued decline in the US
(-10.9%). Global LNG trade rebounded by 0.6%
in 2013. Increased imports in South Korea
(+10.7%), China (+22.9%), and South and Central
American importers (+44.7%) were partially
offset by lower imports in Spain (-35.6%), the
UK (-31.9%) and France (-19.4%). Qatar remained
the largest LNG exporter (32% of global exports),
and accounted for the largest growth increment
(+2.7%). LNG’s share of global gas trade
declined slightly to 31.4% – and international
natural gas trade accounted for 30.9% of
global consumption.
Natural gas
The Min Rong tanker berthed at Tangguh
liquefied natural gas (LNG) plant in Indonesia.
Indonesia is the second largest natural gas
producer in Asia.
The Shah Deniz platform in the Caspian Sea.
Natural gas is the leading fuel in Europe
and Eurasia.
7. 5
+3.0%
Growth in global coal consumption,
the fastest growing fossil fuel.
+0.9%
Growth in global nuclear output,
the first increase since 2010.
5.3%
Share of global power generation
met by renewables.
Acknowledgements
We would like to express our sincere gratitude to the many contacts worldwide who provide
the publicly available data for this publication, and to the researchers at the Heriot-Watt
University Energy Academy who assist in the data compilation.
Other fuels
Goshen Wind Farm in Idaho. Global wind power
generation grew by 21% in 2013.
Coal ready for shipping. Coal was the fastest
growing fossil fuel and its consumption grew
by 3% in 2013.
In detail
Additional information – including
historical time series for the fuels
reported in this review; further detail on
renewable forms of energy; electricity
generation; and CO2 emissions from
energy use – is available at
bp.com/statisticalreview
Coal
Coal consumption grew by 3% in 2013, well
below the 10-year average of 3.9% but it is still
the fastest-growing fossil fuel. Coal’s share of
global primary energy consumption reached
30.1%, the highest since 1970. Consumption
outside the OECD rose by a below-average 3.7%,
but still accounted for 89% of global growth. China
recorded the weakest absolute growth since
2008 but the country still accounted for 67% of
global growth. India experienced its second
largest volumetric increase on record and
accounted for 21% of global growth. OECD
consumption increased by 1.4%, with increases
in the US and Japan offsetting declines in the EU.
Global coal production grew by 0.8%, the weakest
growth since 2002. Indonesia (+9.4%) and
Australia (+7.3%) offset a decline in the US (-3.1%),
while China (+1.2%) recorded the weakest
volumetric growth in production since 2000.
Nuclear and hydroelectric
Global nuclear output grew by 0.9%, the first
increase since 2010. Increases in the US, China
and Canada were partly offset by declines in
South Korea, Ukraine, Spain and Russia.
Japanese output fell by 18.6% and has fallen by
95% since 2010. Nuclear output accounted for
4.4% of global energy consumption, the smallest
share since 1984.
Global hydroelectric output grew by a below-
average 2.9%. Led by China and India, the
Asia-Pacific region accounted for 78% of global
growth. Drought conditions reduced output in
Brazil by 7% and in Finland, Norway and Sweden
by a combined 14.5%. Hydroelectric output
accounted for 6.7% of global energy consumption.
Renewables
Renewable energy sources – in power generation
as well as transport – continued to increase in
2013, reaching a record 2.7% of global energy
consumption, up from 0.8% a decade ago.
Renewable energy used in power generation
grew by 16.3% and accounted for a record 5.3%
of global power generation. China recorded the
largest incremental growth in renewables,
followed by the US, while growth in Europe’s
leading players – Germany, Spain and Italy – was
below average. Globally, wind energy (+20.7%)
once again accounted for more than half of
renewable power generation growth and solar
power generation grew even more rapidly
(+33%), but from a smaller base. Global biofuels
production grew by a below-average 6.1%
(80,000 b/doe), driven by increases in the two
largest producers: Brazil (+16.8%) and the
US (+4.6%).
8. 6
Proved reserves
At end 1993 At end 2003 At end 2012 At end 2013
Thousand
million
barrels
Thousand
million
barrels
Thousand
million
barrels
Thousand
million
tonnes
Thousand
million
barrels
Share
of total
R/P
ratio
US 30.2 29.4 44.2 5.4 44.2 2.6% 12.1
Canada 39.5 180.4 174.3 28.1 174.3 10.3% *
Mexico 50.8 16.0 11.4 1.5 11.1 0.7% 10.6
Total North America 120.5 225.8 229.9 35.0 229.6 13.6% 37.4
Argentina 2.2 2.7 2.4 0.3 2.4 0.1% 9.8
Brazil 5.0 10.6 15.3 2.3 15.6 0.9% 20.2
Colombia 3.2 1.5 2.2 0.3 2.4 0.1% 6.5
Ecuador 3.7 5.1 8.4 1.2 8.2 0.5% 42.6
Peru 0.8 0.9 1.4 0.2 1.4 0.1% 37.5
Trinidad Tobago 0.6 0.9 0.8 0.1 0.8 ◆
19.2
Venezuela 64.4 77.2 297.6 46.6 298.3 17.7% *
Other S. Cent. America 0.9 1.5 0.5 0.1 0.5 ◆
9.6
Total S. Cent. America 80.7 100.4 328.6 51.1 329.6 19.5% *
Azerbaijan n/a 7.0 7.0 1.0 7.0 0.4% 21.9
Denmark 0.7 1.3 0.7 0.1 0.7 ◆
10.3
Italy 0.6 0.8 1.4 0.2 1.4 0.1% 32.7
Kazakhstan n/a 9.0 30.0 3.9 30.0 1.8% 46.0
Norway 9.6 10.1 9.2 1.0 8.7 0.5% 12.9
Romania 1.0 0.5 0.6 0.1 0.6 ◆
19.0
Russian Federation n/a 79.0 92.1 12.7 93.0 5.5% 23.6
Turkmenistan n/a 0.5 0.6 0.1 0.6 ◆
7.1
United Kingdom 4.5 4.3 3.0 0.4 3.0 0.2% 9.6
Uzbekistan n/a 0.6 0.6 0.1 0.6 ◆
25.9
Other Europe Eurasia 61.8 2.3 2.1 0.3 2.2 0.1% 15.1
Total Europe Eurasia 78.3 115.5 147.4 19.9 147.8 8.8% 23.5
Iran 92.9 133.3 157.0 21.6 157.0 9.3% *
Iraq 100.0 115.0 150.0 20.2 150.0 8.9% *
Kuwait 96.5 99.0 101.5 14.0 101.5 6.0% 89.0
Oman 5.0 5.6 5.5 0.7 5.5 0.3% 16.0
Qatar 3.1 27.0 25.2 2.6 25.1 1.5% 34.4
Saudi Arabia 261.4 262.7 265.9 36.5 265.9 15.8% 63.2
Syria 3.0 2.4 2.5 0.3 2.5 0.1% *
United Arab Emirates 98.1 97.8 97.8 13.0 97.8 5.8% 73.5
Yemen 2.0 2.8 3.0 0.4 3.0 0.2% 51.2
Other Middle East 0.1 0.1 0.3 † 0.3 ◆
3.4
Total Middle East 661.9 745.7 808.7 109.4 808.5 47.9% 78.1
Algeria 9.2 11.8 12.2 1.5 12.2 0.7% 21.2
Angola 1.9 8.8 12.7 1.7 12.7 0.8% 19.3
Chad – 0.9 1.5 0.2 1.5 0.1% 43.5
Republic of Congo (Brazzaville) 0.7 1.5 1.6 0.2 1.6 0.1% 15.6
Egypt 3.4 3.5 4.2 0.5 3.9 0.2% 15.0
Equatorial Guinea 0.3 1.3 1.7 0.2 1.7 0.1% 15.0
Gabon 0.7 2.3 2.0 0.3 2.0 0.1% 23.1
Libya 22.8 39.1 48.5 6.3 48.5 2.9% *
Nigeria 21.0 35.3 37.1 5.0 37.1 2.2% 43.8
South Sudan – – 3.5 0.5 3.5 0.2% 96.9
Sudan 0.3 0.6 1.5 0.2 1.5 0.1% 33.7
Tunisia 0.4 0.6 0.4 0.1 0.4 ◆
18.7
Other Africa 0.6 0.6 3.7 0.5 3.7 0.2% 47.7
Total Africa 61.2 106.2 130.6 17.3 130.3 7.7% 40.5
Australia 3.3 3.7 3.9 0.4 4.0 0.2% 26.1
Brunei 1.3 1.0 1.1 0.1 1.1 0.1% 22.3
China 16.4 15.5 18.1 2.5 18.1 1.1% 11.9
India 5.9 5.7 5.7 0.8 5.7 0.3% 17.5
Indonesia 5.2 4.7 3.7 0.5 3.7 0.2% 11.6
Malaysia 5.0 4.8 3.7 0.5 3.7 0.2% 15.3
Thailand 0.2 0.5 0.4 0.1 0.4 ◆
2.5
Vietnam 0.6 3.0 4.4 0.6 4.4 0.3% 34.5
Other Asia Pacific 1.1 1.4 1.1 0.1 1.1 0.1% 11.2
Total Asia Pacific 38.8 40.5 42.1 5.6 42.1 2.5% 14.0
Total World 1041.4 1334.1 1687.3 238.2 1687.9 100.0% 53.3
of which: OECD 140.8 247.5 249.6 37.3 248.8 14.7% 33.2
Non-OECD 900.6 1086.6 1437.7 200.9 1439.1 85.3% 59.5
OPEC 774.9 912.1 1213.8 170.2 1214.2 71.9% 90.3
Non-OPEC‡ 206.3 325.2 342.6 50.1 341.9 20.3% 26.0
European Union# 8.1 8.0 6.8 0.9 6.8 0.4% 13.0
Former Soviet Union 60.1 96.8 130.9 17.9 131.8 7.8% 26.0
Canadian oil sands: Total 32.3 174.4 167.8 27.3 167.8
of which: Under active development 2.9 10.8 25.9 4.2 25.9
Venezuela: Orinoco Belt – – 220.0 35.4 220.5
*More than 100 years.
†Less than 0.05.
◆
Less than 0.05%.
‡Excludes Former Soviet Union.
#Excludes Estonia, Latvia and Lithuania in 1993.
Notes: Proved reserves of oil – Generally taken to be those quantities that geological and engineering information indicates with reasonable certainty can be recovered in the future from
known reservoirs under existing economic and operating conditions.
Reserves-to-production (R/P) ratio – If the reserves remaining at the end of any year are divided by the production in that year, the result is the length of time that those remaining reserves
would last if production were to continue at that rate.
Source of data – The estimates in this table have been compiled using a combination of primary official sources, third-party data from the OPEC Secretariat, World Oil, Oil Gas Journal and an
independent estimate of Russian and Chinese reserves based on information in the public domain.
Canadian oil sands ‘under active development’ are an official estimate. Venezuelan Orinoco Belt reserves are based on the OPEC Secretariat and government announcements.
Reserves include gas condensate and natural gas liquids (NGLs) as well as crude oil.
Shares of total and R/P ratios are calculated using thousand million barrels figures.
Oil
9. 7
63.6
8.8
47.92.5
7.7
13.6
19.5
2013
Total 1687.9
thousand million
barrels2003
Total 1334.1
thousand million
barrels
7.5
8.7
8.0
3.0 55.9
16.9
1993
Total 1041.4
thousand million
barrels
11.6
3.7
5.9
7.5
7.7
Distribution of proved reserves in 1993, 2003 and 2013
Percentage
Middle East
S. Cent. America
North America
Europe Eurasia
Africa
Asia Pacific
0
150
120
60
90
30
North
America
S. Cent.
America
Europe
Eurasia
Middle
East
Africa Asia
Pacific
2013 by region
Total world proved oil reserves reached 1687.9 billion barrels at the end of 2013, sufficient to meet 53.3 years of global production. The largest additions to reserves
came from Russia, adding 900 million barrels and Venezuela adding 800 million barrels. OPEC members continue to hold the majority of reserves, accounting for 71.9%
of the global total. South Central America continues to hold the highest R/P ratio. Over the past decade, global proved reserves have increased by 27%, or over
350 billion barrels.
0
160
150
140
130
120
100
110
80
90
30
60
50
40
70
10
20
83 88 93 98 03 08 13
North America
S. Cent. America
Europe Eurasia
Middle East
Africa
Asia Pacific
World
History
Reserves-to-production (R/P) ratios
Years
14. 12
0
100
90
70
80
20
50
40
30
60
10
Asia Pacific
Africa
Middle East
Europe Eurasia
S. Cent. America
North America
88 9893 0803 13 0
100
90
70
80
20
50
40
30
60
10
88 9893 0803 13
Consumption by region
Million barrels daily
Production by region
Million barrels daily
World oil production increased by just 550,000 b/d in 2013, less than half the growth of global consumption. Global consumption grew by an above-average 1.4 million b/d,
with emerging economies accounting for all of the net increase. Even so, the US had the biggest increase in the world for consumption, as well as production, which grew
by 400,000 b/d and 1.1 million b/d respectively. OPEC output fell by 600,000 b/d, driven by a decline of 520,000 b/d in Libya.
Consumption per capita 2013
Tonnes
0-0.75
0.75-1.5
1.5-2.25
2.25-3.0
3.0
19. 17
Refinery utilization
Percentage
Global crude runs grew by 0.4 million b/d in 2013, with increases in China, India and the US more than offsetting declines in Europe and Other Asia Pacific. Global refining
capacity grew by 1.4 million b/d, led by additions in China and the Middle East. Global average refinery utilization slipped to 80.4%, the lowest since 1987.
03 04 05 06 07 08 09 10 11 12 13
North America
S. Cent. America
Europe
Former Soviet Union
Middle East
Africa
Asia Pacific
World
40
100
90
60
70
50
80
03 04 05 06 07 08 09 10 11 1312 -5
25
20
15
10
5
0
USGC Heavy Sour Coking
NWE Light Sweet Cracking
Singapore Medium Sour Hydrocracking
Regional refining margins
US dollars per barrel
Note: The refining margins presented are benchmark margins for three major global refining centres: US Gulf Coast (USGC), North West Europe (NWE – Rotterdam)
and Singapore. In each case they are based on a single crude oil appropriate for that region and have optimized product yields based on a generic refinery configuration
(cracking, hydrocracking or coking), again appropriate for that region. The margins are on a semi-variable basis, i.e. the margin after all variable costs and fixed energy costs.
20. 18
Trade movements
Thousand barrels daily 2003 2004 2005 2006 2007 2008 2009 2010 2011 2012 2013
Change
2013 over
2012
2013
share
of total
Imports
US 12254 12898 13525 13612 13632 12872 11453 11689 11338 10587 9792 -7.5% 17.6%
Europe 11993 12538 13261 13461 13953 13751 12486 12094 12208 12488 12637 1.2% 22.7%
Japan 5314 5203 5225 5201 5032 4925 4263 4567 4494 4743 4530 -4.5% 8.1%
Rest of World 17191 18651 19172 20287 22937 23078 24132 25160 26120 26930 28713 6.6% 51.6%
Total World 46752 49290 51182 52561 55554 54626 52333 53510 54160 54748 55672 1.7% 100.0%
Exports
US 921 991 1129 1317 1439 1967 1947 2154 2495 2682 3271 21.9% 5.9%
Canada 2096 2148 2201 2330 2457 2498 2518 2599 2798 3056 3276 7.2% 5.9%
Mexico 2115 2070 2065 2102 1975 1609 1449 1539 1487 1366 1335 -2.3% 2.4%
S. Cent. America 2942 3233 3528 3681 3570 3616 3748 3568 3755 3830 3707 -3.2% 6.7%
Europe 2066 1993 2149 2173 2273 2023 2034 1888 2053 2174 2399 10.3% 4.3%
Former Soviet Union 6003 6440 7076 7155 8334 8184 7972 8544 8569 8285 8632 4.2% 15.5%
Middle East 18943 19630 19821 20204 19680 20128 18409 18883 19687 19581 19439 -0.7% 34.9%
North Africa 2715 2917 3070 3225 3336 3260 2938 2871 1945 2596 2207 -15.0% 4.0%
West Africa 3612 4048 4358 4704 4830 4587 4364 4601 4637 4557 4453 -2.3% 8.0%
Asia Pacific† 3978 4189 4243 4312 6004 5392 5631 6226 6088 6299 6480 2.9% 11.6%
Rest of World 1361 1631 1542 1359 1656 1363 1323 637 646 322 473 47.2% 0.9%
Total World 46752 49290 51182 52561 55554 54626 52333 53510 54160 54748 55672 1.7% 100.0%
†Excludes Japan. Excludes trade between other Asia Pacific countries and India prior to 2007.
North and West African exports excludes intra-Africa trade.
Note: Annual changes and shares of total are calculated using thousand barrels daily figures.
Inter-area movements 2013
To
Million tonnes
From US Canada Mexico
S. Cent.
America Europe
Former
Soviet
Union
Middle
East Africa Australasia China India Japan Singapore
Other
Asia
Pacific Total
US – 14.5 24.7 52.6 32.3 0.1 3.6 6.5 0.3 7.1 1.9 5.7 5.9 1.5 156.7
Canada 154.5 – † 1.1 3.6 † 0.1 † † 1.6 0.1 0.6 † 0.1 161.9
Mexico 45.6 1.4 – 2.0 9.5 – † – – 1.3 4.8 – 1.6 † 66.2
S. Cent. America 83.8 0.6 0.3 – 18.2 0.1 0.1 0.3 † 30.6 31.5 2.3 13.4 2.3 183.3
Europe 23.8 7.9 3.5 9.3 – 5.0 12.3 28.7 0.1 1.3 0.6 1.3 8.2 13.5 115.5
Former Soviet Union 25.0 0.3 – 0.7 295.0 – 13.4 1.8 1.9 43.4 2.1 14.4 7.7 19.1 424.7
Middle East 100.1 6.3 0.3 6.5 102.6 0.4 – 16.5 7.7 153.9 124.6 164.2 53.0 227.2 963.5
North Africa 9.0 3.1 – 4.5 74.1 0.1 1.2 – 1.0 6.0 4.7 1.2 0.2 3.6 108.9
West Africa 31.5 4.2 – 14.3 72.9 † – – 5.9 53.0 26.8 3.5 0.8 8.5 221.5
East Southern Africa † † † 0.1 0.1 † † – † 5.9 0.3 0.5 0.4 0.1 7.5
Australasia 0.1 – – 0.6 0.1 † † † – 3.3 0.1 2.0 1.6 6.8 14.5
China 0.3 0.1 – 4.5 0.6 0.5 1.1 1.1 0.1 – 0.6 0.5 4.3 16.7 30.2
India 2.9 0.1 – 4.5 8.3 † 17.4 8.5 † 0.6 – 3.0 7.1 6.7 59.1
Japan 0.8 † – 0.2 0.2 † † 0.1 3.5 1.7 † – 3.3 5.4 15.4
Singapore 0.7 † – 0.3 1.2 † 1.4 2.9 10.5 6.7 0.4 0.1 – 56.9 81.2
Other Asia Pacific 5.4 † † 1.9 4.1 † 1.2 2.0 19.5 25.3 4.6 24.4 38.5 – 126.8
Total imports 483.5 38.4 28.9 103.1 622.8 6.3 51.9 68.4 50.6 341.7 203.3 223.7 146.1 368.5 2737.1
Thousand barrels daily
From
US – 298 517 1100 674 2 75 136 7 148 40 118 123 32 3271
Canada 3125 – ‡ 22 74 ‡ 2 ‡ ‡ 34 2 13 1 3 3276
Mexico 919 28 – 40 191 – ‡ – – 26 97 – 33 ‡ 1335
S. Cent. America 1690 12 6 – 368 2 2 6 1 617 632 47 279 46 3707
Europe 496 160 73 193 – 104 258 598 2 26 13 28 171 279 2399
Former Soviet Union 519 5 – 15 5989 – 273 36 38 877 42 290 160 386 8632
Middle East 2011 127 6 133 2074 9 – 334 155 3097 2509 3310 1076 4596 19439
North Africa 185 63 – 93 1497 3 25 – 21 121 96 25 5 74 2207
West Africa 635 84 – 287 1466 ‡ – – 118 1065 539 70 17 171 4453
East Southern Africa 1 ‡ ‡ 2 3 ‡ 1 – ‡ 118 7 11 7 3 152
Australasia 2 – – 11 2 ‡ ‡ 1 – 66 3 40 32 137 294
China 7 1 – 94 13 10 22 23 1 – 12 9 89 348 631
India 60 2 – 93 173 ‡ 364 177 ‡ 13 – 64 149 141 1236
Japan 17 ‡ – 5 5 ‡ 1 2 74 36 1 – 70 112 322
Singapore 15 1 – 7 25 ‡ 29 60 220 139 8 2 – 1189 1697
Other Asia Pacific 111 ‡ 1 39 85 1 24 42 397 525 93 502 803 – 2623
Total imports 9792 781 603 2134 12637 131 1076 1416 1033 6911 4094 4530 3017 7518 55672
†Less than 0.05.
‡Less than 0.5.
21. 19
Imports and exports 2013
Million tonnes Thousand barrels daily
Crude
imports
Product
imports
Crude
exports
Product
exports
Crude
imports
Product
imports
Crude
exports
Product
exports
US 384.4 99.2 5.6 151.1 7719 2074 112 3158
Canada 27.6 10.8 132.2 29.7 554 226 2655 621
Mexico † 28.9 60.3 5.9 ‡ 603 1212 123
S. Cent. America 25.1 78.0 151.3 32.0 503 1631 3039 669
Europe 463.8 159.0 18.9 96.6 9313 3324 380 2019
Former Soviet Union 0.2 6.1 300.1 124.6 4 126 6027 2605
Middle East 10.8 41.1 855.3 108.2 216 860 17176 2263
North Africa 2.7 19.1 85.2 23.7 54 399 1712 495
West Africa † 13.2 214.9 6.6 ‡ 276 4316 137
East Southern Africa 13.4 20.0 6.8 0.7 269 417 137 15
Australasia 28.4 22.2 11.5 3.0 569 464 231 62
China 282.6 59.1 0.9 29.3 5675 1236 19 612
India 190.5 12.9 † 59.1 3825 269 ‡ 1236
Japan 178.2 45.5 0.6 14.8 3579 951 13 309
Singapore 44.4 101.7 0.1 81.1 892 2125 2 1695
Other Asia Pacific 226.4 142.1 34.4 92.5 4547 2971 690 1933
Total World 1878.3 858.8 1878.3 858.8 37720 17952 37720 17952
†Less than 0.05.
‡Less than 0.5.
Note: Bunkers are not included as exports. Intra-area movements (for example, between countries in Europe) are excluded.
72.9
18.2
295.000
100.1
31.5
02.6101010
164.21616
1515153.915
5 0053.053.000
124.4.64.
25.3 24.4 16.7
19.1
38.5
227.2 56.966
43.423.8
45.6
83.8
53.0 31.5
26.8
30.6
74.17474 11
15454.51544441
25.0
52.6
24.7
19.5
516.6..56.5
28.777228.728.72828
32.3
.417.47 47.47.4
US
Canada
Mexico
S. Cent. America
Europe Eurasia
Middle East
Africa
Asia Pacific
Major trade movements 2013
Trade flows worldwide (million tonnes)
22. 20
Proved reserves
At end 1993 At end 2003 At end 2012 At end 2013
Trillion
cubic
metres
Trillion
cubic
metres
Trillion
cubic
metres
Trillion
cubic
feet
Trillion
cubic
metres
Share of
total
R/P
ratio
US 4.6 5.4 8.7 330.0 9.3 5.0% 13.6
Canada 2.2 1.6 2.0 71.4 2.0 1.1% 13.1
Mexico 2.0 0.4 0.4 12.3 0.3 0.2% 6.1
Total North America 8.8 7.4 11.1 413.7 11.7 6.3% 13.0
Argentina 0.5 0.6 0.3 11.1 0.3 0.2% 8.9
Bolivia 0.1 0.8 0.3 11.2 0.3 0.2% 15.2
Brazil 0.1 0.2 0.5 15.9 0.5 0.2% 21.2
Colombia 0.2 0.1 0.2 5.7 0.2 0.1% 12.8
Peru 0.3 0.2 0.4 15.4 0.4 0.2% 35.7
Trinidad Tobago 0.2 0.5 0.4 12.4 0.4 0.2% 8.2
Venezuela 3.7 4.2 5.6 196.8 5.6 3.0% *
Other S. Cent. America 0.2 0.1 0.1 2.2 0.1 ◆
24.9
Total S. Cent. America 5.4 6.8 7.7 270.9 7.7 4.1% 43.5
Azerbaijan n/a 0.9 0.9 31.0 0.9 0.5% 54.3
Denmark 0.1 0.1 † 1.2 † ◆
7.0
Germany 0.2 0.2 0.1 1.7 † ◆
5.9
Italy 0.3 0.1 0.1 1.8 0.1 ◆
7.3
Kazakhstan n/a 1.3 1.5 53.9 1.5 0.8% 82.5
Netherlands 1.7 1.4 0.9 30.1 0.9 0.5% 12.4
Norway 1.4 2.5 2.1 72.4 2.0 1.1% 18.8
Poland 0.2 0.1 0.1 4.1 0.1 0.1% 27.5
Romania 0.4 0.3 0.1 4.1 0.1 0.1% 10.6
Russian Federation n/a 30.4 31.0 1103.6 31.3 16.8% 51.7
Turkmenistan n/a 2.3 17.5 617.3 17.5 9.4% *
Ukraine n/a 0.7 0.6 22.7 0.6 0.3% 33.4
United Kingdom 0.6 0.9 0.2 8.6 0.2 0.1% 6.7
Uzbekistan n/a 1.2 1.1 38.3 1.1 0.6% 19.7
Other Europe Eurasia 35.6 0.4 0.3 8.8 0.2 0.1% 33.4
Total Europe Eurasia 40.5 42.7 56.5 1999.5 56.6 30.5% 54.8
Bahrain 0.2 0.1 0.2 6.7 0.2 0.1% 12.1
Iran 20.7 27.6 33.6 1192.9 33.8 18.2% *
Iraq 3.1 3.2 3.6 126.7 3.6 1.9% *
Kuwait 1.5 1.6 1.8 63.0 1.8 1.0% *
Oman 0.2 1.0 0.9 33.5 0.9 0.5% 30.7
Qatar 7.1 25.3 24.9 871.5 24.7 13.3% *
Saudi Arabia 5.2 6.8 8.2 290.8 8.2 4.4% 79.9
Syria 0.2 0.3 0.3 10.1 0.3 0.2% 63.9
United Arab Emirates 5.8 6.0 6.1 215.1 6.1 3.3% *
Yemen 0.4 0.5 0.5 16.9 0.5 0.3% 46.3
Other Middle East † 0.1 0.2 8.1 0.2 0.1% 35.3
Total Middle East 44.4 72.4 80.3 2835.4 80.3 43.2% *
Algeria 3.7 4.5 4.5 159.1 4.5 2.4% 57.3
Egypt 0.6 1.7 2.0 65.2 1.8 1.0% 32.9
Libya 1.3 1.5 1.5 54.7 1.5 0.8% *
Nigeria 3.7 5.1 5.1 179.4 5.1 2.7% *
Other Africa 0.7 1.0 1.2 43.3 1.2 0.7% 56.9
Total Africa 10.0 13.9 14.4 501.7 14.2 7.6% 69.5
Australia 1.0 2.4 3.8 129.9 3.7 2.0% 85.8
Bangladesh 0.3 0.4 0.3 9.7 0.3 0.1% 12.6
Brunei 0.4 0.3 0.3 10.2 0.3 0.2% 23.6
China 1.7 1.3 3.3 115.6 3.3 1.8% 28.0
India 0.7 0.9 1.3 47.8 1.4 0.7% 40.2
Indonesia 1.8 2.6 2.9 103.3 2.9 1.6% 41.6
Malaysia 1.8 2.5 1.1 38.5 1.1 0.6% 15.8
Myanmar 0.3 0.4 0.3 10.0 0.3 0.2% 21.6
Pakistan 0.7 0.8 0.6 22.7 0.6 0.3% 16.7
Papua New Guinea † † 0.2 5.5 0.2 0.1% *
Thailand 0.2 0.4 0.3 10.1 0.3 0.2% 6.8
Vietnam 0.1 0.2 0.6 21.8 0.6 0.3% 63.3
Other Asia Pacific 0.3 0.5 0.3 11.5 0.3 0.2% 17.5
Total Asia Pacific 9.3 12.7 15.2 536.6 15.2 8.2% 31.1
Total World 118.4 155.7 185.3 6557.8 185.7 100.0% 55.1
of which: OECD 14.6 15.3 18.7 678.3 19.2 10.3% 16.0
Non-OECD 103.8 140.4 166.6 5879.5 166.5 89.7% 76.7
European Union 3.7 3.2 1.6 55.6 1.6 0.8% 10.7
Former Soviet Union 35.3 36.9 52.8 1869.5 52.9 28.5% 68.2
*More than 100 years.
†Less than 0.05.
◆Less than 0.05%.
n/a not available.
Notes: Proved reserves of natural gas – Generally taken to be those quantities that geological and engineering information indicates with reasonable certainty can be recovered in the future
from known reservoirs under existing economic and operating conditions.
Reserves-to-production (R/P) ratio – If the reserves remaining at the end of any year are divided by the production in that year, the result is the length of time that those remaining reserves
would last if production were to continue at that rate.
Source of data – The estimates in this table have been compiled using a combination of primary official sources and third-party data from Cedigaz and the OPEC Secretariat.
Natural gas
23. 21
0
200
160
80
120
40
North
America
S. Cent.
America
Europe
Eurasia
Middle
East
Africa Asia
Pacific
2013 by region
800
600
400
200
83 88 93 98 03 08 13 0
North America
S. Cent. America
Europe Eurasia
Africa
Middle East
Asia Pacific
World
History
Reserves-to-production (R/P) ratios
Years
World proved natural gas reserves at end-2013 stood at 185.7 trillion cubic metres (tcm), sufficient to meet 55.1 years of global production. Proved reserves grew by 0.2%
relative to end-2012 data. An increase in the US (+7.1%) accounted for all of the net growth in global proved reserves in 2013. Iran (33.8 tcm) and Russia (31.3 tcm) hold
the largest proved reserves.
Distribution of proved reserves in 1993, 2003 and 2013
Percentage
7.6
43.24.1
6.3
30.5
8.2
27.4
4.7
4.4 46.5
8.1
2013
Total 185.7
trillion cubic
metres2003
Total 155.7
trillion cubic
metres
1993
Total 118.4
trillion cubic
metres
7.8
37.54.6
7.4
34.2
8.9
8.5
Middle East
Europe Eurasia
Asia Pacific
Africa
North America
S. Cent. America