Downloaded 820 times


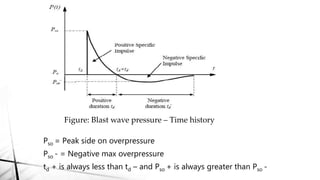


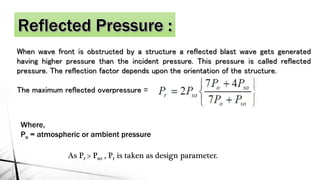


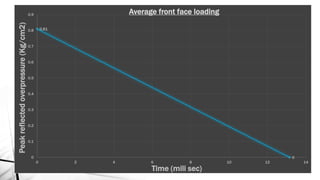


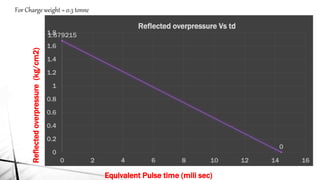


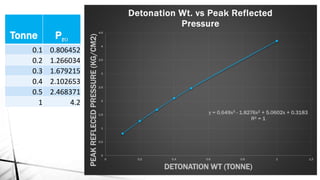


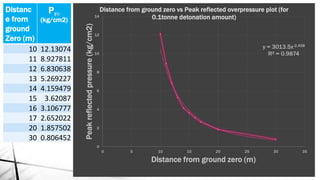


This document discusses blast load analysis and design of blast resistant structures. It begins by outlining the need for blast resistant design due to increasing terrorist attacks. It then defines what a blast is and describes the blast wave pressure time history. Different types of blast resistant structures are discussed. Empirical relationships are provided for calculating reflected blast pressures. The document provides examples of calculating the impulse of a blast load on a building and using it to determine base shear and moment. Plots of reflected pressure versus time are given for different charge weights and standoff distances. The scope of work for designing a G+6 storey building considering blast loads is also summarized.


