Download to read offline


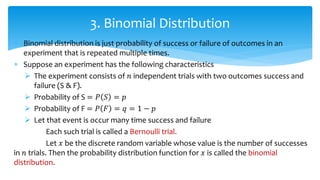
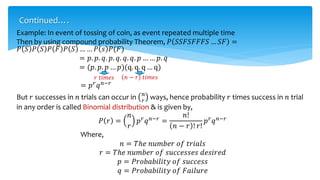
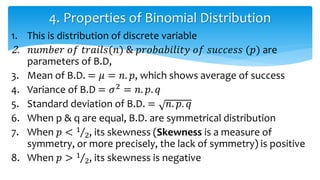
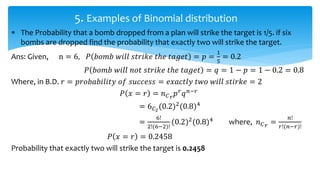
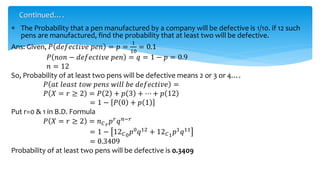
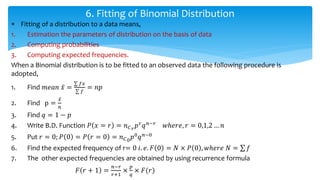
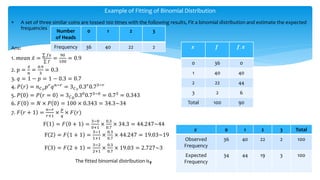


The document discusses theoretical discrete probability distributions, focusing on the binomial distribution, which models the probability of success or failure in repeated independent trials. It includes explanations of properties, examples, and applications of the binomial distribution, as well as the fitting of the distribution to observed data. The summary includes mathematical formulas and examples to illustrate the concepts.