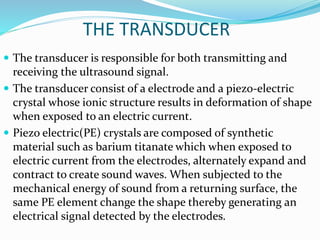
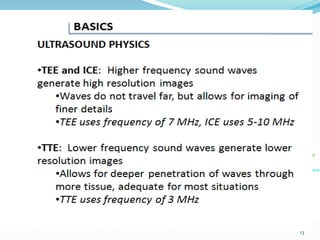
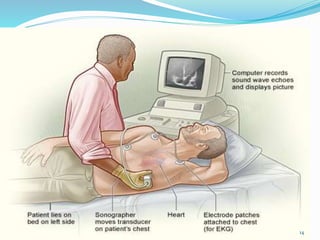
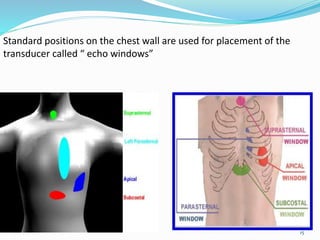
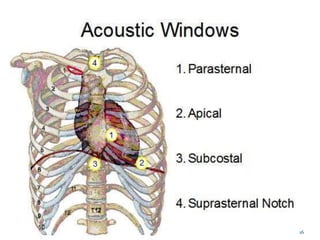
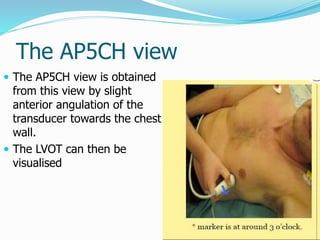
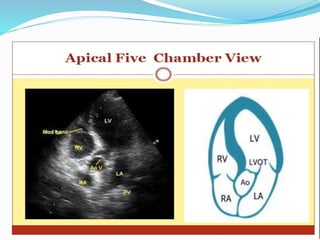
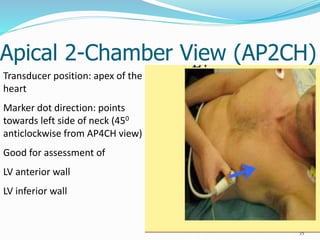
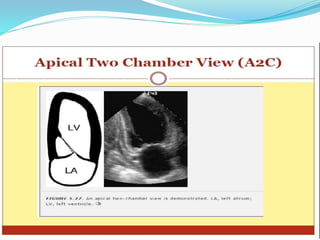
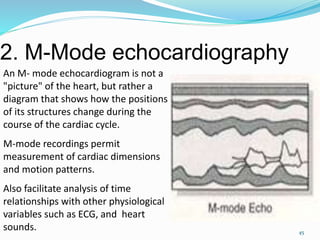
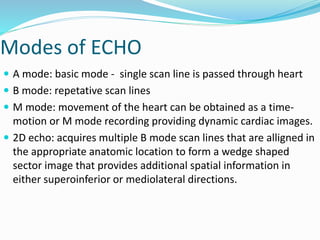
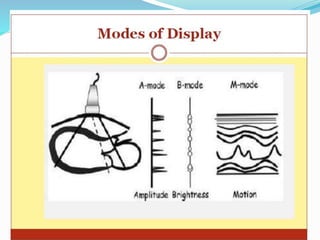
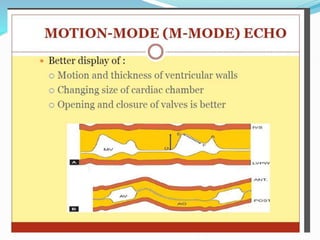
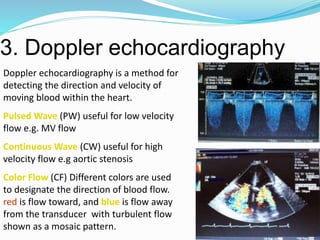
BASIC
ECHOCARDIOGRAPHY
PRESENTOR :- DR. ASHUTOSH
DATE:- 14/09/2017
Echo
2
Echo is something you experience all the
time. If you shout into a well, the echo comes
back a moment later. The echo occurs
because some of the sound waves in your
shout reflect off a surface (either the water at
the bottom of the well or the wall on the far
side) and travel back to your ears. A similar
principle applies in cardiac ultrasound.
History
In 1842, Christian Johann Doppler (1803-1853) noted that the
pitch of a sound wave varied if the source of the sound was
moving.
The ability to create ultrasonic waves came in 1880 with the
discovery of piezoelectricity by Curie and Curie.
Dr. Helmut Hertz of Sweden in 1953 obtained a commercial
ultrasonoscope, which was being used for nondestructive testing.
He then collaborated with Dr. Inge Edler who was a practicing
cardiologist in Sweden. The two of them began to use this
commercial ultrasonoscope to examine the heart. This
collaboration is commonly accepted as the beginning of clinical
echocardiography as we know it today.
3
Generation Of An Ultrasound Image
4
Echocardiography (echo or
echocardiogram) is a type of
ultrasound test that uses high-pitched
sound waves to produce an image of
the heart.
The sound waves are sent through a
device called a transducer and are
reflected off the various structures of
the heart. These echoes are converted
into pictures of the heart that can be
seen on a video monitor.
There is no special preparation for the
test.
5
Ultrasound gel is applied to the
transducer to allow transmission
of the sound waves from the
transducer to the skin
The transducer transforms the
echo (mechanical energy) into an
electrical signal which is processed
and displayed as an image on the
screen.
The conversion of sound to
electrical energy is called the
piezoelectric effect
Machines
8
There are 5 basic components of an ultrasound scanner that are required for
generation, display and storage of an ultrasound image.
1. Pulse generator - applies high amplitude voltage to energize the crystals
2. Transducer - converts electrical energy to mechanical (ultrasound) energy
and vice versa
3. Receiver - detects and amplifies weak signals
4. Display - displays ultrasound signals in a variety of modes
5. Memory - stores video display
THE TRANSDUCER
 The transducer is responsible for both transmitting and
receiving the ultrasound signal.
 The transducer consist of a electrode and a piezo-electric
crystal whose ionic structure results in deformation of shape
when exposed to an electric current.
 Piezo electric(PE) crystals are composed of synthetic
material such as barium titanate which when exposed to
electric current from the electrodes, alternately expand and
contract to create sound waves. When subjected to the
mechanical energy of sound from a returning surface, the
same PE element change the shape thereby generating an
electrical signal detected by the electrodes.
TYPES
 Transthoracic(standard echo)
Left parasternal
Apical
Subcostal
Suprasternal
 Transesophageal
 Intracardiac
12
Transthoracic Echo
13
A standard echocardiogram is also known as a
transthoracic echocardiogram (TTE), or cardiac
ultrasound.
The subject is asked to lie in the semi recumbent
position on his or her left side with the head elevated.
The left arm is tucked under the head and the right arm
lies along the right side of the body
Standard positions on the chest wall are used for
placement of the transducer called “echo windows”
14
15
Standard positions on the chest wall are used for placement of the
transducer called “ echo windows”
16
1.Parasternal Long-Axis View
(PLAX)
17
Transducer position: left sternal edge;
2nd – 4th intercostal space
Marker dot direction: points towards
right shoulder
Most echo studies begin with this
view
It sets the stage for subsequent echo
views
Many structures seen from this view
PARASTERNAL LONG AXIS
VIEW
Parasternal Short Axis View (PSAX)
22
Transducer position: left sternal edge;
2nd – 4th intercostal space
Marker dot direction: points towards
left shoulder(900 clockwise from PLAX
view)
By tilting transducer on an axis
between the left hip and right
shoulder, short axis views are obtained
at different levels, from the aorta to
the LV apex.
Many structures seen
Papillary Muscle (PM)level
26
PSAX at the level of the papillary
muscles showing how the respective
LV segments are identified, usually
for the purposes of describing
abnormal LV wall motion
LV wall thickness can also be
assessed
2. Apical 4-Chamber View (AP4CH)
27
Transducer position: apex of
heart
Marker dot direction: points
towards left shoulder
Apical 4-Chamber View (AP4CH)
The AP5CH view
 The AP5CH view is obtained
from this view by slight
anterior angulation of the
transducer towards the chest
wall.
 The LVOT can then be
visualised
Apical 2-Chamber View (AP2CH)
35
Transducer position: apex of the
heart
Marker dot direction: points
towards left side of neck (450
anticlockwise from AP4CH view)
Good for assessment of
LV anterior wall
LV inferior wall
Apical 2-Chamber View (AP2CH)
3. Sub–Costal 4 Chamber View(SC4CH)
38
Transducer position: under the xiphisternum
Marker dot position: points towards left shoulder
The subject lies supine with head slightly low (no pillow). With feet on
the bed, the knees are slightly elevated
Better images are obtained with the abdomen relaxed and during
inspiration
Interatrial septum, pericardial effusion, desc abdominal aorta
Sub–Costal 4 Chamber View(SC4CH)
4.Suprasternal View
41
Transducer position: suprasternal notch
Marker dot direction: points towards
left jaw
The subject lies supine with the neck
hyperexrended. The head is rotated
slightly towards the left
The position of arms or legs and the
phase of respiration have no bearing on
this echo window
Arch of aorta
The Modalities of Echo
43
The following modalities of echo are used clinically:
1. Conventional echo
Two-Dimensional echo (2-D echo)
Motion- mode echo (M-mode echo)
2. Doppler Echo
Continuous wave (CW) Doppler
Pulsed wave (PW) Doppler
Colour flow(CF) Doppler
All modalities follow the same principle of
ultrasound
Differ in how reflected sound waves are collected
and analysed
1. Two-Dimensional Echo (2-D echo)
44
This technique is used to "see" the actual
structures and motion of the heart
structures at work.
Ultrasound is transmitted along several
scan lines(90-120), over a wide arc(about
900) and many times per second.
The combination of reflected ultrasound
signals builds up an image on the display
screen.
A 2-D echo view appears cone shaped on
the monitor.
2. M-Mode echocardiography
45
An M- mode echocardiogram is not a
"picture" of the heart, but rather a
diagram that shows how the positions
of its structures change during the
course of the cardiac cycle.
M-mode recordings permit
measurement of cardiac dimensions
and motion patterns.
Also facilitate analysis of time
relationships with other physiological
variables such as ECG, and heart
sounds.
Modes of ECHO
 A mode: basic mode - single scan line is passed through heart
 B mode: repetative scan lines
 M mode: movement of the heart can be obtained as a time-
motion or M mode recording providing dynamic cardiac images.
 2D echo: acquires multiple B mode scan lines that are alligned in
the appropriate anatomic location to form a wedge shaped
sector image that provides additional spatial information in
either superoinferior or mediolateral directions.
3. Doppler echocardiography
49
Doppler echocardiography is a method for
detecting the direction and velocity of
moving blood within the heart.
Pulsed Wave (PW) useful for low velocity
flow e.g. MV flow
Continuous Wave (CW) useful for high
velocity flow e.g aortic stenosis
Color Flow (CF) Different colors are used
to designate the direction of blood flow.
red is flow toward, and blue is flow away
from the transducer with turbulent flow
shown as a mosaic pattern.
Transesophageal echocardiogram (TEE)
Used to assess posterior structures likeLA or Aorta
Clinical success of transesophageal echocardiography:-
 First, the close proximity of the esophagus to the posterior wall of the
heart makes this approach ideal for examining several important
structures.
 Second, the ability to position the transducer in the esophagus or
stomach for extended periods provides an opportunity to monitor the
heart over time, such as during cardiac surgery.
 Third, although more invasive than other forms of echocardiography,
the technique has proven to be extremely safe and well tolerated so
that it can be performed in critically ill patients and very small infants.
53
Contraindications to
Transesophageal Echocardiography
 Esophageal pathology
Severe dysphagia
Esophageal stricture
Esophageal diverticula
Bleeding esophageal varices
Esophageal cancer
 Cervical spine disorders
Severe atlantoaxial joint disorders
Orthopedic conditions that prevent neck flexion
55
Epicardial Imaging
 Application of an ultrasound probe directly to the cardiac
structures provides a high-resolution, non obstructive view of
cardiac structures.
 Because these probes are placed directly on the beating heart
or vasculature, they must be either sterilized or more
commonly placed in a sterile insulating sheath before use.
56
Intracardiac Echocardiography
 Intracardiac echocardiography involves a single-plane, high-
frequency transducer (typically 10 MHz) on the tip of a steerable
intravascular catheter, typically 9 to 13 French in size.
 Intravascular Ultrasound (IVUS)
these are ultraminiaturized ultrasound transducers mounted on
modified intracoronary catheters. Both phased-array and
mechanical rotational devices have been developed. These
devices operate at frequencies of 10 to 30 MHz and provide
circumferential 360-degree imaging.
57
STRESS ECHO
 Stress echo is a family of examinations in which 2D
echocardiographic monitoring is undertaken
before , during & after cardiovascular stress
 Cardiovascular stress  exercise
pharmacological agents
58
BASIC PRINCIPLES OF STRESS ECHO
 ↑ Cardiac work load - ↑O2 demands- demand supply
mismatch- ischemia
 Impairment of myocardial thickening and endocardial
motion
59
60
Conclusion
61
Echocardiography provides a substantial amount
of structural and functional information about
the heart.
Still frames provide anatomical detail.
Dynamic images tell us about physiological
function
The quality of an echo is highly operator
dependent and proportional to experience and
skill, therefore the value of information derived
depends heavily upon who has performed it
THANK YOU
Indications for Echo
• Assessment of LV function
• Most common reason an echo is ordered
• Most useful measurement is Ejection Fraction
• Difference in LV volume at end-systole and end-diastole
• Normal range is 55%-65%
• Wall motion abnomalities (WMA) can be described
• Hypokinesis- LV contraction is diminished
• Akinesis- no contraction
• Dyskinesis- uncoordinated contraction
• Murmurs
• Abnormal heart sounds caused by abnormal blood flow through the heart
• Valvular heart disease
• Increased flow across normal valve
• Shunts due to congenital or acquired defects
• Tumors
• Aortic Valve Disease
• Aortic Stenosis
• Assess valve opening and mobility of cusps
• Note presence of calcium or thickening
• Measure velocity of blood flow across valve
• Calculate valve area
• Aortic Regurgitation
• Assessed using Doppler
• Mitral Valve Disease
• Mitral Regurgitation
• Assess closure of valve leaflets
• Assess with Doppler
• Mitral Stenosis
• Caused by rheumatic heart disease
• Check for abnormal thickening and opening of leaflets
• Atrial Fibrillation
• Can be related to valvular disease, CAD, diastolic dysfunction, or
cardiomyopathy
• Echos can assess any underlying problems and guide treatment
• Best to control rate before study
• Patients with major structural abnormalities, significant LV systolic dysfunction,
or LA diameter >4.5 cm are less likely to maintain SR after CV
• Stroke/TIA
• Up to 20% of CVA’s may be caused by cardiac emboli
• TTE rarely shows a direct source of emboli (such as thrombus, vegetations, or tumors)
• Shows abnormalities which predispose a patient to embolization (such as MV disease,
PFO, or LV aneurysm)
• TEE is an effective screening tool to detect LAA thrombus before CV of AF and AF ablation
procedures
• Infective Endocarditis
• Bacterial infection of heart valves
• Established bacteria is called a vegetation
• Damaged and abnormal valves are at higher risk
• Acute (staph) versus subacute (strep)
• Symptoms: fever, murmur, emboli, stroke
• IV drug abuse can increase risk of bacterial endocarditis
• Can also be used in setting of suspected device system infection
• Assessment of Artificial Valves
• Can be used for tissue and mechanical valves
• Check for regurgitation and leaking of blood around
valve annulus
• Check velocity of blood flow through the valve
• Assessment of Artificial Valves
• Can be used for tissue and mechanical valves
• Check for regurgitation and leaking of blood around
valve annulus
• Check velocity of blood flow through the valve
basicechocardiography-170913182344 (2).pdf

basicechocardiography-170913182344 (2).pdf

  • 1.
    BASIC ECHOCARDIOGRAPHY PRESENTOR :- DR.ASHUTOSH DATE:- 14/09/2017
  • 2.
    Echo 2 Echo is somethingyou experience all the time. If you shout into a well, the echo comes back a moment later. The echo occurs because some of the sound waves in your shout reflect off a surface (either the water at the bottom of the well or the wall on the far side) and travel back to your ears. A similar principle applies in cardiac ultrasound.
  • 3.
    History In 1842, ChristianJohann Doppler (1803-1853) noted that the pitch of a sound wave varied if the source of the sound was moving. The ability to create ultrasonic waves came in 1880 with the discovery of piezoelectricity by Curie and Curie. Dr. Helmut Hertz of Sweden in 1953 obtained a commercial ultrasonoscope, which was being used for nondestructive testing. He then collaborated with Dr. Inge Edler who was a practicing cardiologist in Sweden. The two of them began to use this commercial ultrasonoscope to examine the heart. This collaboration is commonly accepted as the beginning of clinical echocardiography as we know it today. 3
  • 4.
    Generation Of AnUltrasound Image 4 Echocardiography (echo or echocardiogram) is a type of ultrasound test that uses high-pitched sound waves to produce an image of the heart. The sound waves are sent through a device called a transducer and are reflected off the various structures of the heart. These echoes are converted into pictures of the heart that can be seen on a video monitor. There is no special preparation for the test.
  • 5.
    5 Ultrasound gel isapplied to the transducer to allow transmission of the sound waves from the transducer to the skin The transducer transforms the echo (mechanical energy) into an electrical signal which is processed and displayed as an image on the screen. The conversion of sound to electrical energy is called the piezoelectric effect
  • 8.
    Machines 8 There are 5basic components of an ultrasound scanner that are required for generation, display and storage of an ultrasound image. 1. Pulse generator - applies high amplitude voltage to energize the crystals 2. Transducer - converts electrical energy to mechanical (ultrasound) energy and vice versa 3. Receiver - detects and amplifies weak signals 4. Display - displays ultrasound signals in a variety of modes 5. Memory - stores video display
  • 9.
    THE TRANSDUCER  Thetransducer is responsible for both transmitting and receiving the ultrasound signal.  The transducer consist of a electrode and a piezo-electric crystal whose ionic structure results in deformation of shape when exposed to an electric current.  Piezo electric(PE) crystals are composed of synthetic material such as barium titanate which when exposed to electric current from the electrodes, alternately expand and contract to create sound waves. When subjected to the mechanical energy of sound from a returning surface, the same PE element change the shape thereby generating an electrical signal detected by the electrodes.
  • 12.
    TYPES  Transthoracic(standard echo) Leftparasternal Apical Subcostal Suprasternal  Transesophageal  Intracardiac 12
  • 13.
    Transthoracic Echo 13 A standardechocardiogram is also known as a transthoracic echocardiogram (TTE), or cardiac ultrasound. The subject is asked to lie in the semi recumbent position on his or her left side with the head elevated. The left arm is tucked under the head and the right arm lies along the right side of the body Standard positions on the chest wall are used for placement of the transducer called “echo windows”
  • 14.
  • 15.
    15 Standard positions onthe chest wall are used for placement of the transducer called “ echo windows”
  • 16.
  • 17.
    1.Parasternal Long-Axis View (PLAX) 17 Transducerposition: left sternal edge; 2nd – 4th intercostal space Marker dot direction: points towards right shoulder Most echo studies begin with this view It sets the stage for subsequent echo views Many structures seen from this view
  • 19.
  • 22.
    Parasternal Short AxisView (PSAX) 22 Transducer position: left sternal edge; 2nd – 4th intercostal space Marker dot direction: points towards left shoulder(900 clockwise from PLAX view) By tilting transducer on an axis between the left hip and right shoulder, short axis views are obtained at different levels, from the aorta to the LV apex. Many structures seen
  • 26.
    Papillary Muscle (PM)level 26 PSAXat the level of the papillary muscles showing how the respective LV segments are identified, usually for the purposes of describing abnormal LV wall motion LV wall thickness can also be assessed
  • 27.
    2. Apical 4-ChamberView (AP4CH) 27 Transducer position: apex of heart Marker dot direction: points towards left shoulder
  • 29.
  • 33.
    The AP5CH view The AP5CH view is obtained from this view by slight anterior angulation of the transducer towards the chest wall.  The LVOT can then be visualised
  • 35.
    Apical 2-Chamber View(AP2CH) 35 Transducer position: apex of the heart Marker dot direction: points towards left side of neck (450 anticlockwise from AP4CH view) Good for assessment of LV anterior wall LV inferior wall
  • 37.
  • 38.
    3. Sub–Costal 4Chamber View(SC4CH) 38 Transducer position: under the xiphisternum Marker dot position: points towards left shoulder The subject lies supine with head slightly low (no pillow). With feet on the bed, the knees are slightly elevated Better images are obtained with the abdomen relaxed and during inspiration Interatrial septum, pericardial effusion, desc abdominal aorta
  • 40.
  • 41.
    4.Suprasternal View 41 Transducer position:suprasternal notch Marker dot direction: points towards left jaw The subject lies supine with the neck hyperexrended. The head is rotated slightly towards the left The position of arms or legs and the phase of respiration have no bearing on this echo window Arch of aorta
  • 43.
    The Modalities ofEcho 43 The following modalities of echo are used clinically: 1. Conventional echo Two-Dimensional echo (2-D echo) Motion- mode echo (M-mode echo) 2. Doppler Echo Continuous wave (CW) Doppler Pulsed wave (PW) Doppler Colour flow(CF) Doppler All modalities follow the same principle of ultrasound Differ in how reflected sound waves are collected and analysed
  • 44.
    1. Two-Dimensional Echo(2-D echo) 44 This technique is used to "see" the actual structures and motion of the heart structures at work. Ultrasound is transmitted along several scan lines(90-120), over a wide arc(about 900) and many times per second. The combination of reflected ultrasound signals builds up an image on the display screen. A 2-D echo view appears cone shaped on the monitor.
  • 45.
    2. M-Mode echocardiography 45 AnM- mode echocardiogram is not a "picture" of the heart, but rather a diagram that shows how the positions of its structures change during the course of the cardiac cycle. M-mode recordings permit measurement of cardiac dimensions and motion patterns. Also facilitate analysis of time relationships with other physiological variables such as ECG, and heart sounds.
  • 46.
    Modes of ECHO A mode: basic mode - single scan line is passed through heart  B mode: repetative scan lines  M mode: movement of the heart can be obtained as a time- motion or M mode recording providing dynamic cardiac images.  2D echo: acquires multiple B mode scan lines that are alligned in the appropriate anatomic location to form a wedge shaped sector image that provides additional spatial information in either superoinferior or mediolateral directions.
  • 49.
    3. Doppler echocardiography 49 Dopplerechocardiography is a method for detecting the direction and velocity of moving blood within the heart. Pulsed Wave (PW) useful for low velocity flow e.g. MV flow Continuous Wave (CW) useful for high velocity flow e.g aortic stenosis Color Flow (CF) Different colors are used to designate the direction of blood flow. red is flow toward, and blue is flow away from the transducer with turbulent flow shown as a mosaic pattern.
  • 53.
    Transesophageal echocardiogram (TEE) Usedto assess posterior structures likeLA or Aorta Clinical success of transesophageal echocardiography:-  First, the close proximity of the esophagus to the posterior wall of the heart makes this approach ideal for examining several important structures.  Second, the ability to position the transducer in the esophagus or stomach for extended periods provides an opportunity to monitor the heart over time, such as during cardiac surgery.  Third, although more invasive than other forms of echocardiography, the technique has proven to be extremely safe and well tolerated so that it can be performed in critically ill patients and very small infants. 53
  • 55.
    Contraindications to Transesophageal Echocardiography Esophageal pathology Severe dysphagia Esophageal stricture Esophageal diverticula Bleeding esophageal varices Esophageal cancer  Cervical spine disorders Severe atlantoaxial joint disorders Orthopedic conditions that prevent neck flexion 55
  • 56.
    Epicardial Imaging  Applicationof an ultrasound probe directly to the cardiac structures provides a high-resolution, non obstructive view of cardiac structures.  Because these probes are placed directly on the beating heart or vasculature, they must be either sterilized or more commonly placed in a sterile insulating sheath before use. 56
  • 57.
    Intracardiac Echocardiography  Intracardiacechocardiography involves a single-plane, high- frequency transducer (typically 10 MHz) on the tip of a steerable intravascular catheter, typically 9 to 13 French in size.  Intravascular Ultrasound (IVUS) these are ultraminiaturized ultrasound transducers mounted on modified intracoronary catheters. Both phased-array and mechanical rotational devices have been developed. These devices operate at frequencies of 10 to 30 MHz and provide circumferential 360-degree imaging. 57
  • 58.
    STRESS ECHO  Stressecho is a family of examinations in which 2D echocardiographic monitoring is undertaken before , during & after cardiovascular stress  Cardiovascular stress  exercise pharmacological agents 58
  • 59.
    BASIC PRINCIPLES OFSTRESS ECHO  ↑ Cardiac work load - ↑O2 demands- demand supply mismatch- ischemia  Impairment of myocardial thickening and endocardial motion 59
  • 60.
  • 61.
    Conclusion 61 Echocardiography provides asubstantial amount of structural and functional information about the heart. Still frames provide anatomical detail. Dynamic images tell us about physiological function The quality of an echo is highly operator dependent and proportional to experience and skill, therefore the value of information derived depends heavily upon who has performed it
  • 62.
  • 65.
    Indications for Echo •Assessment of LV function • Most common reason an echo is ordered • Most useful measurement is Ejection Fraction • Difference in LV volume at end-systole and end-diastole • Normal range is 55%-65% • Wall motion abnomalities (WMA) can be described • Hypokinesis- LV contraction is diminished • Akinesis- no contraction • Dyskinesis- uncoordinated contraction
  • 66.
    • Murmurs • Abnormalheart sounds caused by abnormal blood flow through the heart • Valvular heart disease • Increased flow across normal valve • Shunts due to congenital or acquired defects • Tumors • Aortic Valve Disease • Aortic Stenosis • Assess valve opening and mobility of cusps • Note presence of calcium or thickening • Measure velocity of blood flow across valve • Calculate valve area • Aortic Regurgitation • Assessed using Doppler
  • 67.
    • Mitral ValveDisease • Mitral Regurgitation • Assess closure of valve leaflets • Assess with Doppler • Mitral Stenosis • Caused by rheumatic heart disease • Check for abnormal thickening and opening of leaflets • Atrial Fibrillation • Can be related to valvular disease, CAD, diastolic dysfunction, or cardiomyopathy • Echos can assess any underlying problems and guide treatment • Best to control rate before study • Patients with major structural abnormalities, significant LV systolic dysfunction, or LA diameter >4.5 cm are less likely to maintain SR after CV
  • 68.
    • Stroke/TIA • Upto 20% of CVA’s may be caused by cardiac emboli • TTE rarely shows a direct source of emboli (such as thrombus, vegetations, or tumors) • Shows abnormalities which predispose a patient to embolization (such as MV disease, PFO, or LV aneurysm) • TEE is an effective screening tool to detect LAA thrombus before CV of AF and AF ablation procedures • Infective Endocarditis • Bacterial infection of heart valves • Established bacteria is called a vegetation • Damaged and abnormal valves are at higher risk • Acute (staph) versus subacute (strep) • Symptoms: fever, murmur, emboli, stroke • IV drug abuse can increase risk of bacterial endocarditis • Can also be used in setting of suspected device system infection
  • 69.
    • Assessment ofArtificial Valves • Can be used for tissue and mechanical valves • Check for regurgitation and leaking of blood around valve annulus • Check velocity of blood flow through the valve
  • 70.
    • Assessment ofArtificial Valves • Can be used for tissue and mechanical valves • Check for regurgitation and leaking of blood around valve annulus • Check velocity of blood flow through the valve