2
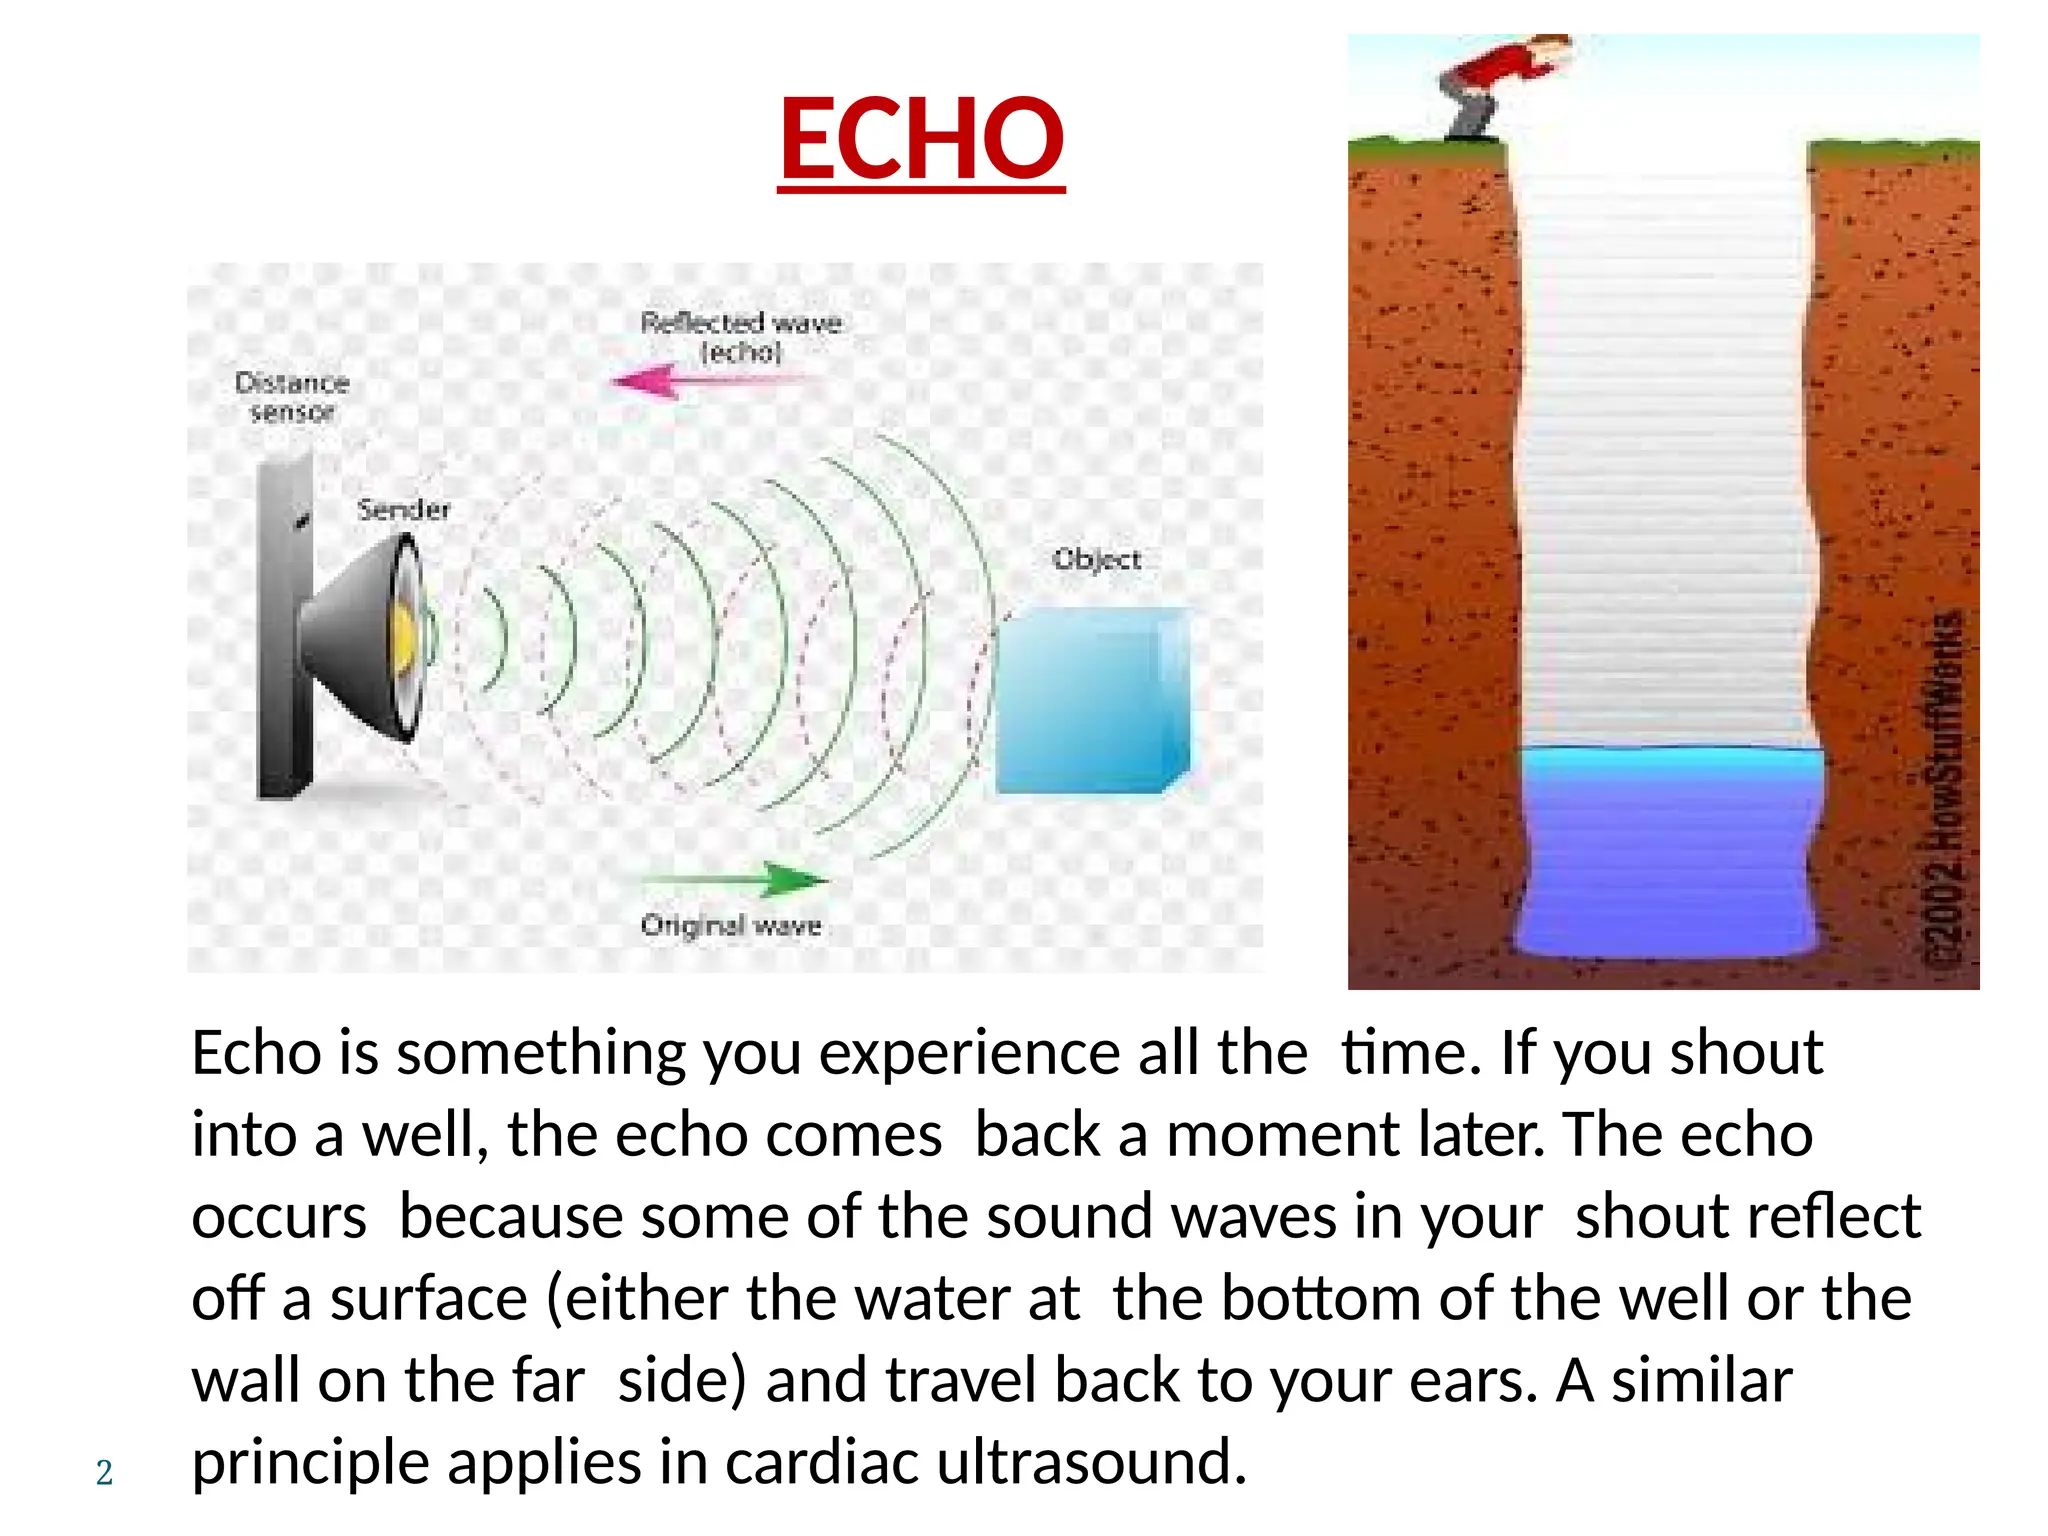
Echo is somethingyou experience all the time. If you shout
into a well, the echo comes back a moment later. The echo
occurs because some of the sound waves in your shout reflect
off a surface (either the water at the bottom of the well or the
wall on the far side) and travel back to your ears. A similar
principle applies in cardiac ultrasound.
ECHO
3.
HISTORY
Christian Andreas Doppler- Austrian
mathematician and physicist. (1803-
1853)
He is celebrated for his principle –
known as the Doppler effect (1842) –
that the observed frequency of a wave
depends on the relative speed of the
source and the observer.
He used this concept to explain the
colour of binary stars
4.
PIEZOELECTRIC EFFECT
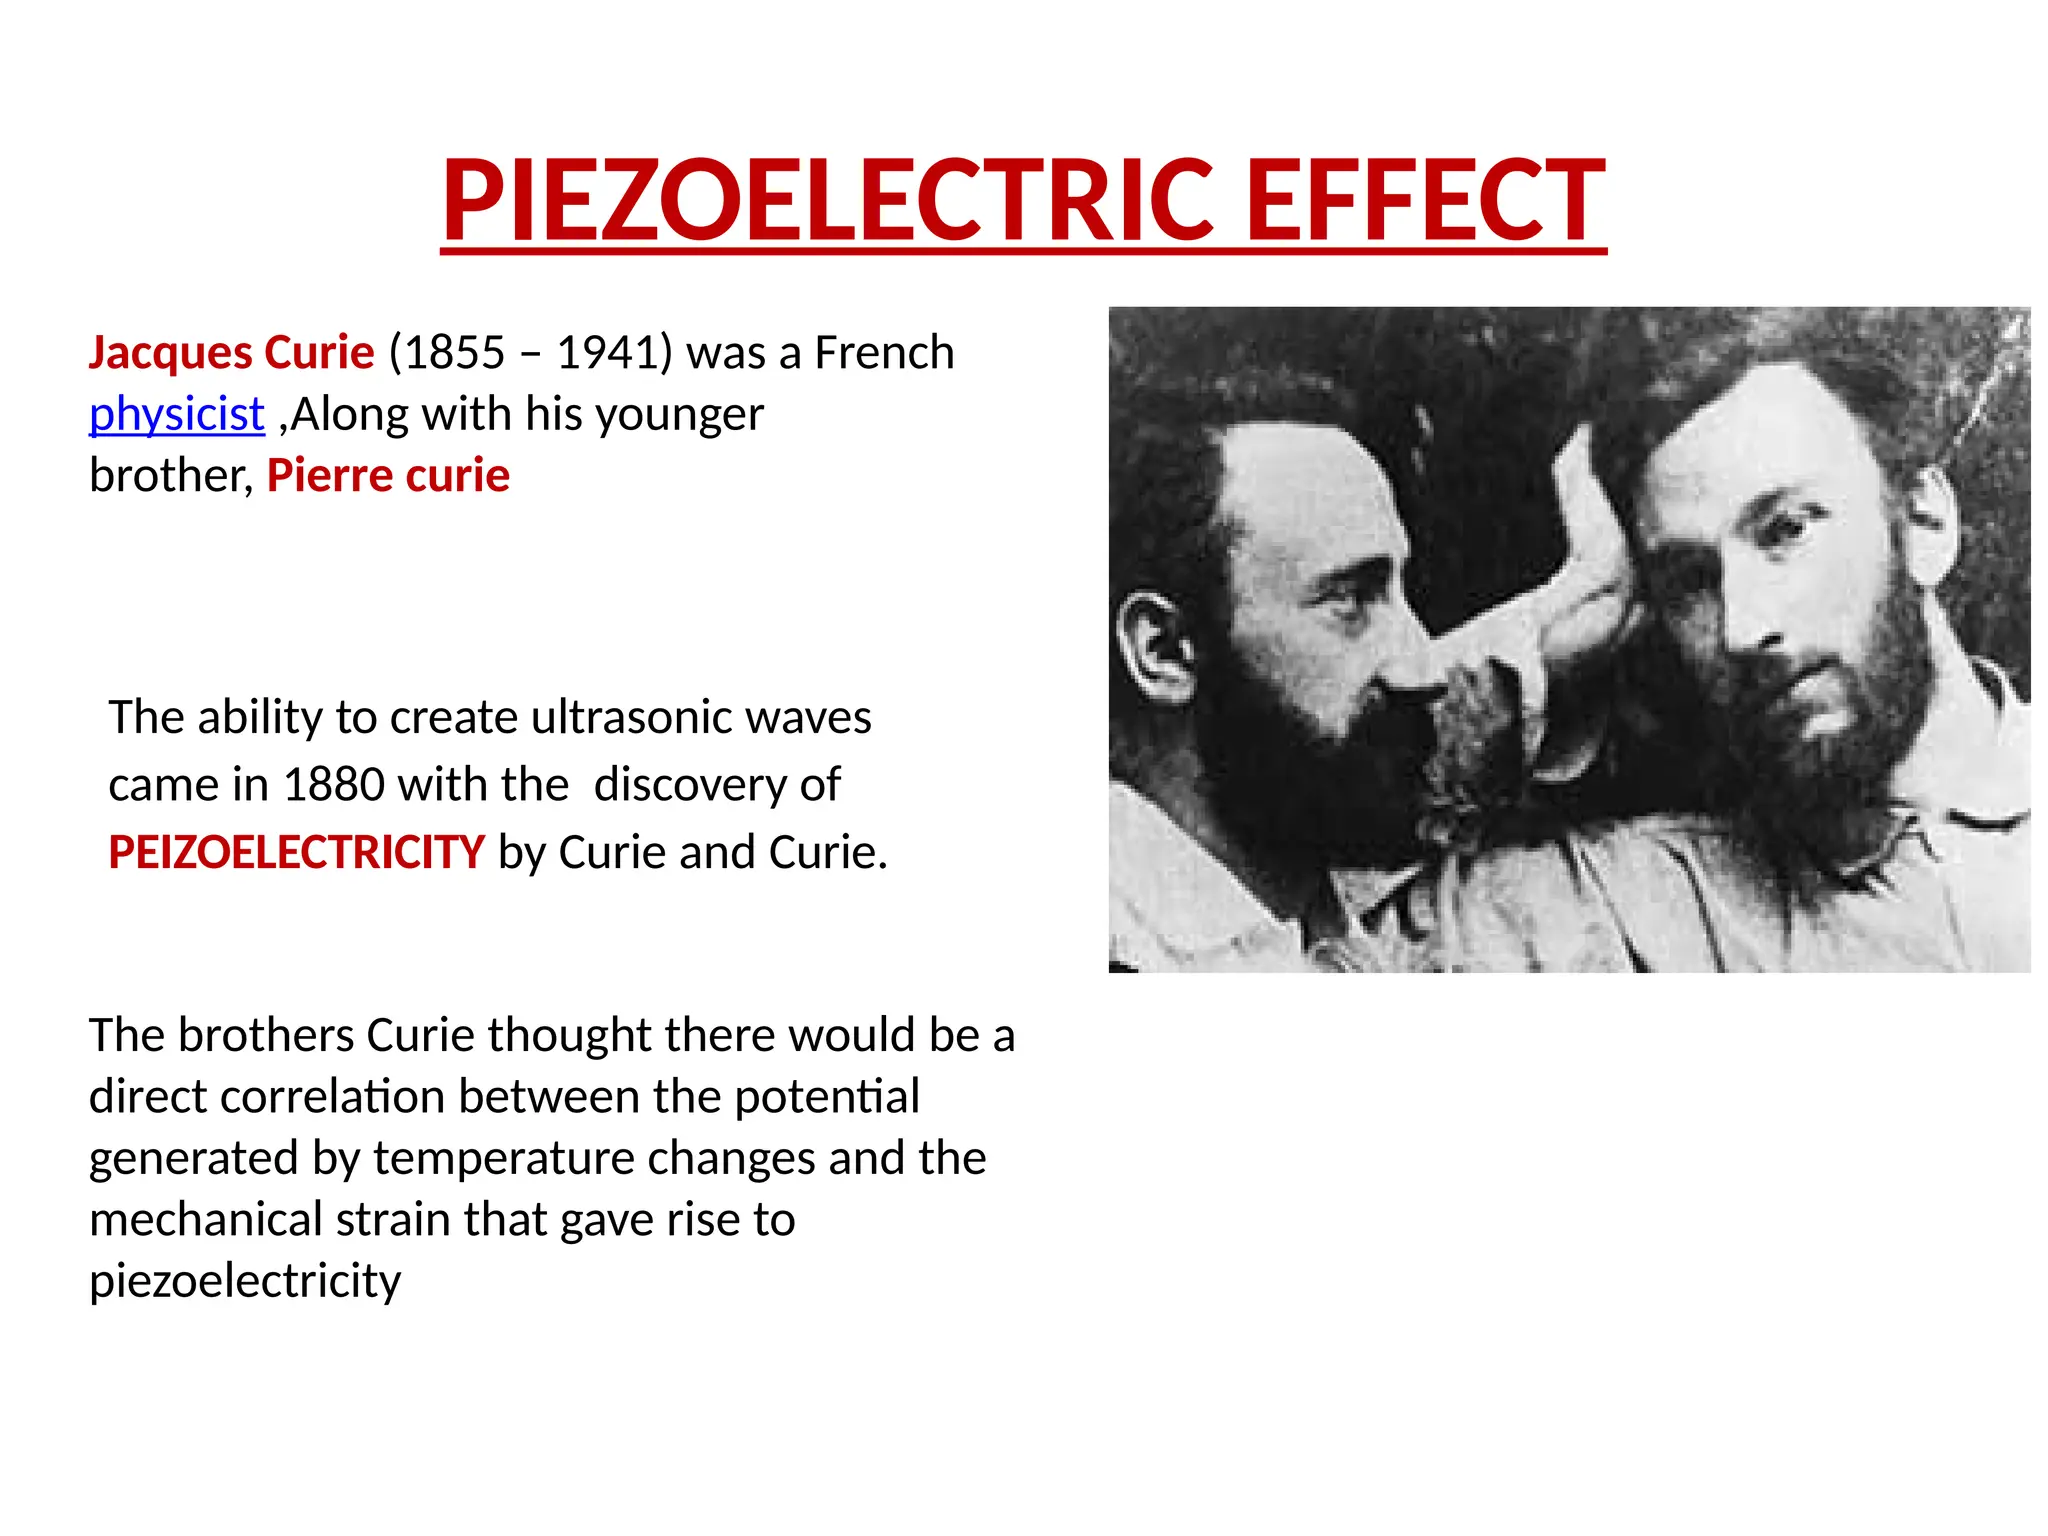
The abilityto create ultrasonic waves
came in 1880 with the discovery of
PEIZOELECTRICITY by Curie and Curie.
Jacques Curie (1855 – 1941) was a French
physicist ,Along with his younger
brother, Pierre curie
The brothers Curie thought there would be a
direct correlation between the potential
generated by temperature changes and the
mechanical strain that gave rise to
piezoelectricity
HISTORY
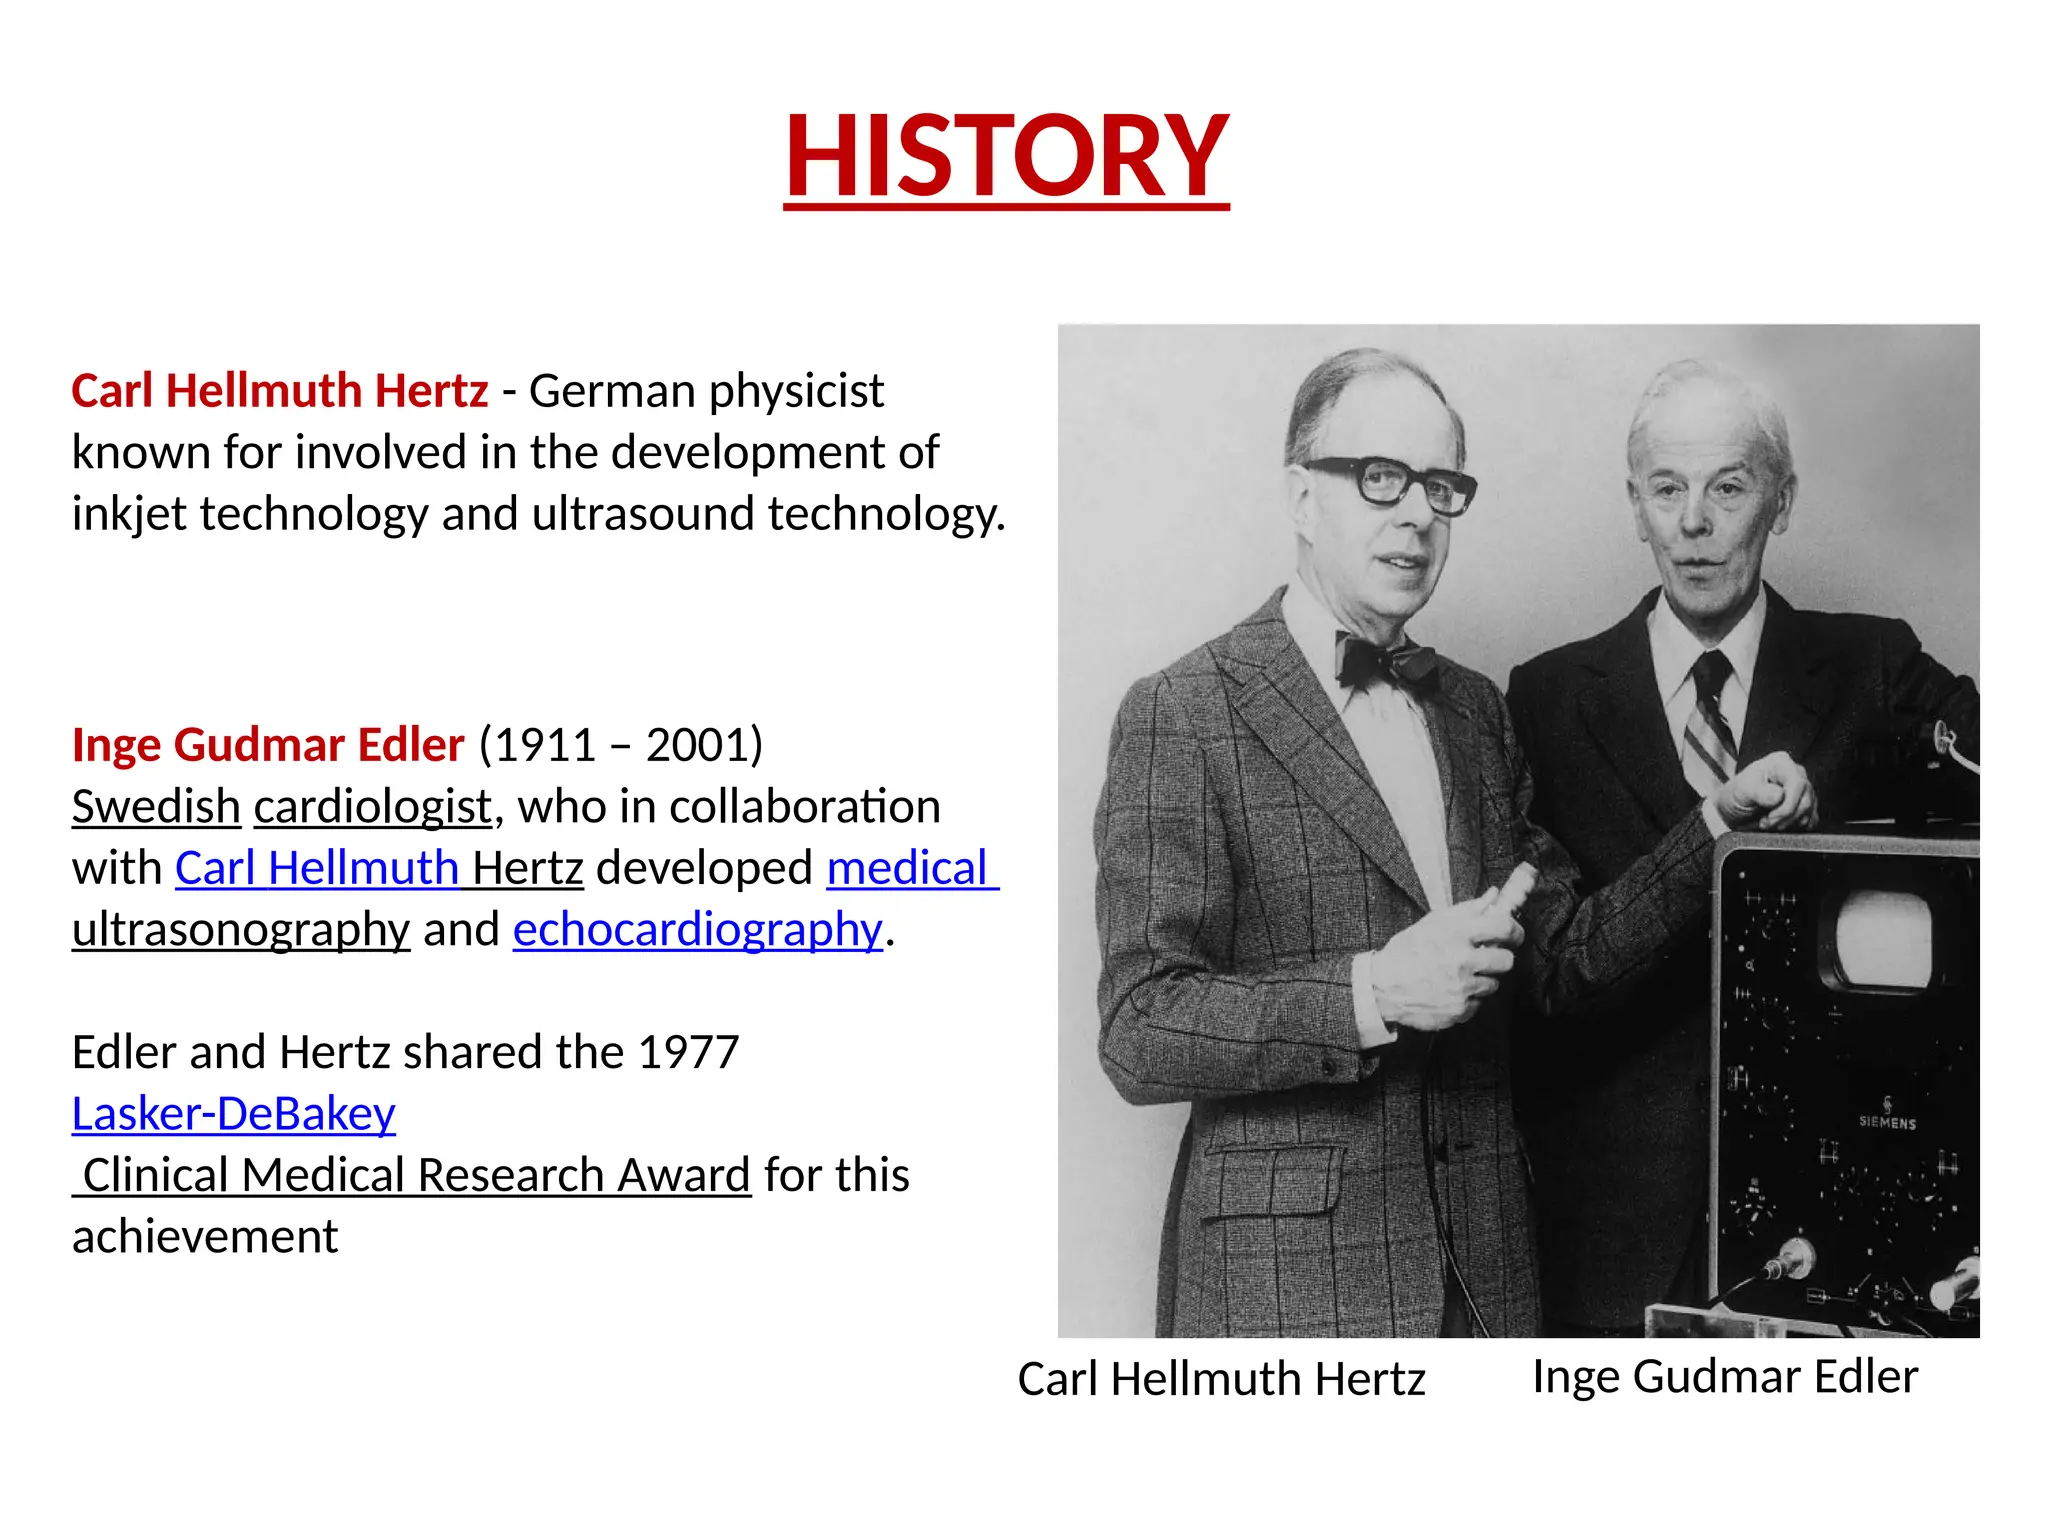
Carl Hellmuth Hertz- German physicist
known for involved in the development of
inkjet technology and ultrasound technology.
Carl Hellmuth Hertz
Inge Gudmar Edler (1911 – 2001)
Swedish cardiologist, who in collaboration
with Carl Hellmuth Hertz developed medical
ultrasonography and echocardiography.
Edler and Hertz shared the 1977
Lasker-DeBakey
Clinical Medical Research Award for this
achievement
Inge Gudmar Edler
7.
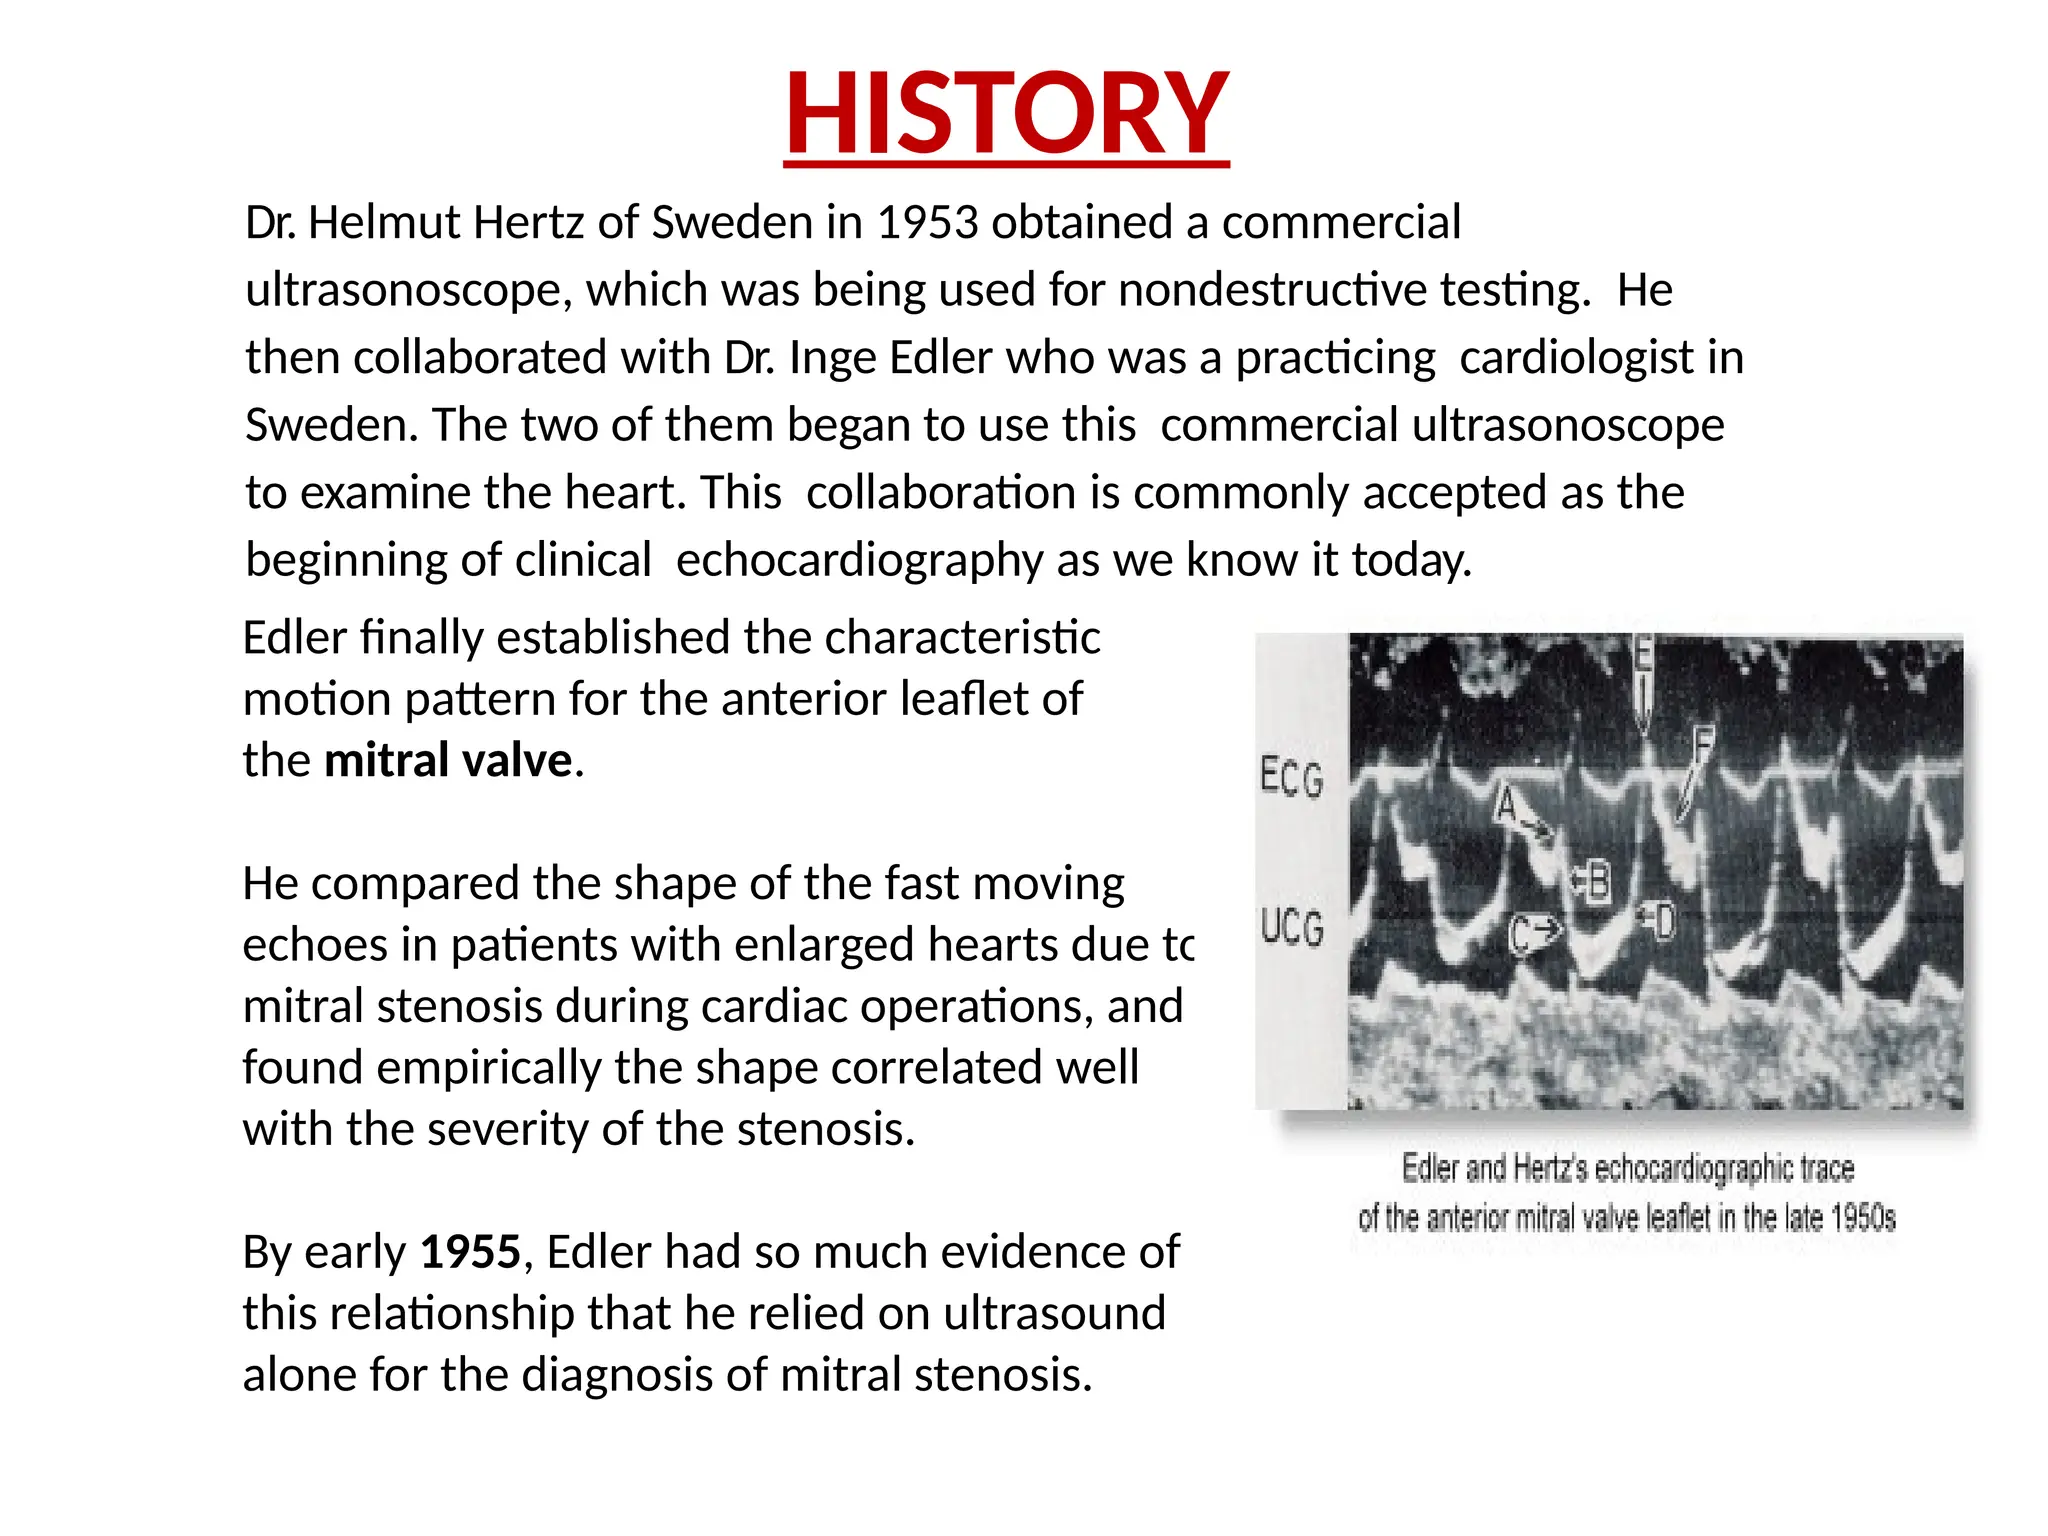
Dr. Helmut Hertzof Sweden in 1953 obtained a commercial
ultrasonoscope, which was being used for nondestructive testing. He
then collaborated with Dr. Inge Edler who was a practicing cardiologist in
Sweden. The two of them began to use this commercial ultrasonoscope
to examine the heart. This collaboration is commonly accepted as the
beginning of clinical echocardiography as we know it today.
Edler finally established the characteristic
motion pattern for the anterior leaflet of
the mitral valve.
He compared the shape of the fast moving
echoes in patients with enlarged hearts due to
mitral stenosis during cardiac operations, and
found empirically the shape correlated well
with the severity of the stenosis.
By early 1955, Edler had so much evidence of
this relationship that he relied on ultrasound
alone for the diagnosis of mitral stenosis.
HISTORY
8.
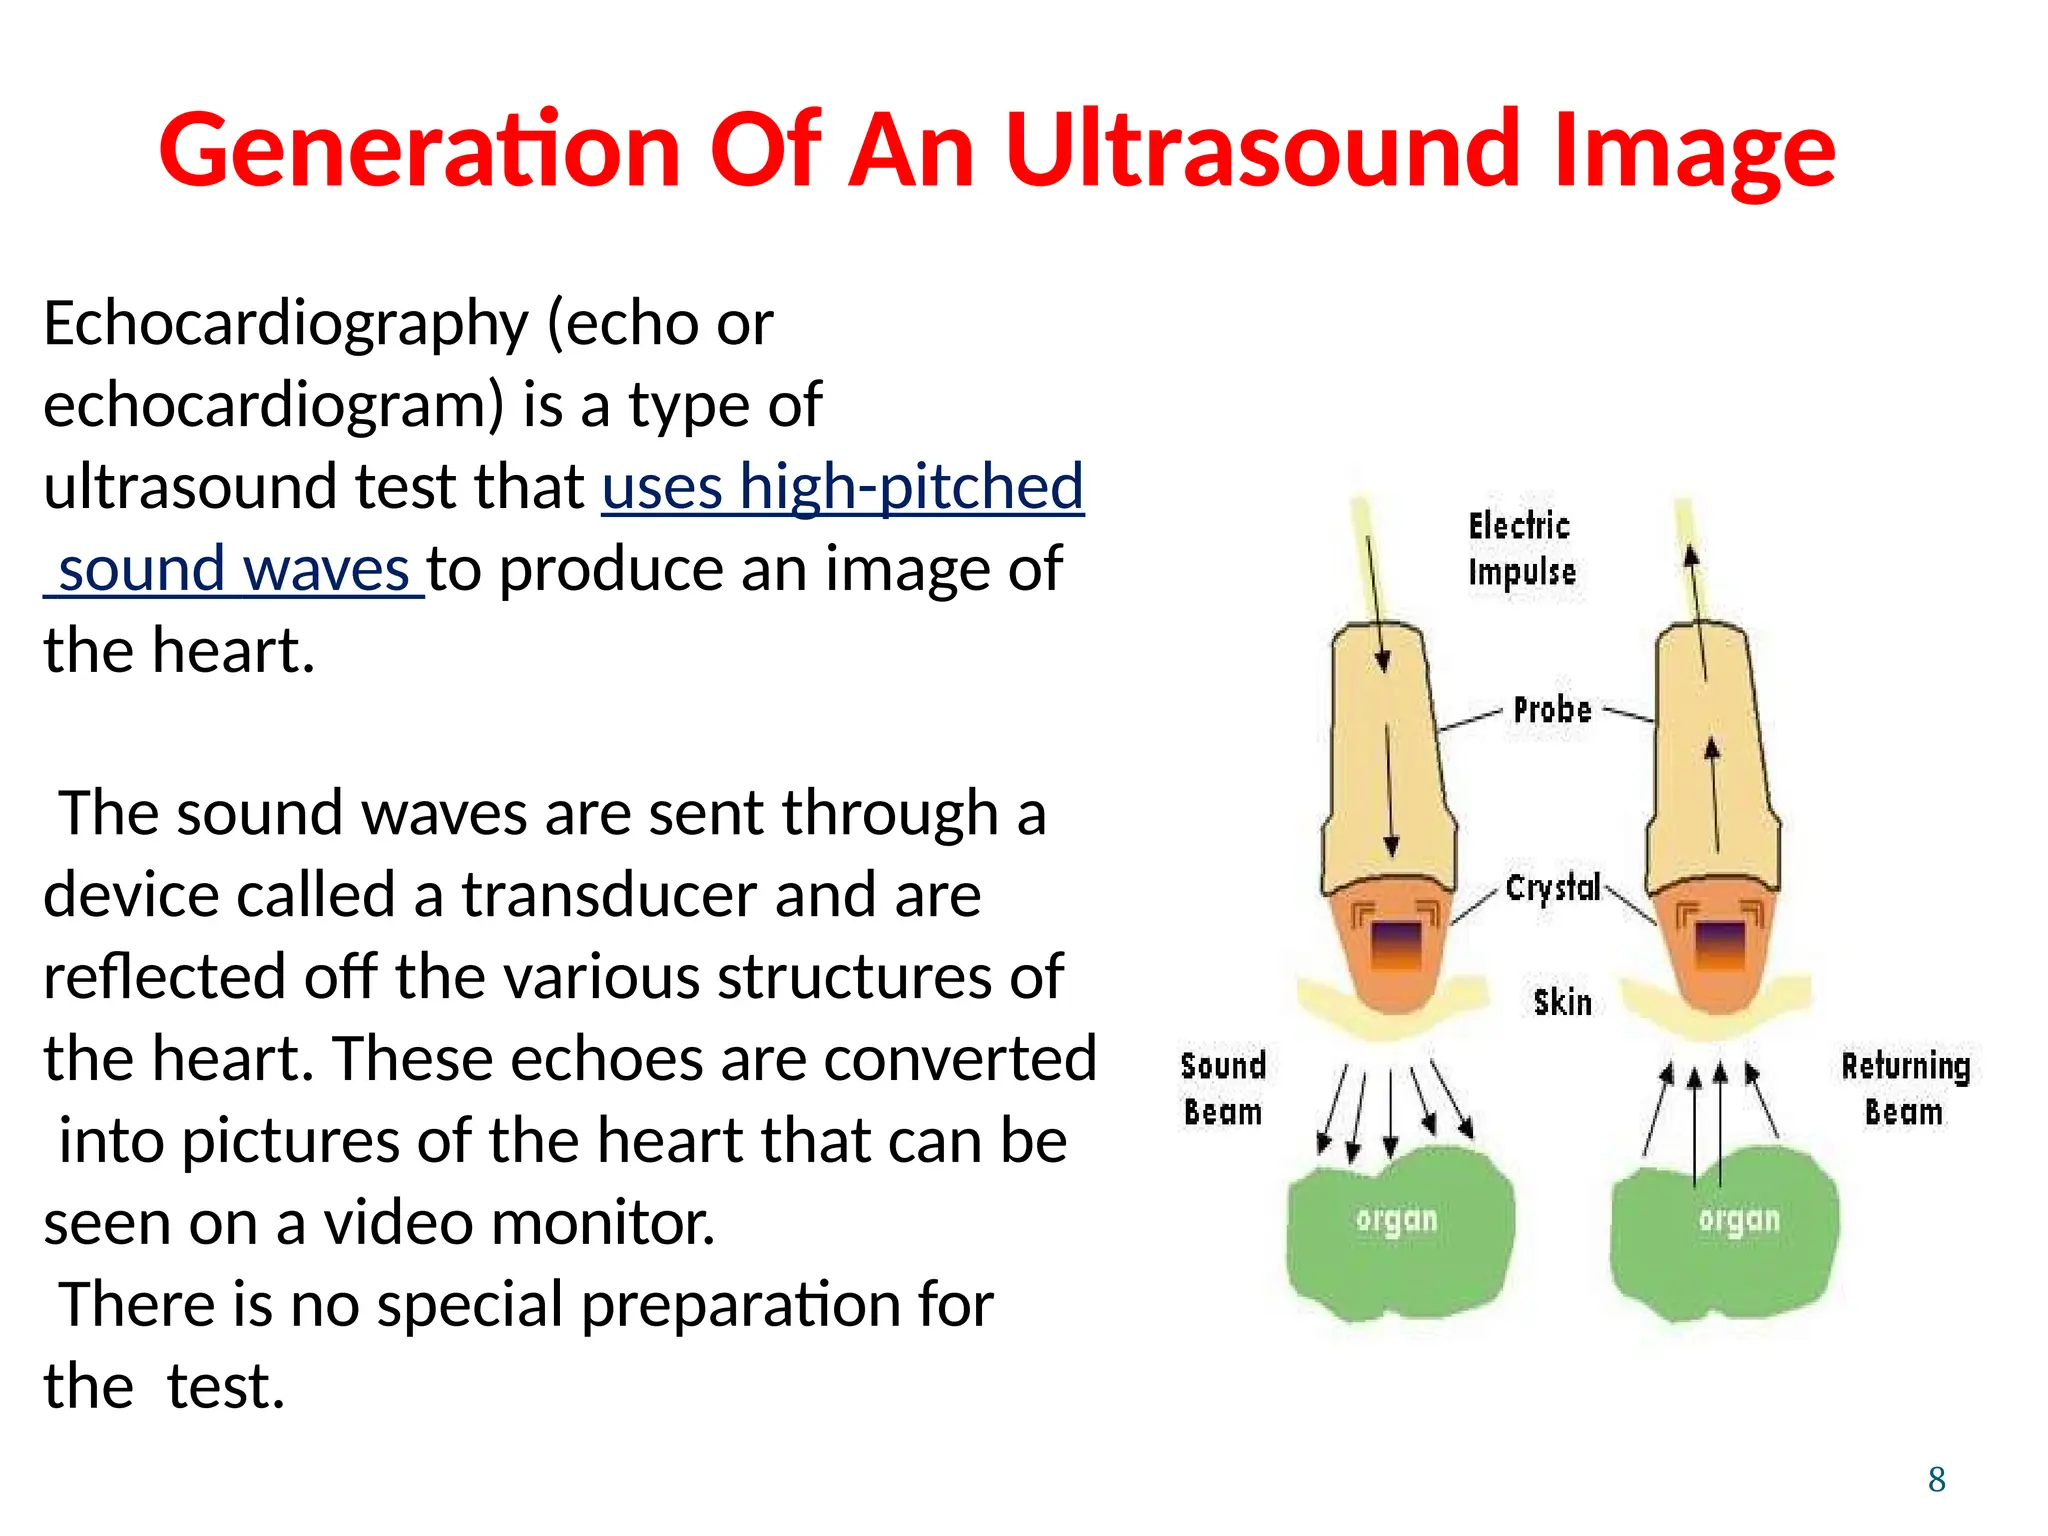
Generation Of AnUltrasound Image
Echocardiography (echo or
echocardiogram) is a type of
ultrasound test that uses high-pitched
sound waves to produce an image of
the heart.
The sound waves are sent through a
device called a transducer and are
reflected off the various structures of
the heart. These echoes are converted
into pictures of the heart that can be
seen on a video monitor.
There is no special preparation for
the test.
8
9.
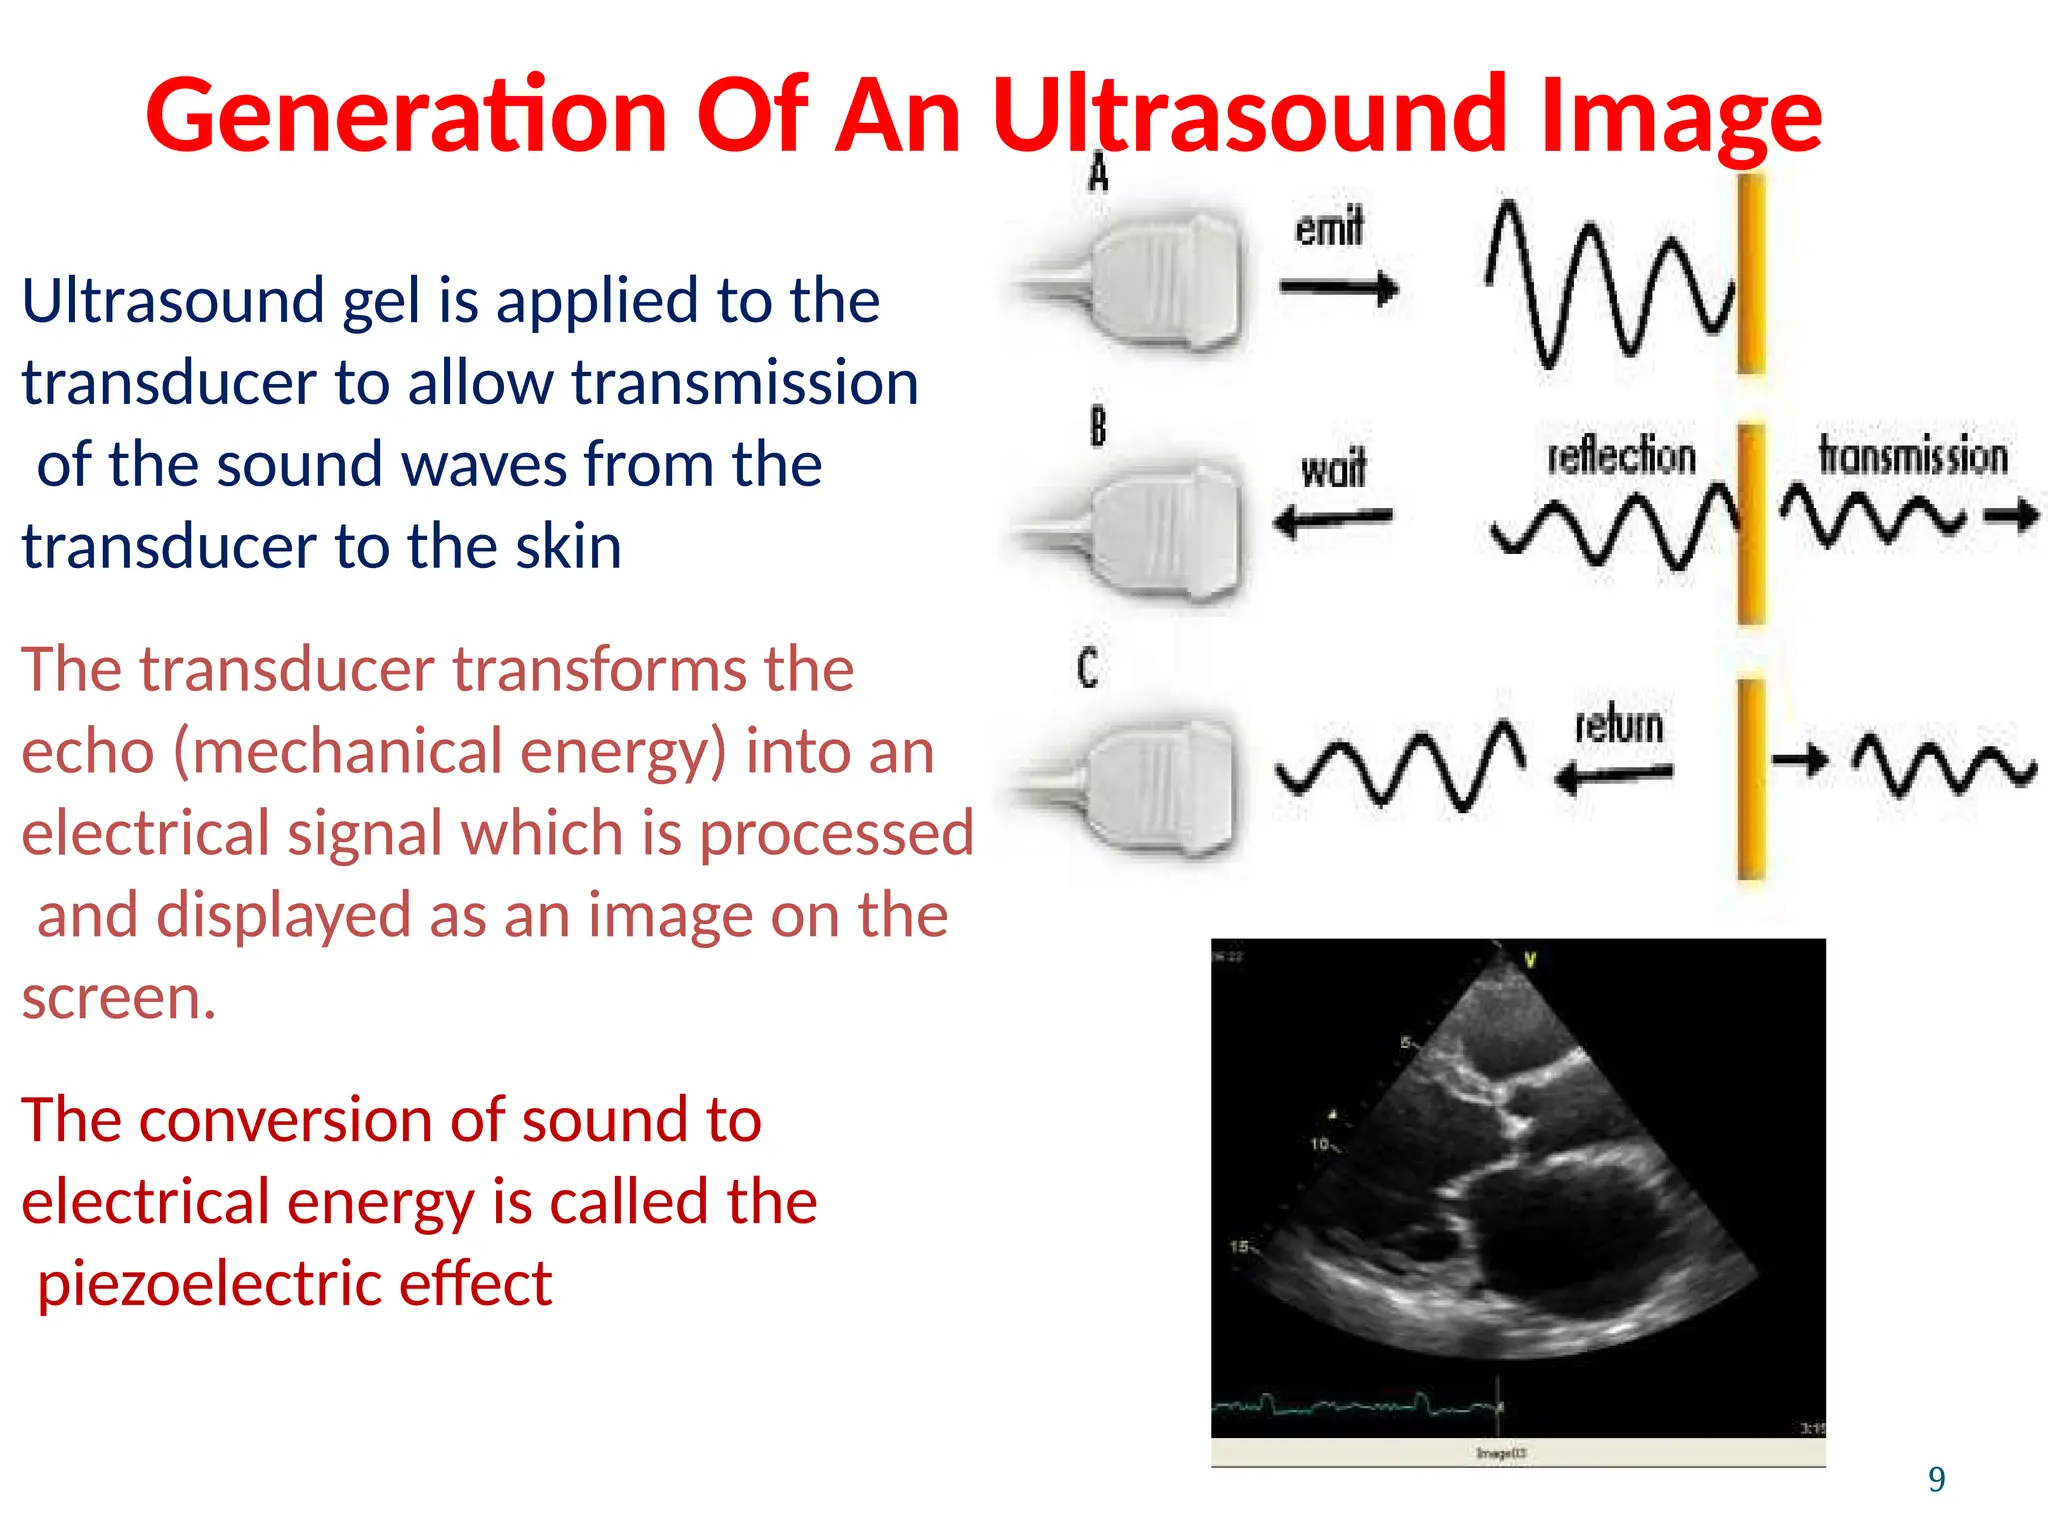
Ultrasound gel isapplied to the
transducer to allow transmission
of the sound waves from the
transducer to the skin
The transducer transforms the
echo (mechanical energy) into an
electrical signal which is processed
and displayed as an image on the
screen.
The conversion of sound to
electrical energy is called the
piezoelectric effect
9
Generation Of An Ultrasound Image
11.
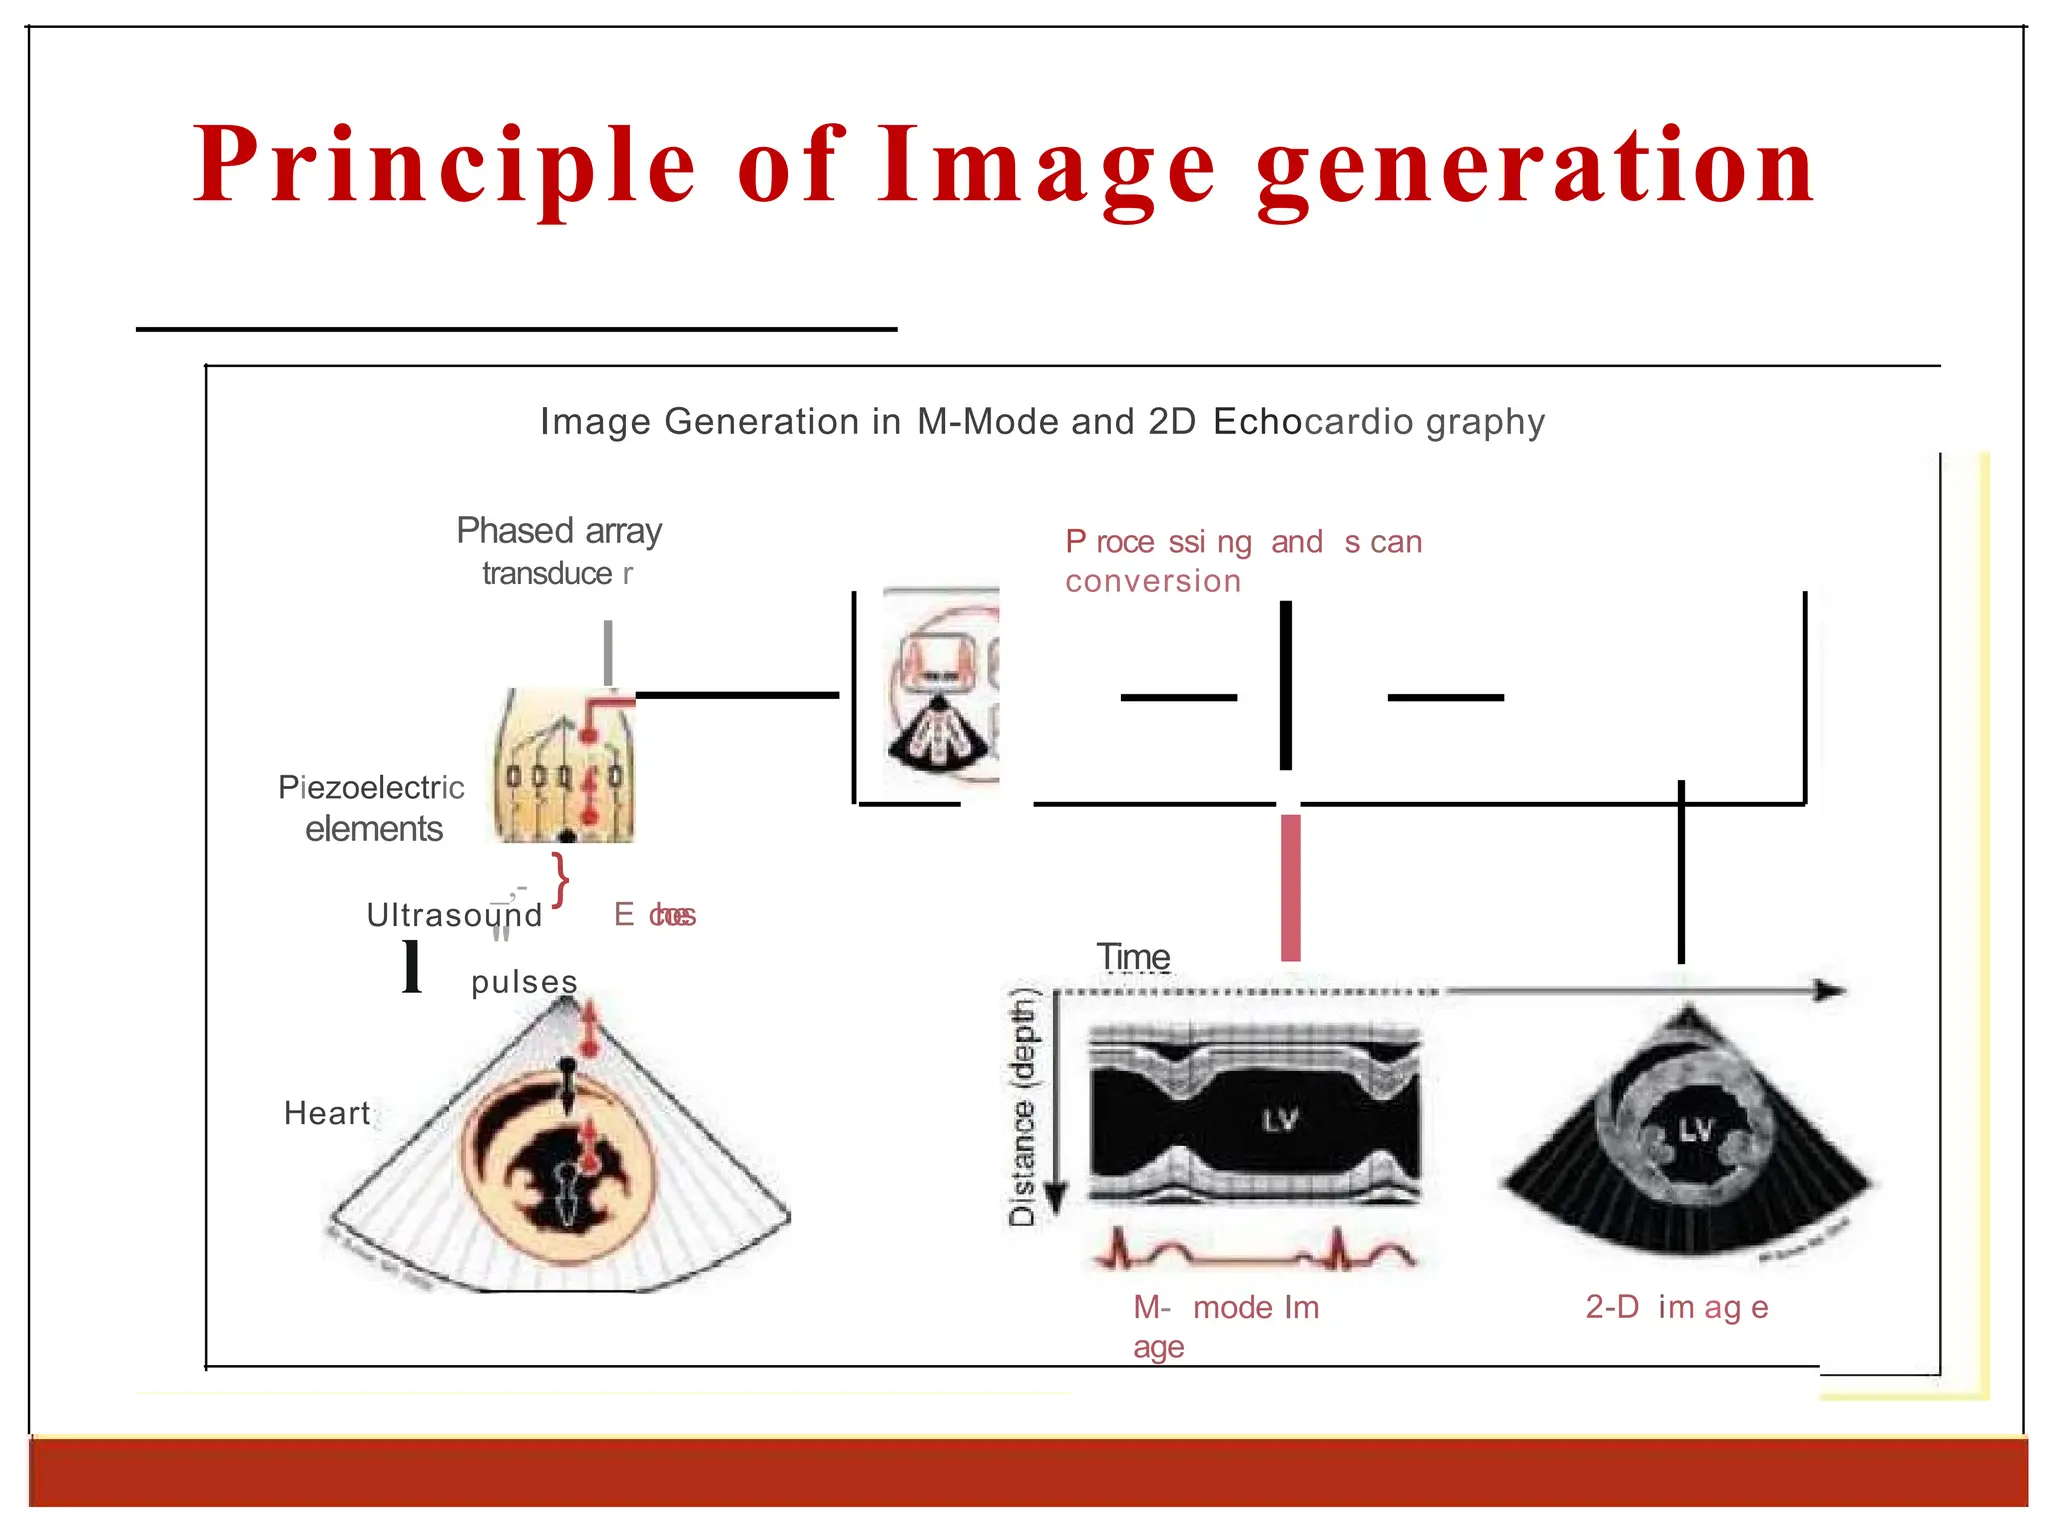
Principle of Imagegeneration
Image Generation in M-Mode and 2D Echocardio graphy
Phased array
transduce r
P roce ssi ng and s can
conversion
l
Piezoelectric
elements
_,- }
"
E c
h
o
e
s
Ultrasound
l pulses
Heart
Time I
M- mode Im
age
2-D im ag e
13.
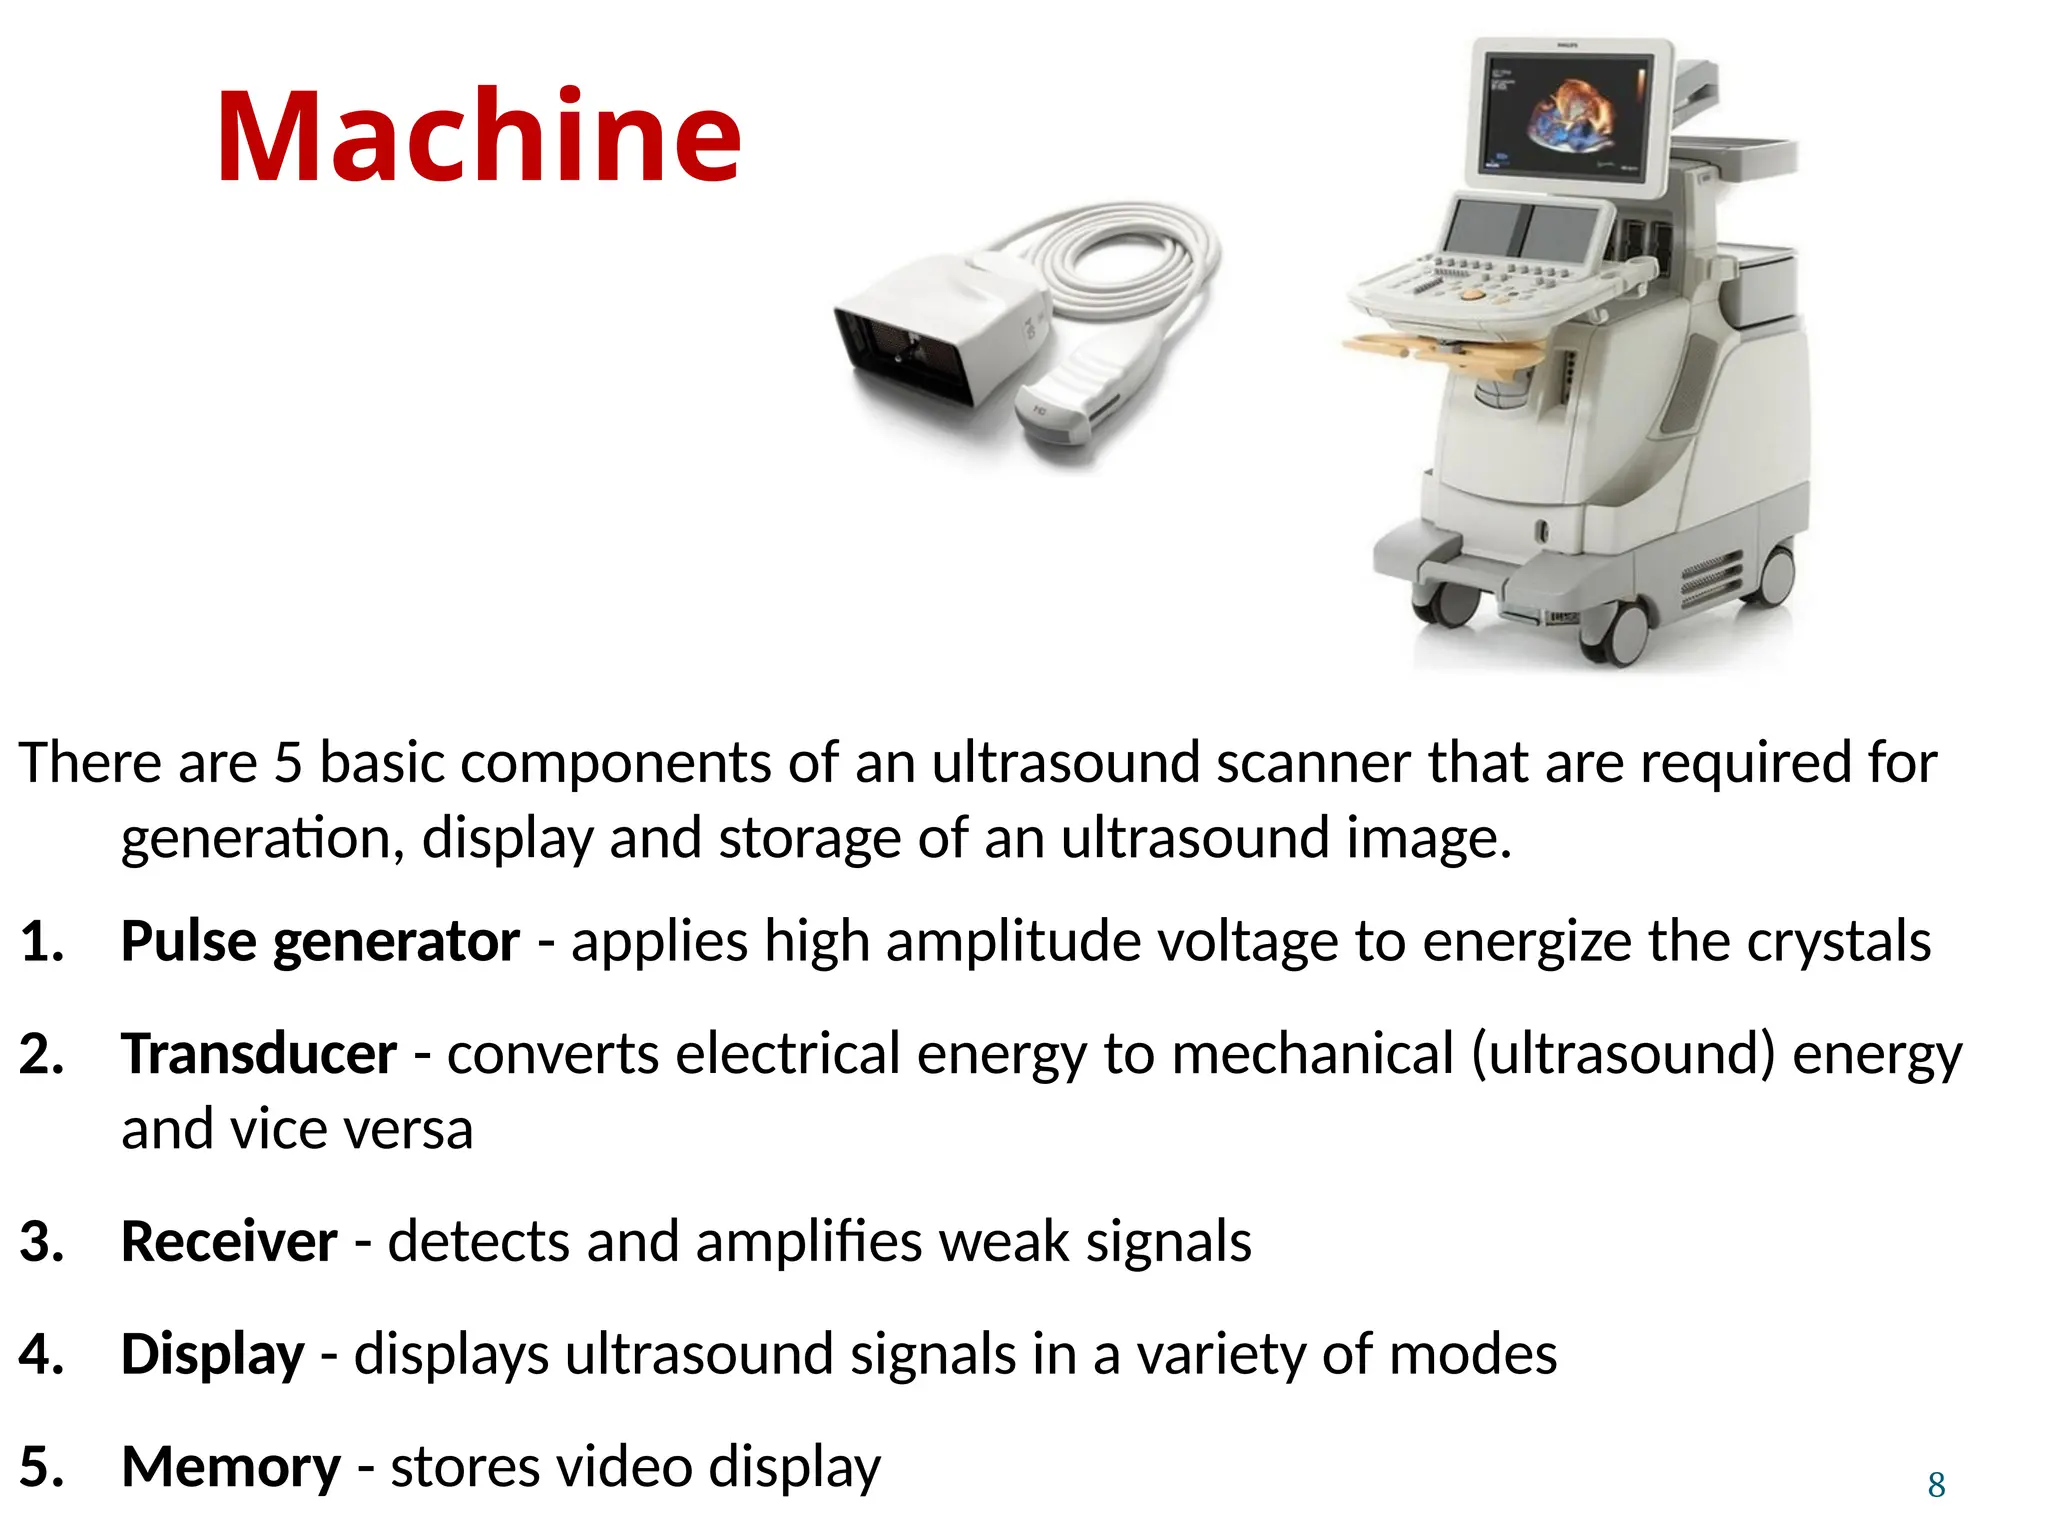
Machine
8
There are 5basic components of an ultrasound scanner that are required for
generation, display and storage of an ultrasound image.
1. Pulse generator - applies high amplitude voltage to energize the crystals
2. Transducer - converts electrical energy to mechanical (ultrasound) energy
and vice versa
3. Receiver - detects and amplifies weak signals
4. Display - displays ultrasound signals in a variety of modes
5. Memory - stores video display
14.
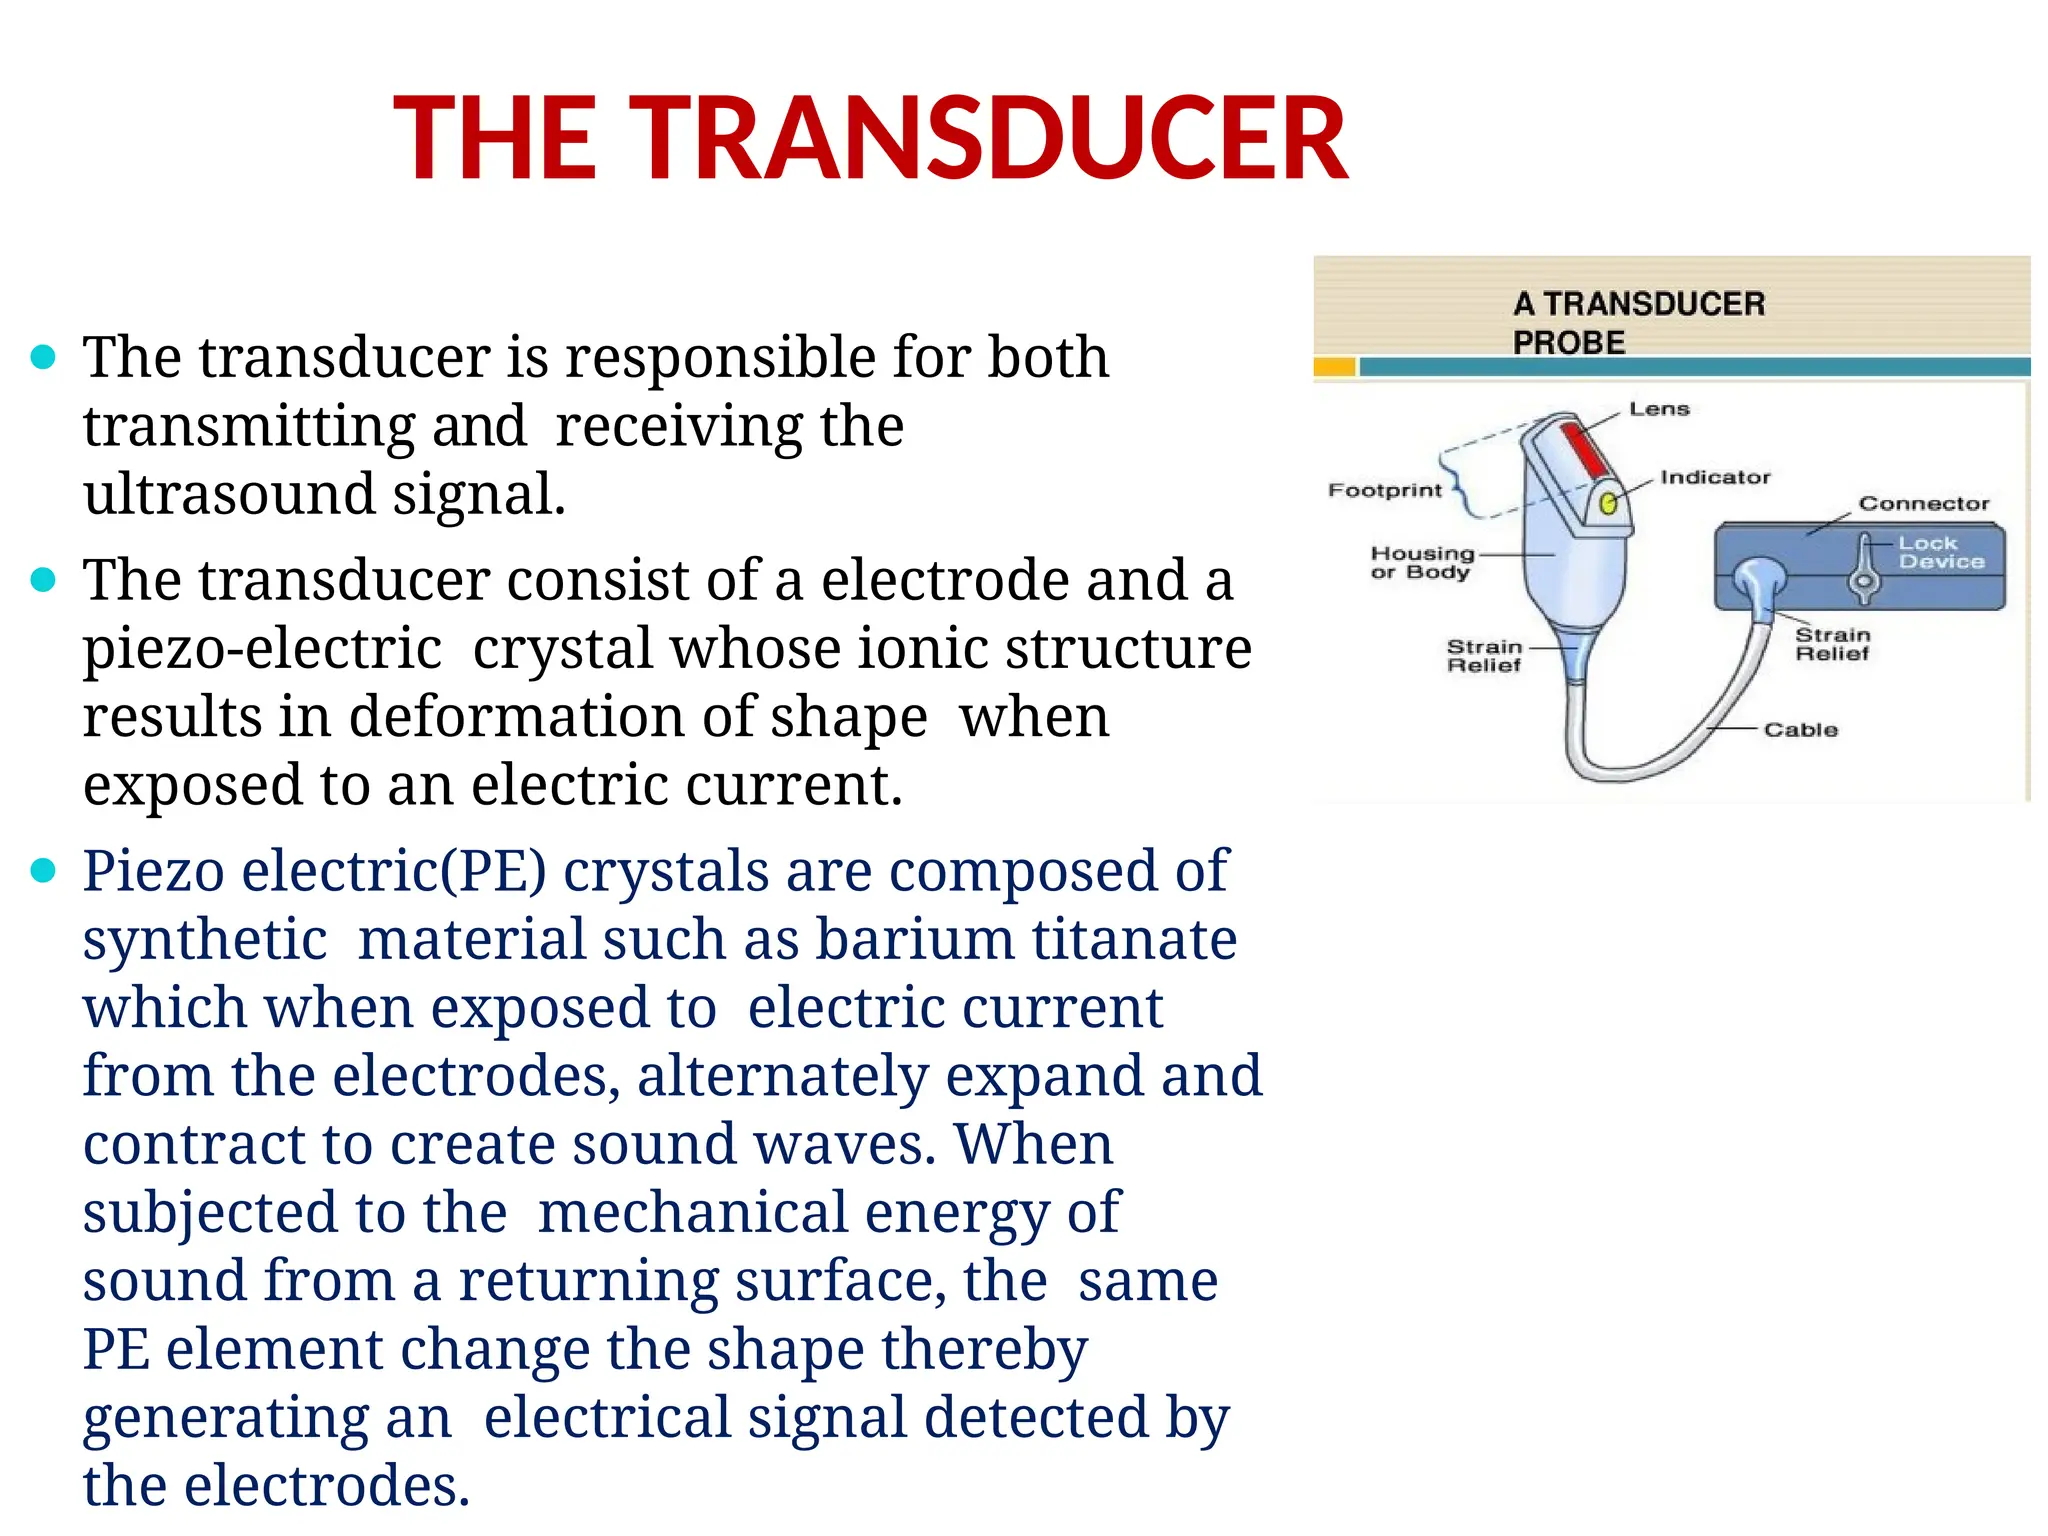
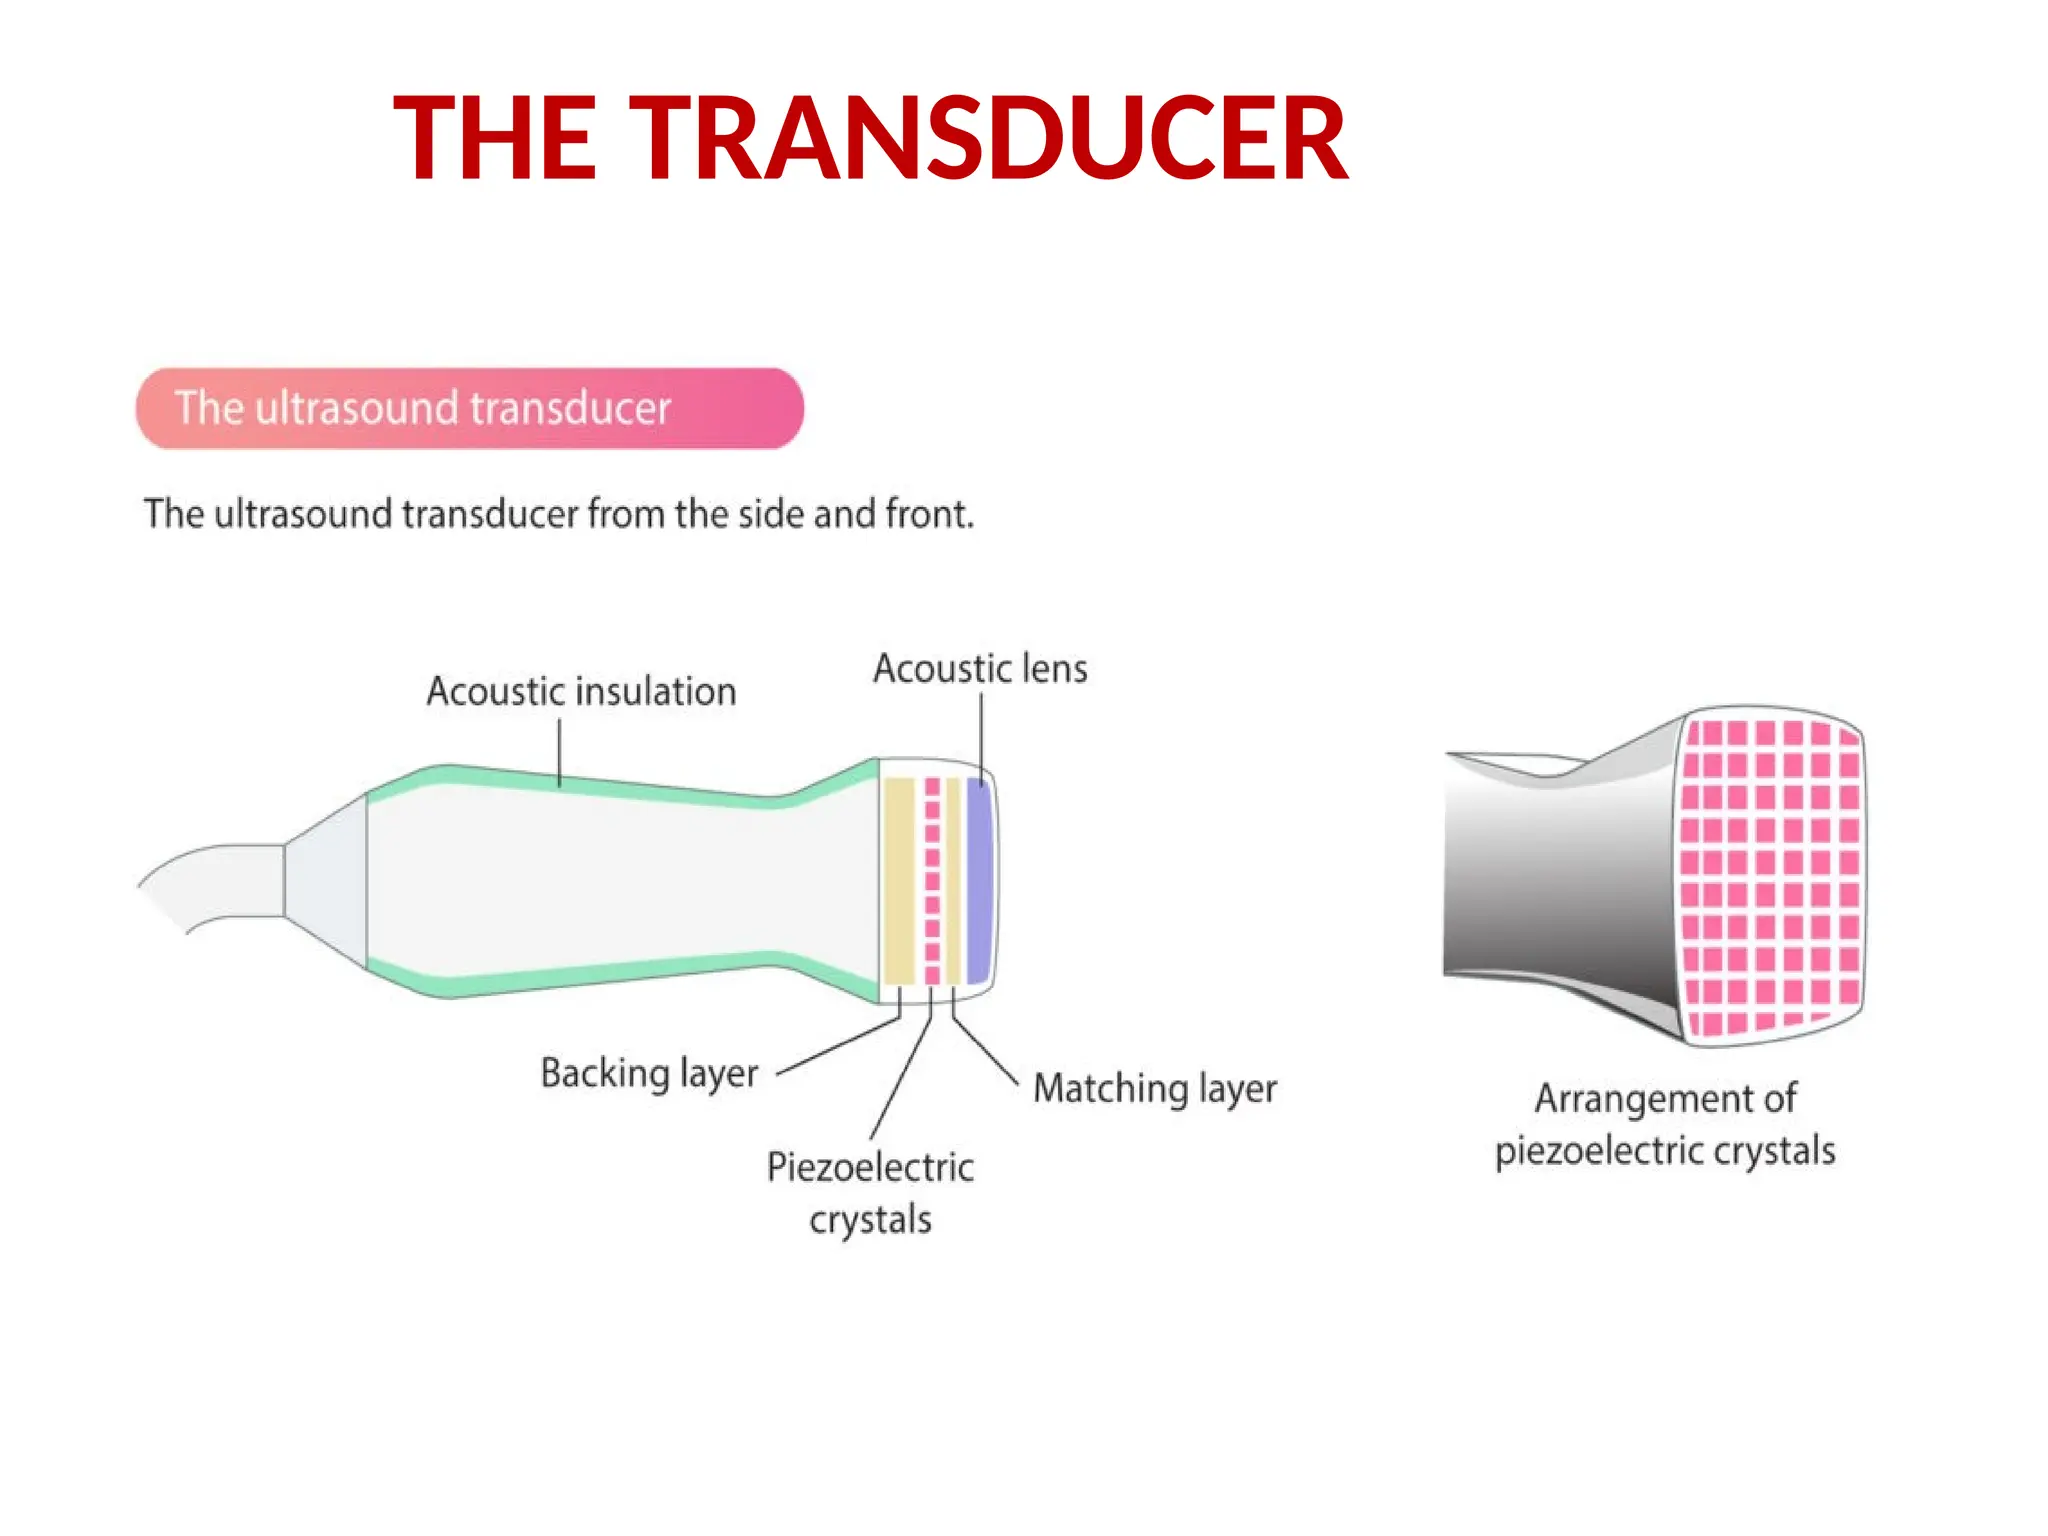
THE TRANSDUCER
⚫ Thetransducer is responsible for both
transmitting and receiving the
ultrasound signal.
⚫ The transducer consist of a electrode and a
piezo-electric crystal whose ionic structure
results in deformation of shape when
exposed to an electric current.
⚫ Piezo electric(PE) crystals are composed of
synthetic material such as barium titanate
which when exposed to electric current
from the electrodes, alternately expand and
contract to create sound waves. When
subjected to the mechanical energy of
sound from a returning surface, the same
PE element change the shape thereby
generating an electrical signal detected by
the electrodes.
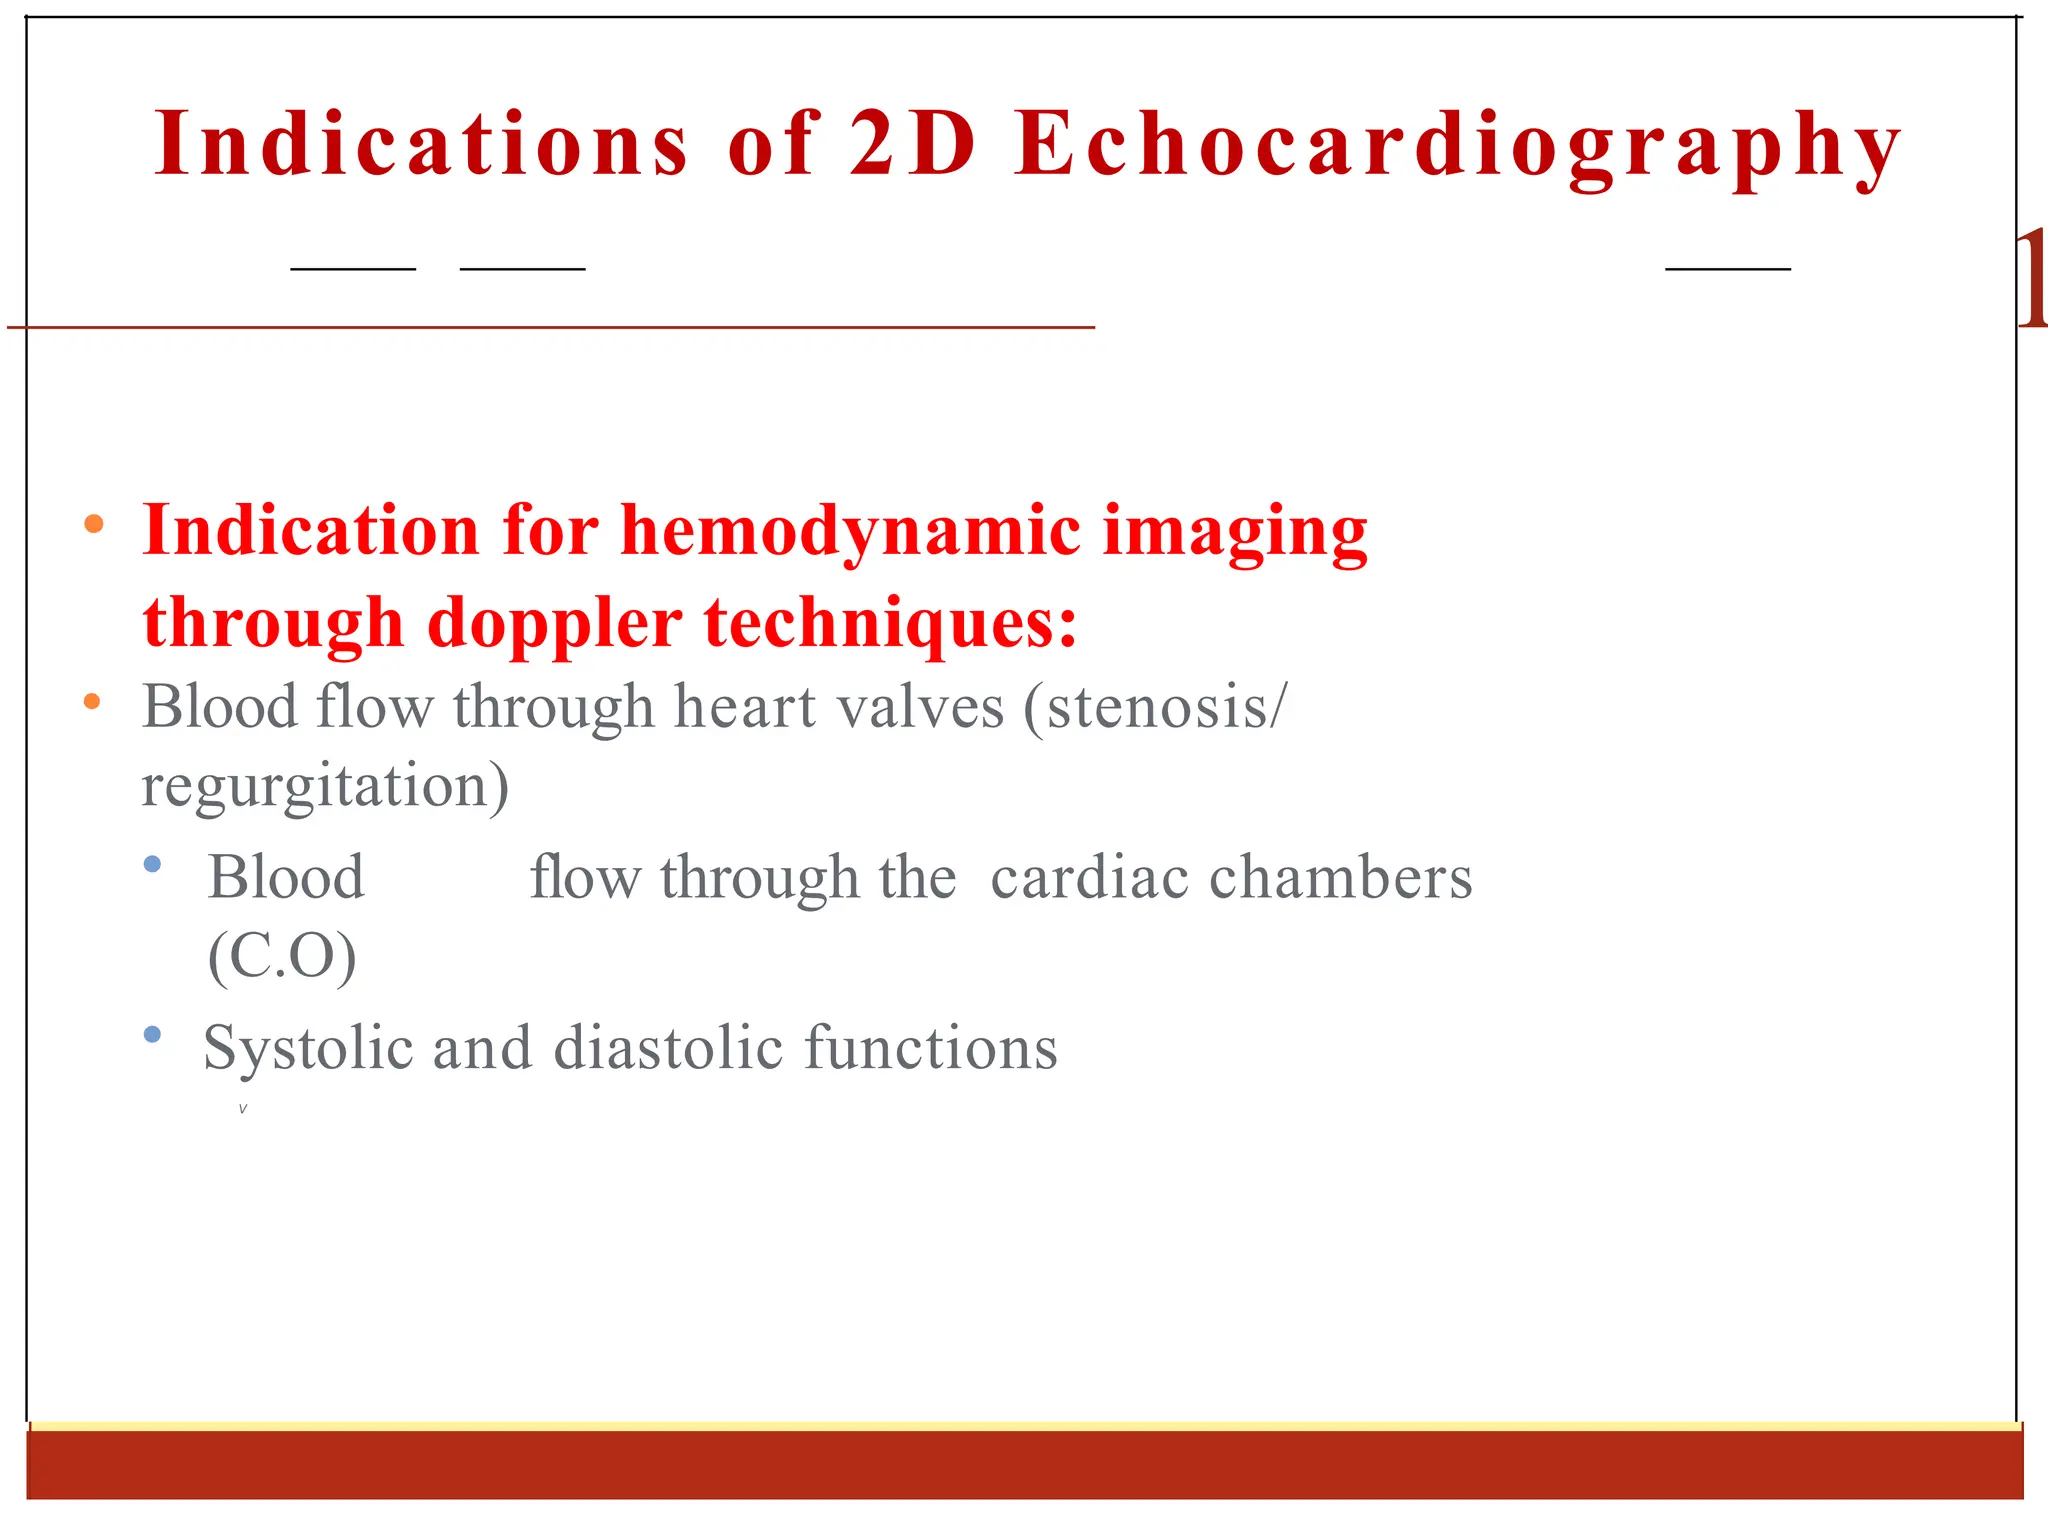
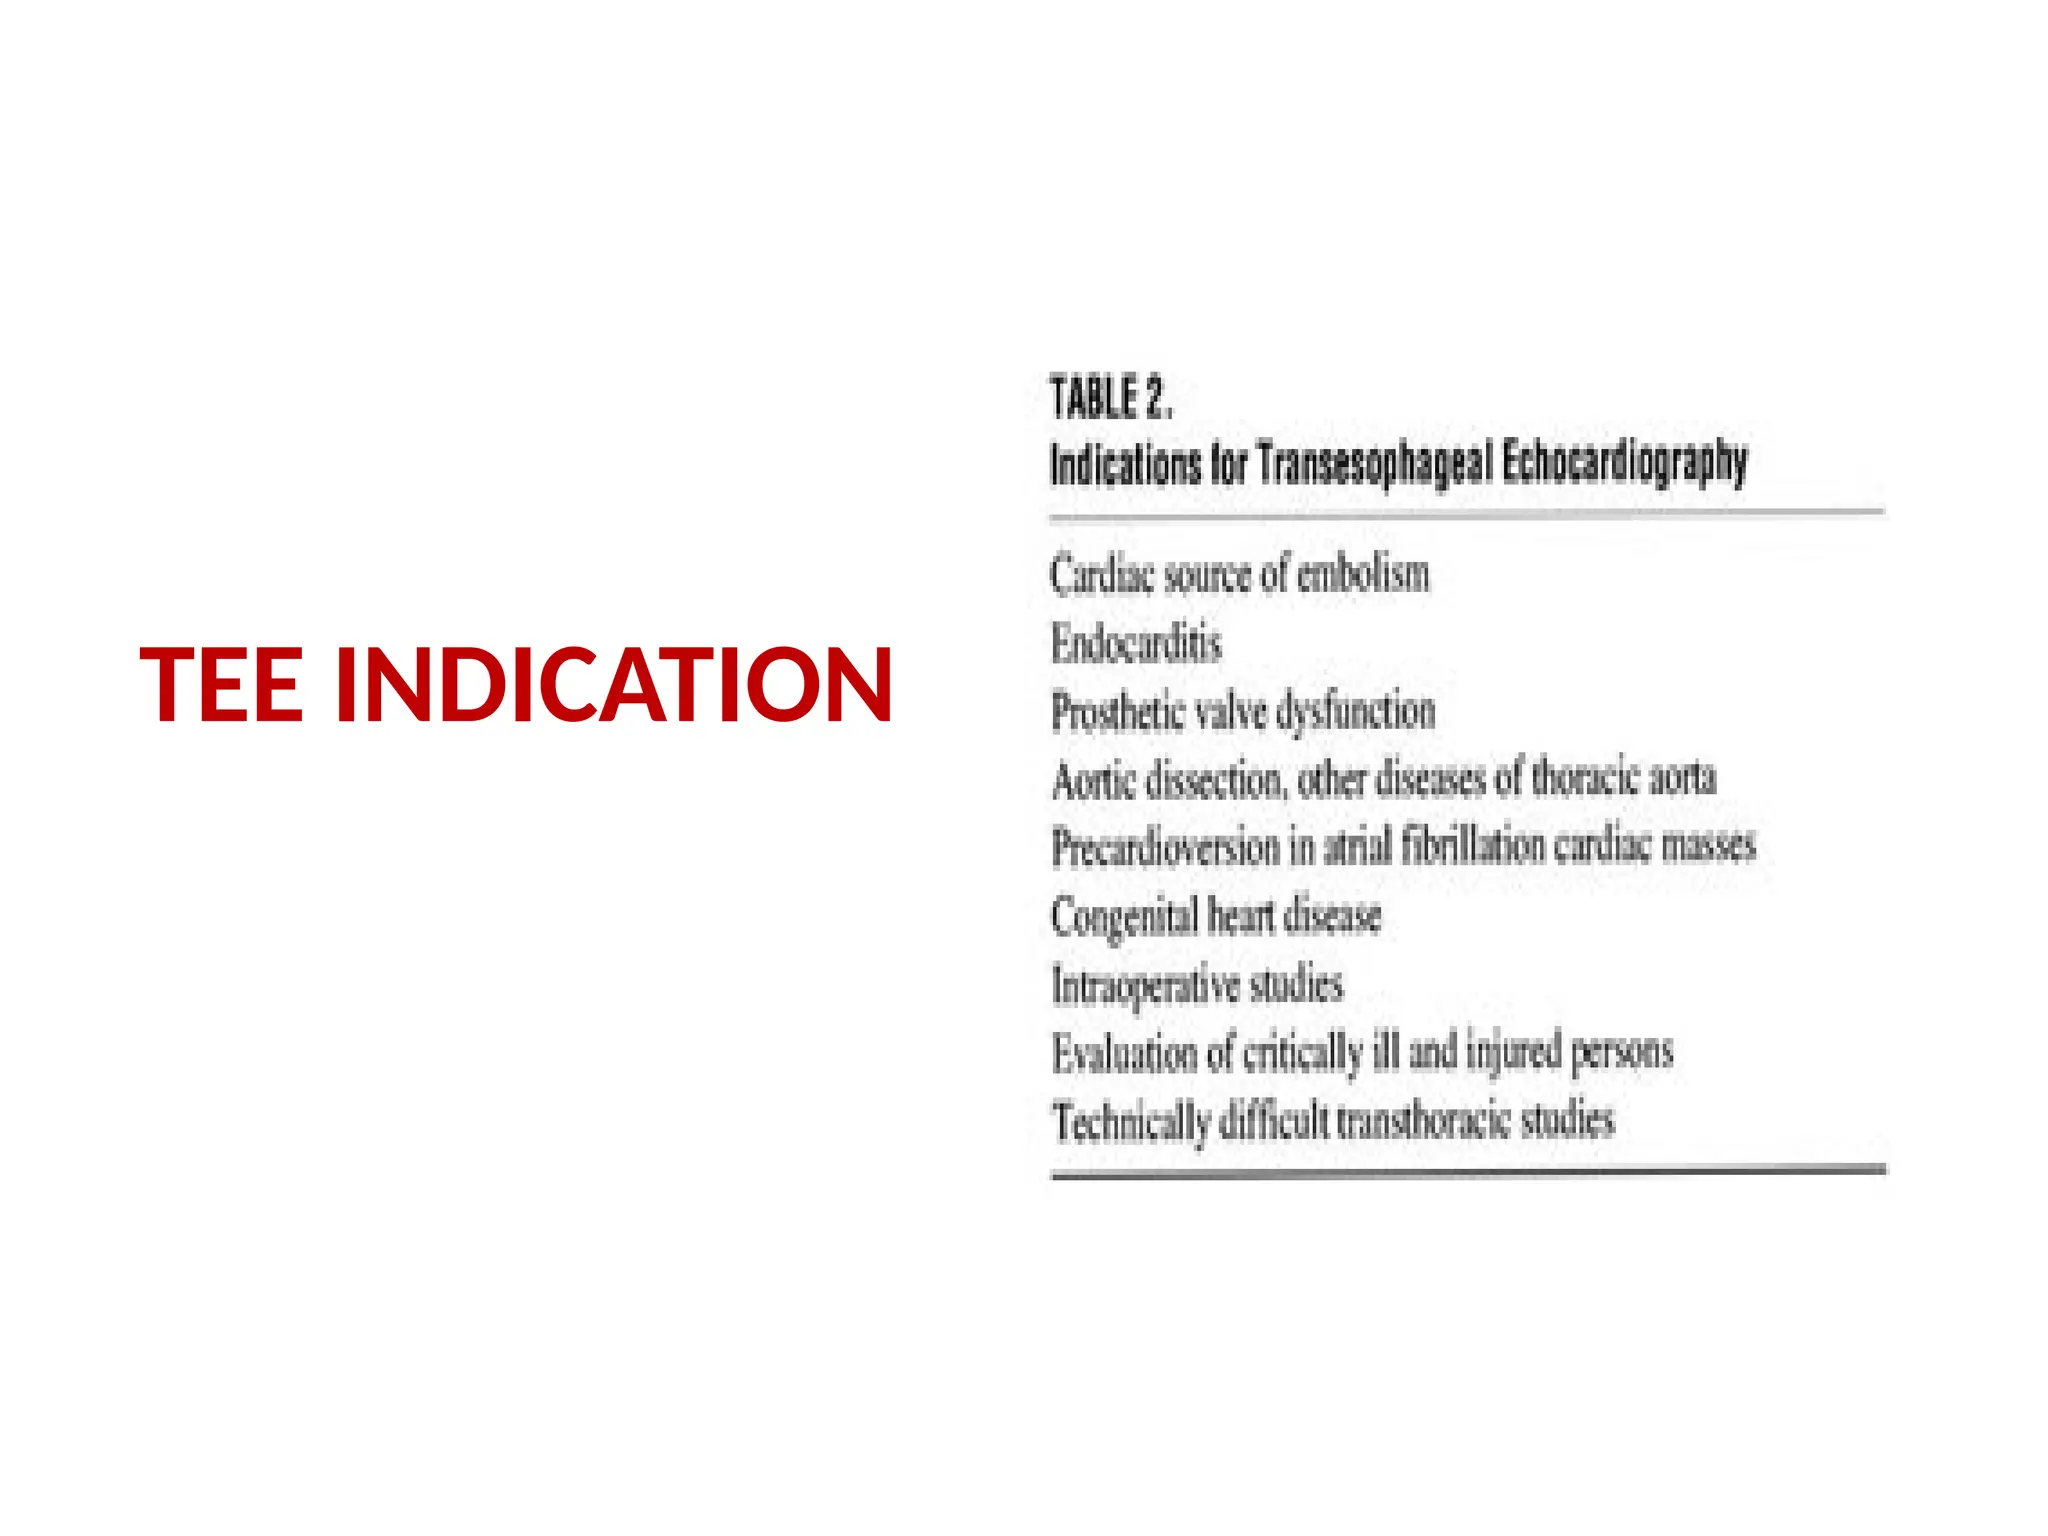
Indications of 2DEchocardiography
1
• Indication for hemodynamic imaging
through doppler techniques:
• Blood flow through heart valves (stenosis/
regurgitation)
• Blood flow through the cardiac chambers
(C.O)
• Systolic and diastolic functions
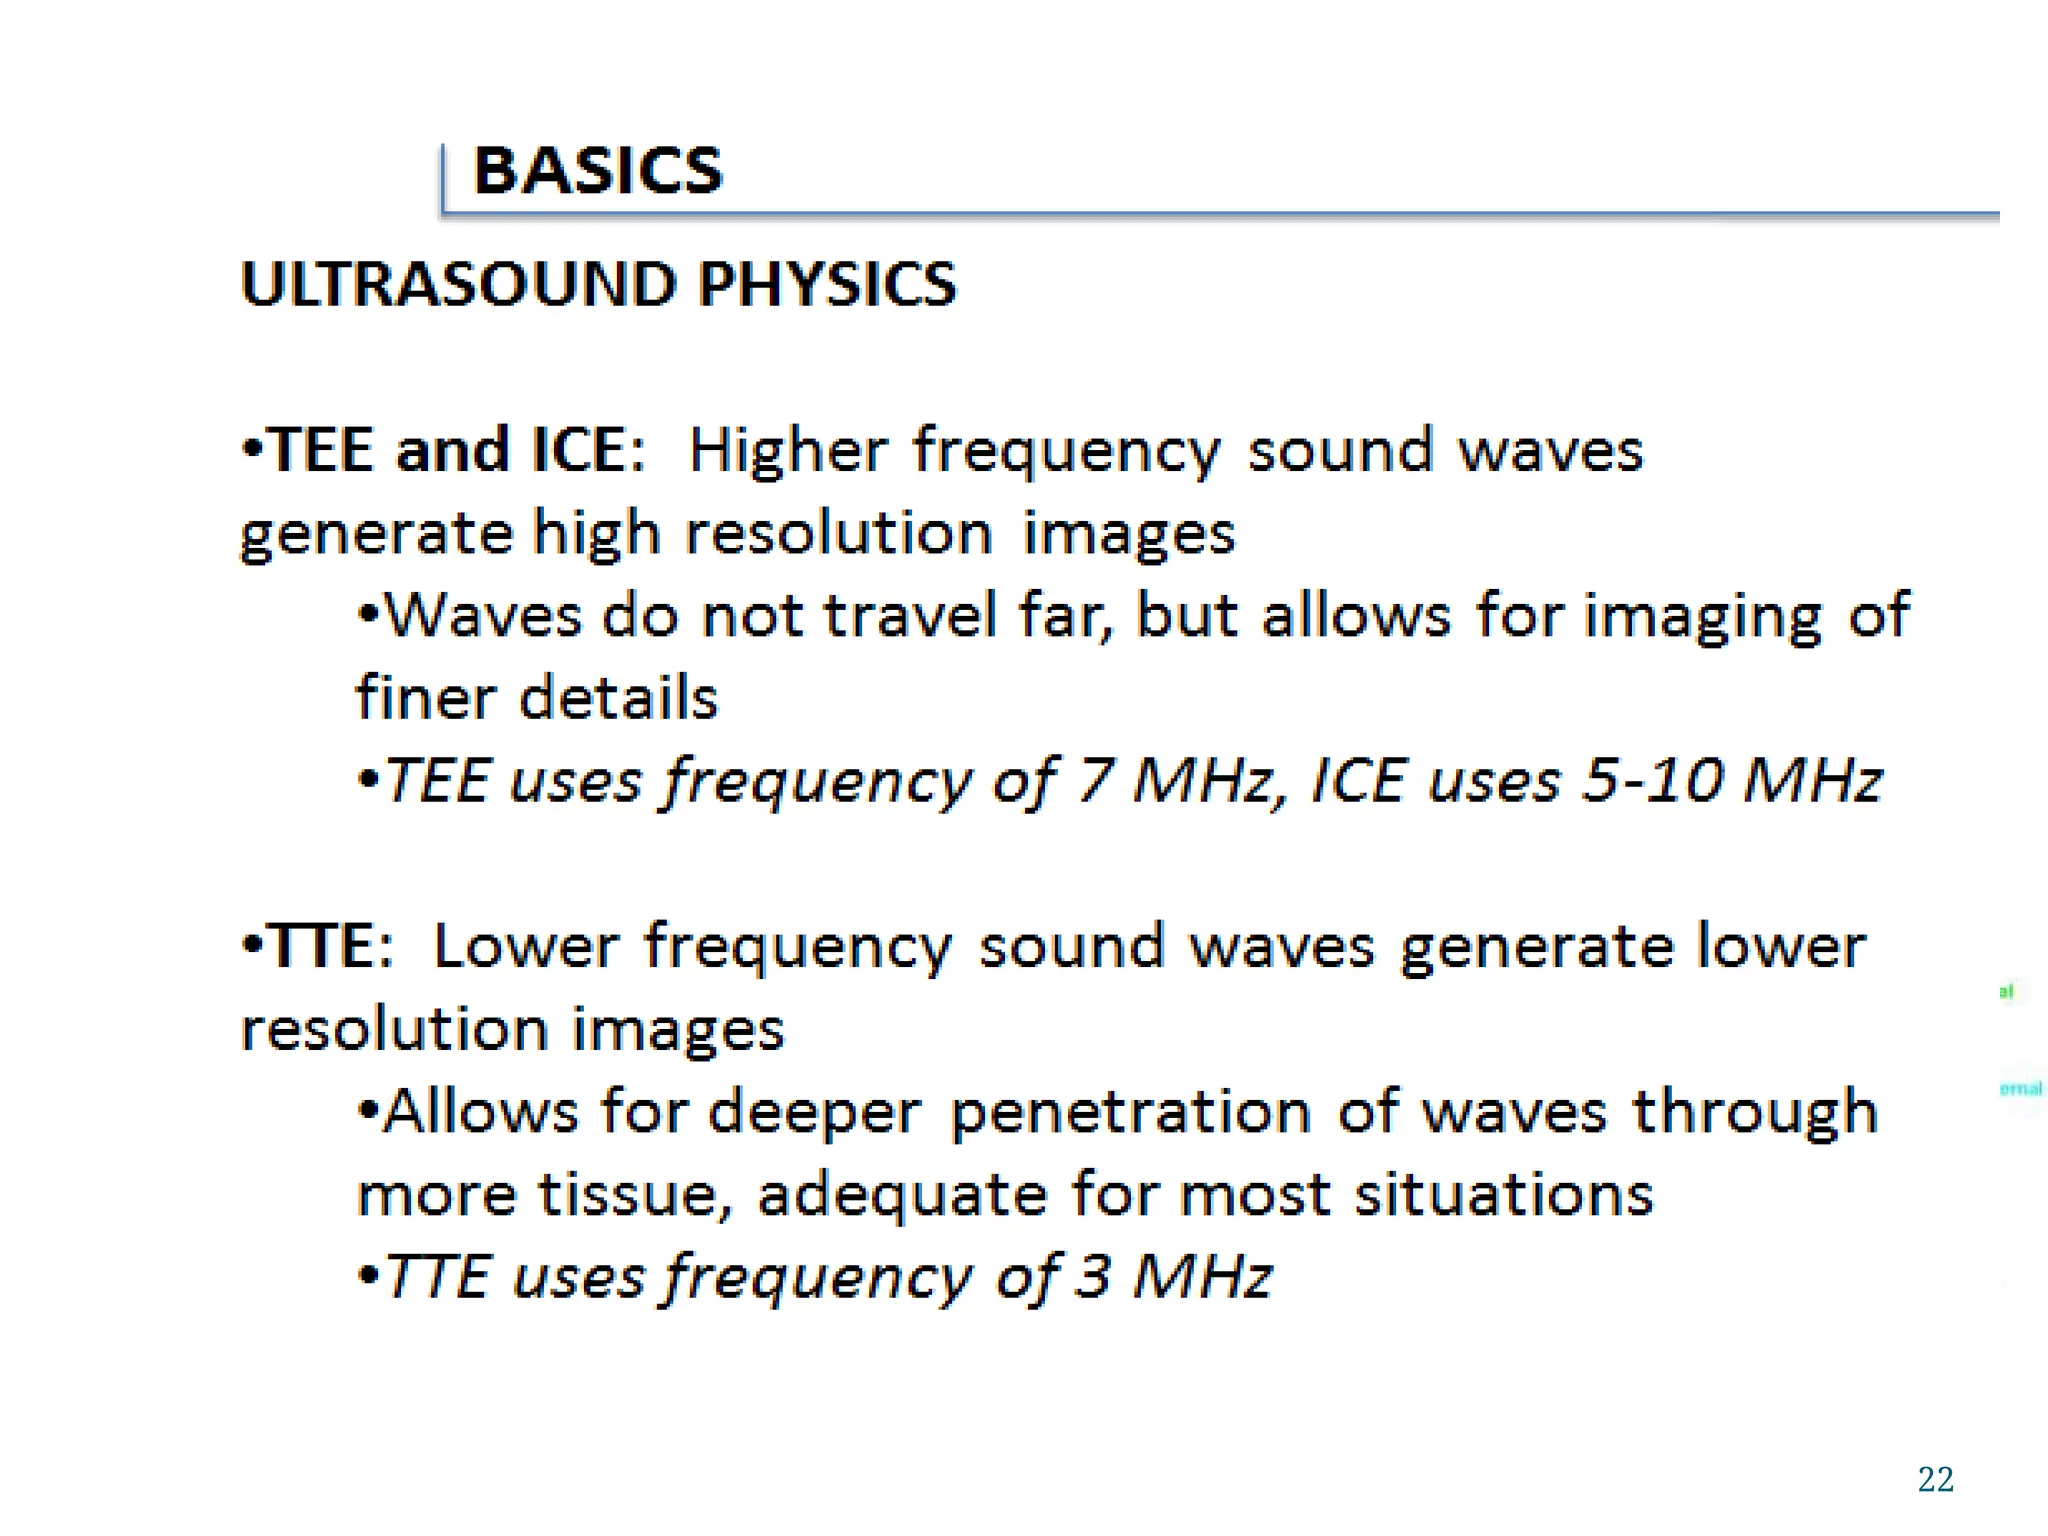
V
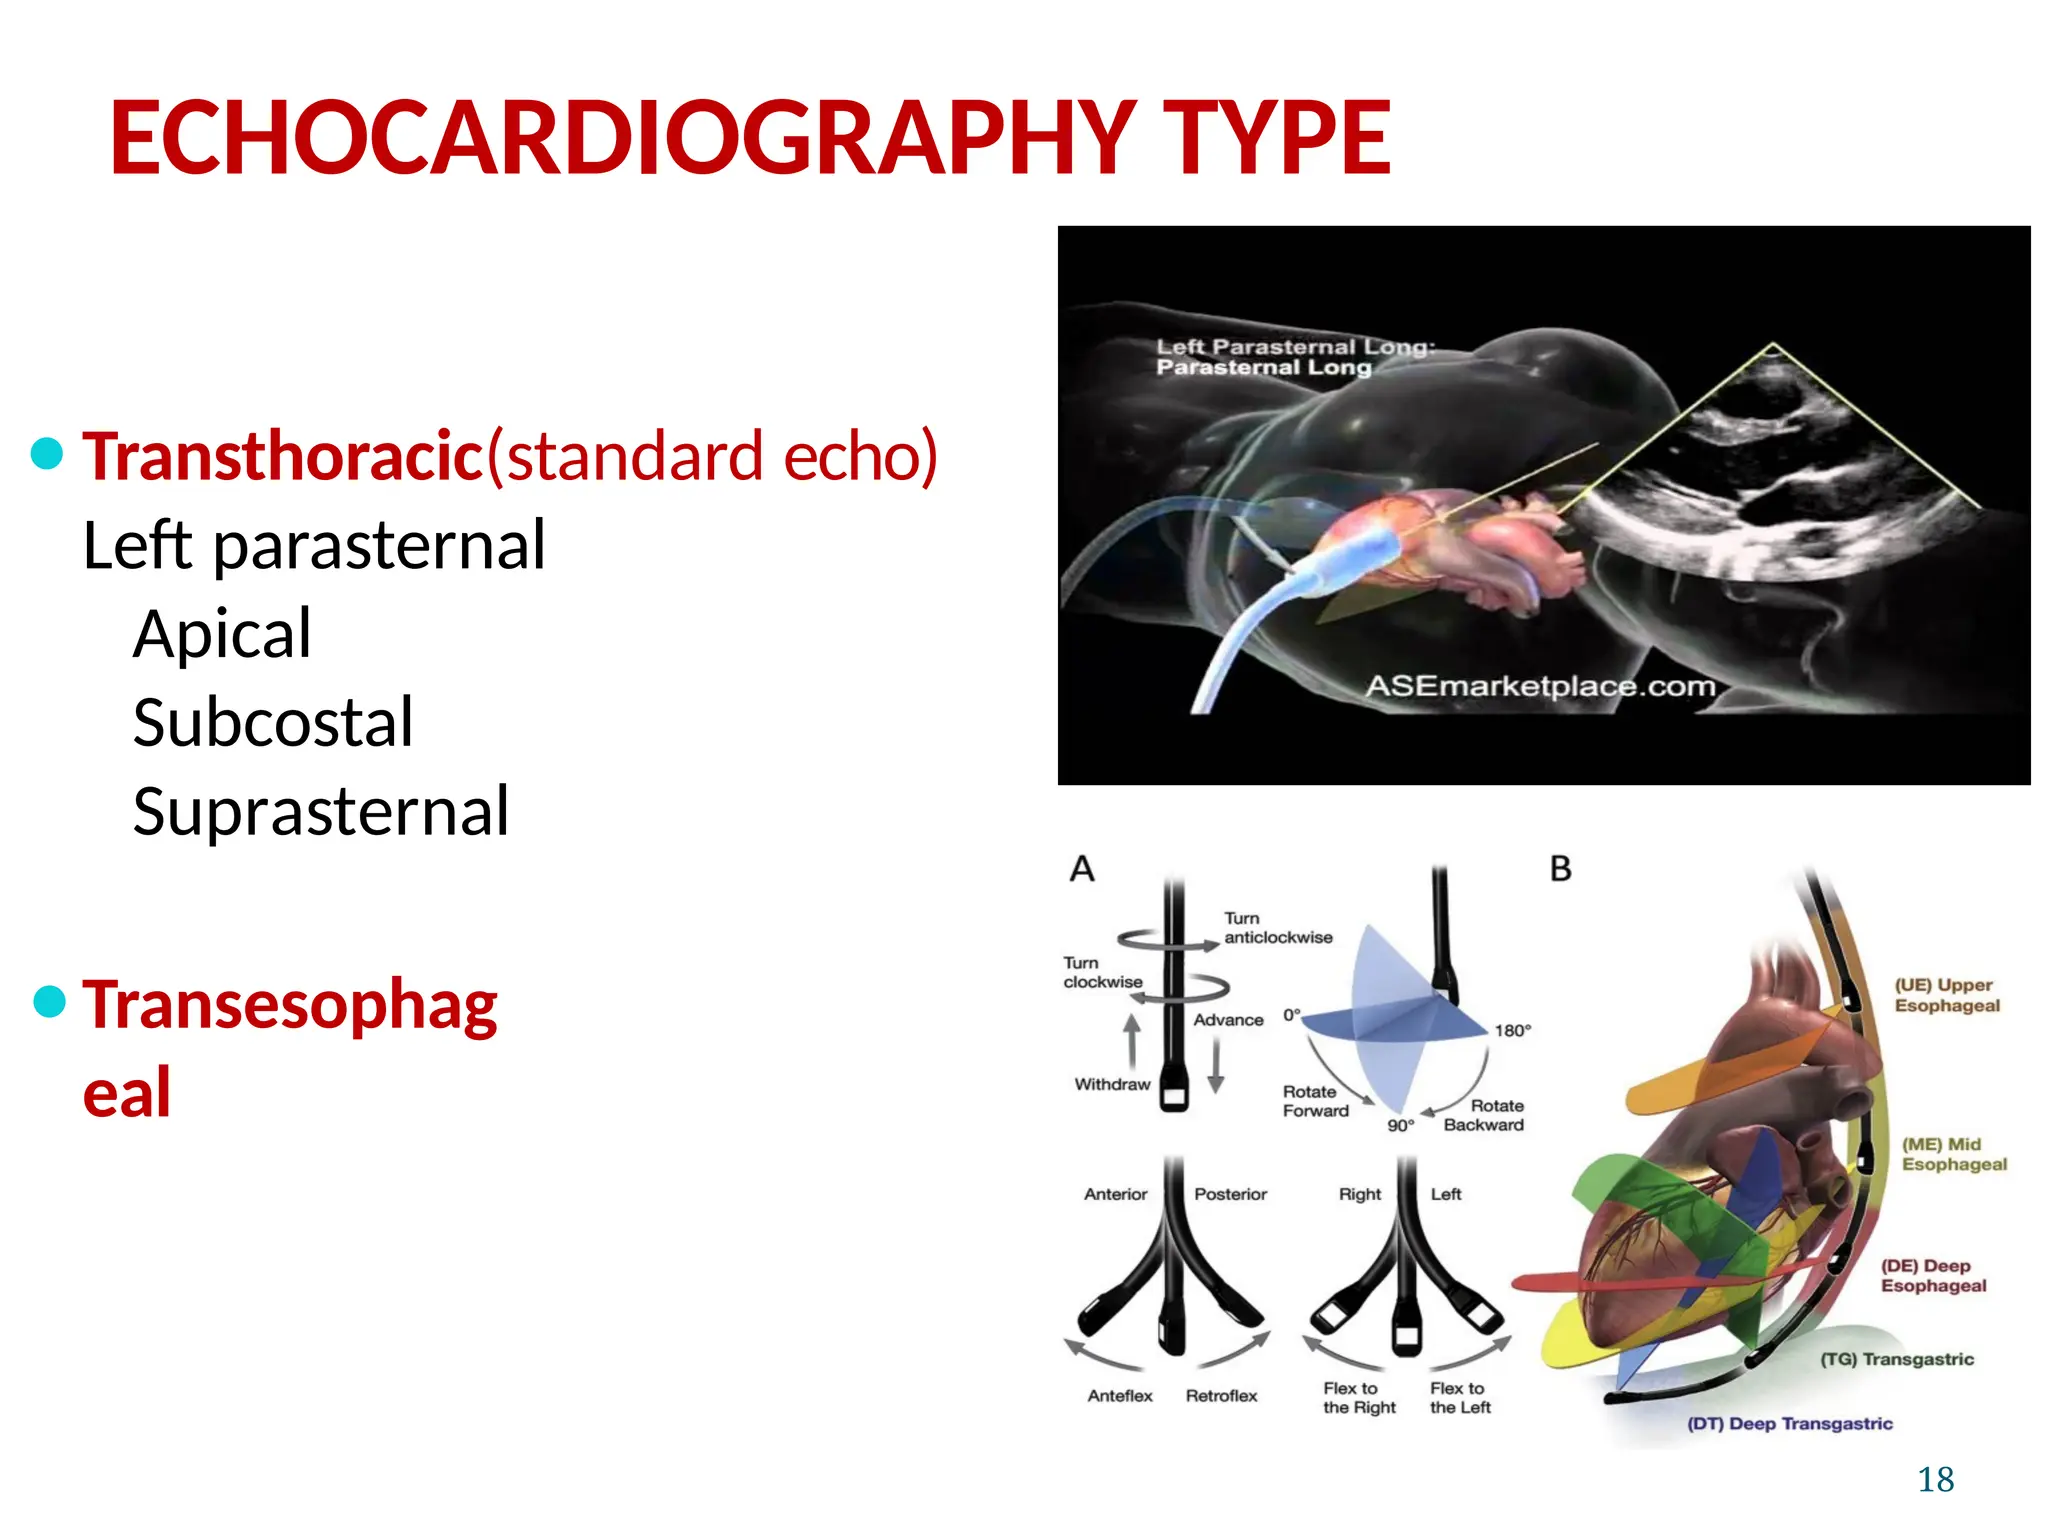
Transthoracic Echo
A standardechocardiogram is also known
as a
transthoracic echocardiogram (TTE), or cardiac
ultrasound.
The subject is asked to lie in the semi recumbent
position on his or her left side with the head
elevated.
The left arm is tucked under the head and the
right arm
lies along the right side of the body
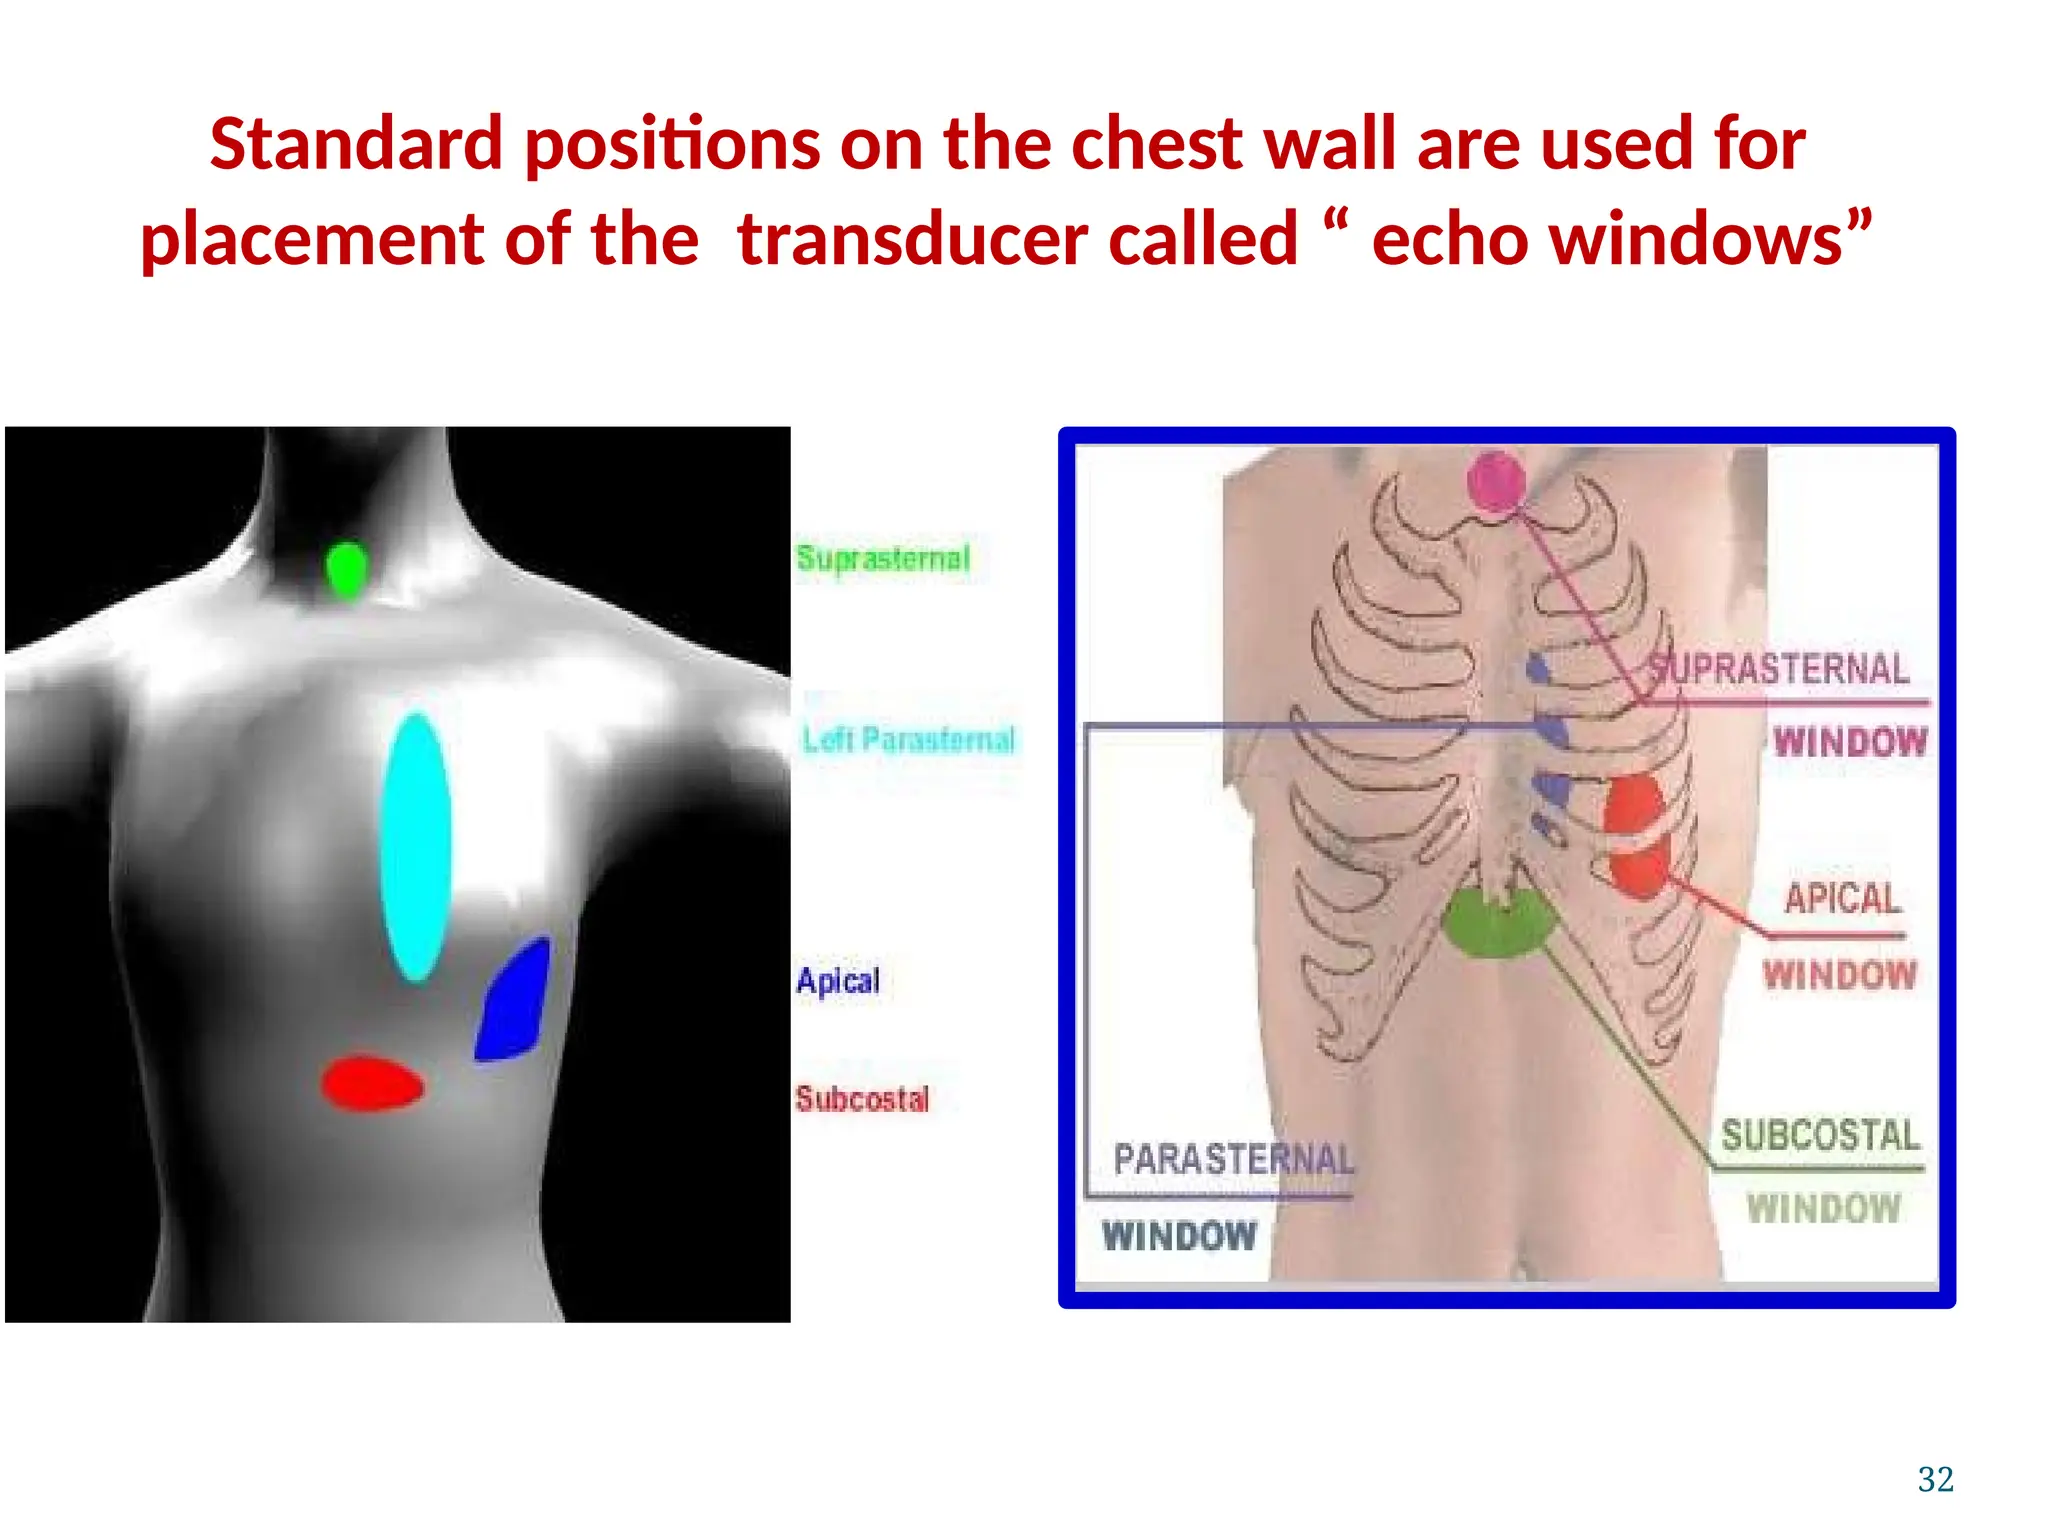
Standard positions on the chest wall are used for
placement of the transducer called “echo windows”
22
23.
The Modalities ofEcho
The following modalities of echo are used clinically:
1. Conventional echo
Two-Dimensional echo (2-D echo)
Motion- mode echo (M-mode echo)
2. Doppler Echo
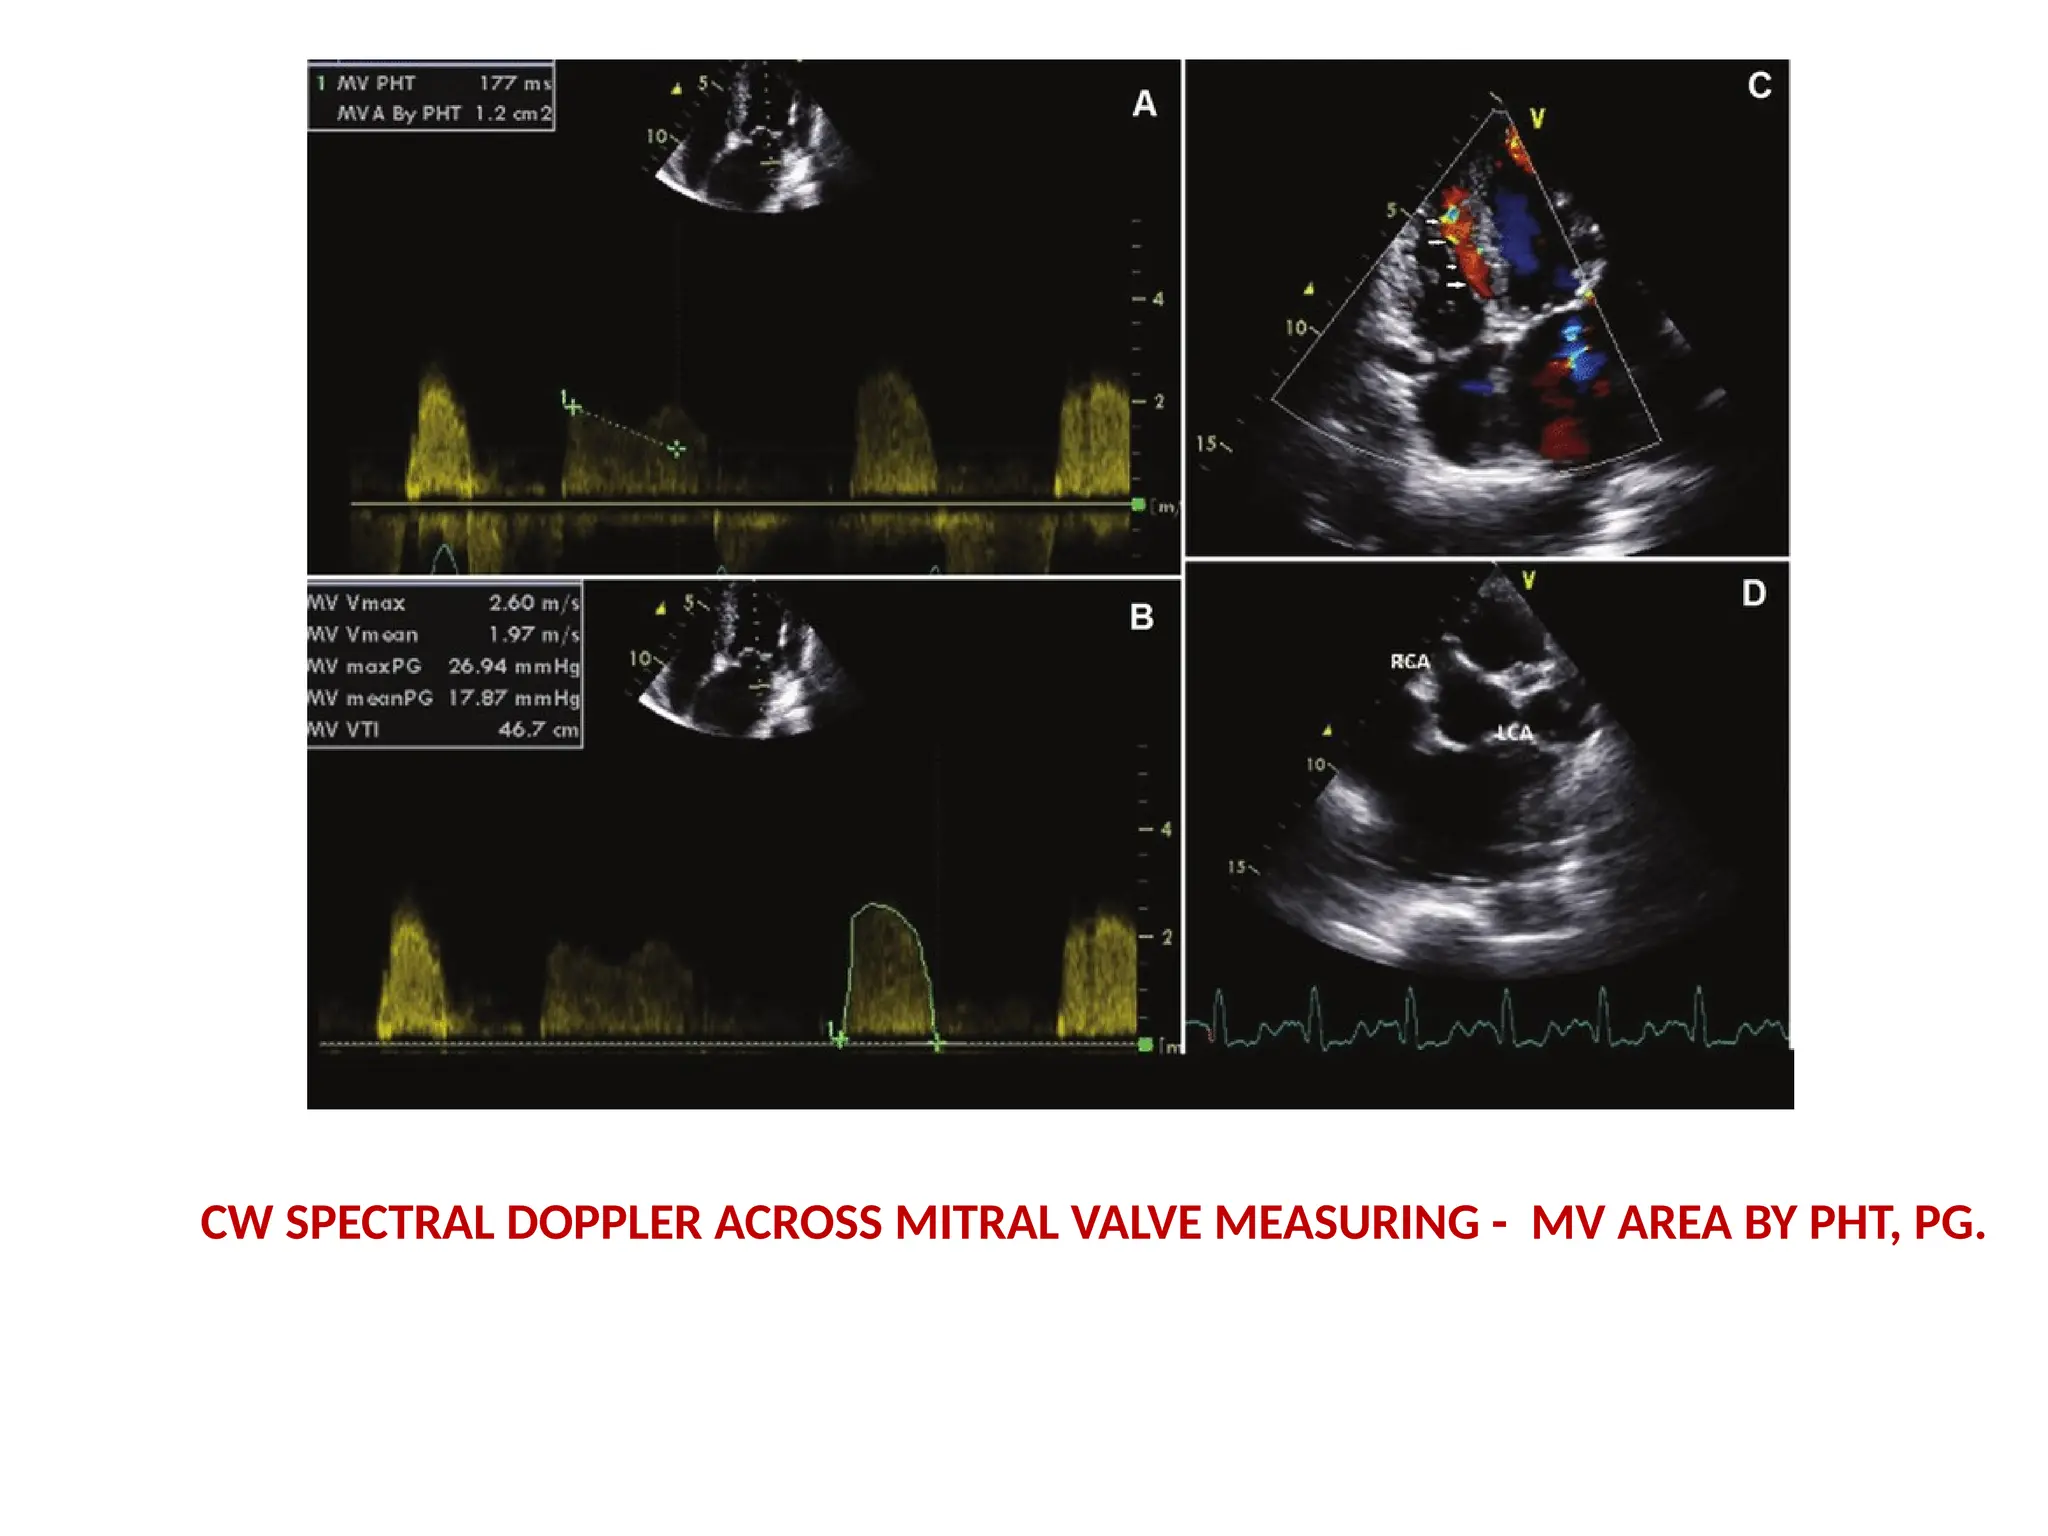
Continuous wave (CW) Doppler
Pulse wave (PW) Doppler
Colour flow(CF) Doppler
All modalities follow the same principle of
ultrasound
Differ in how reflected sound waves are
collected 23
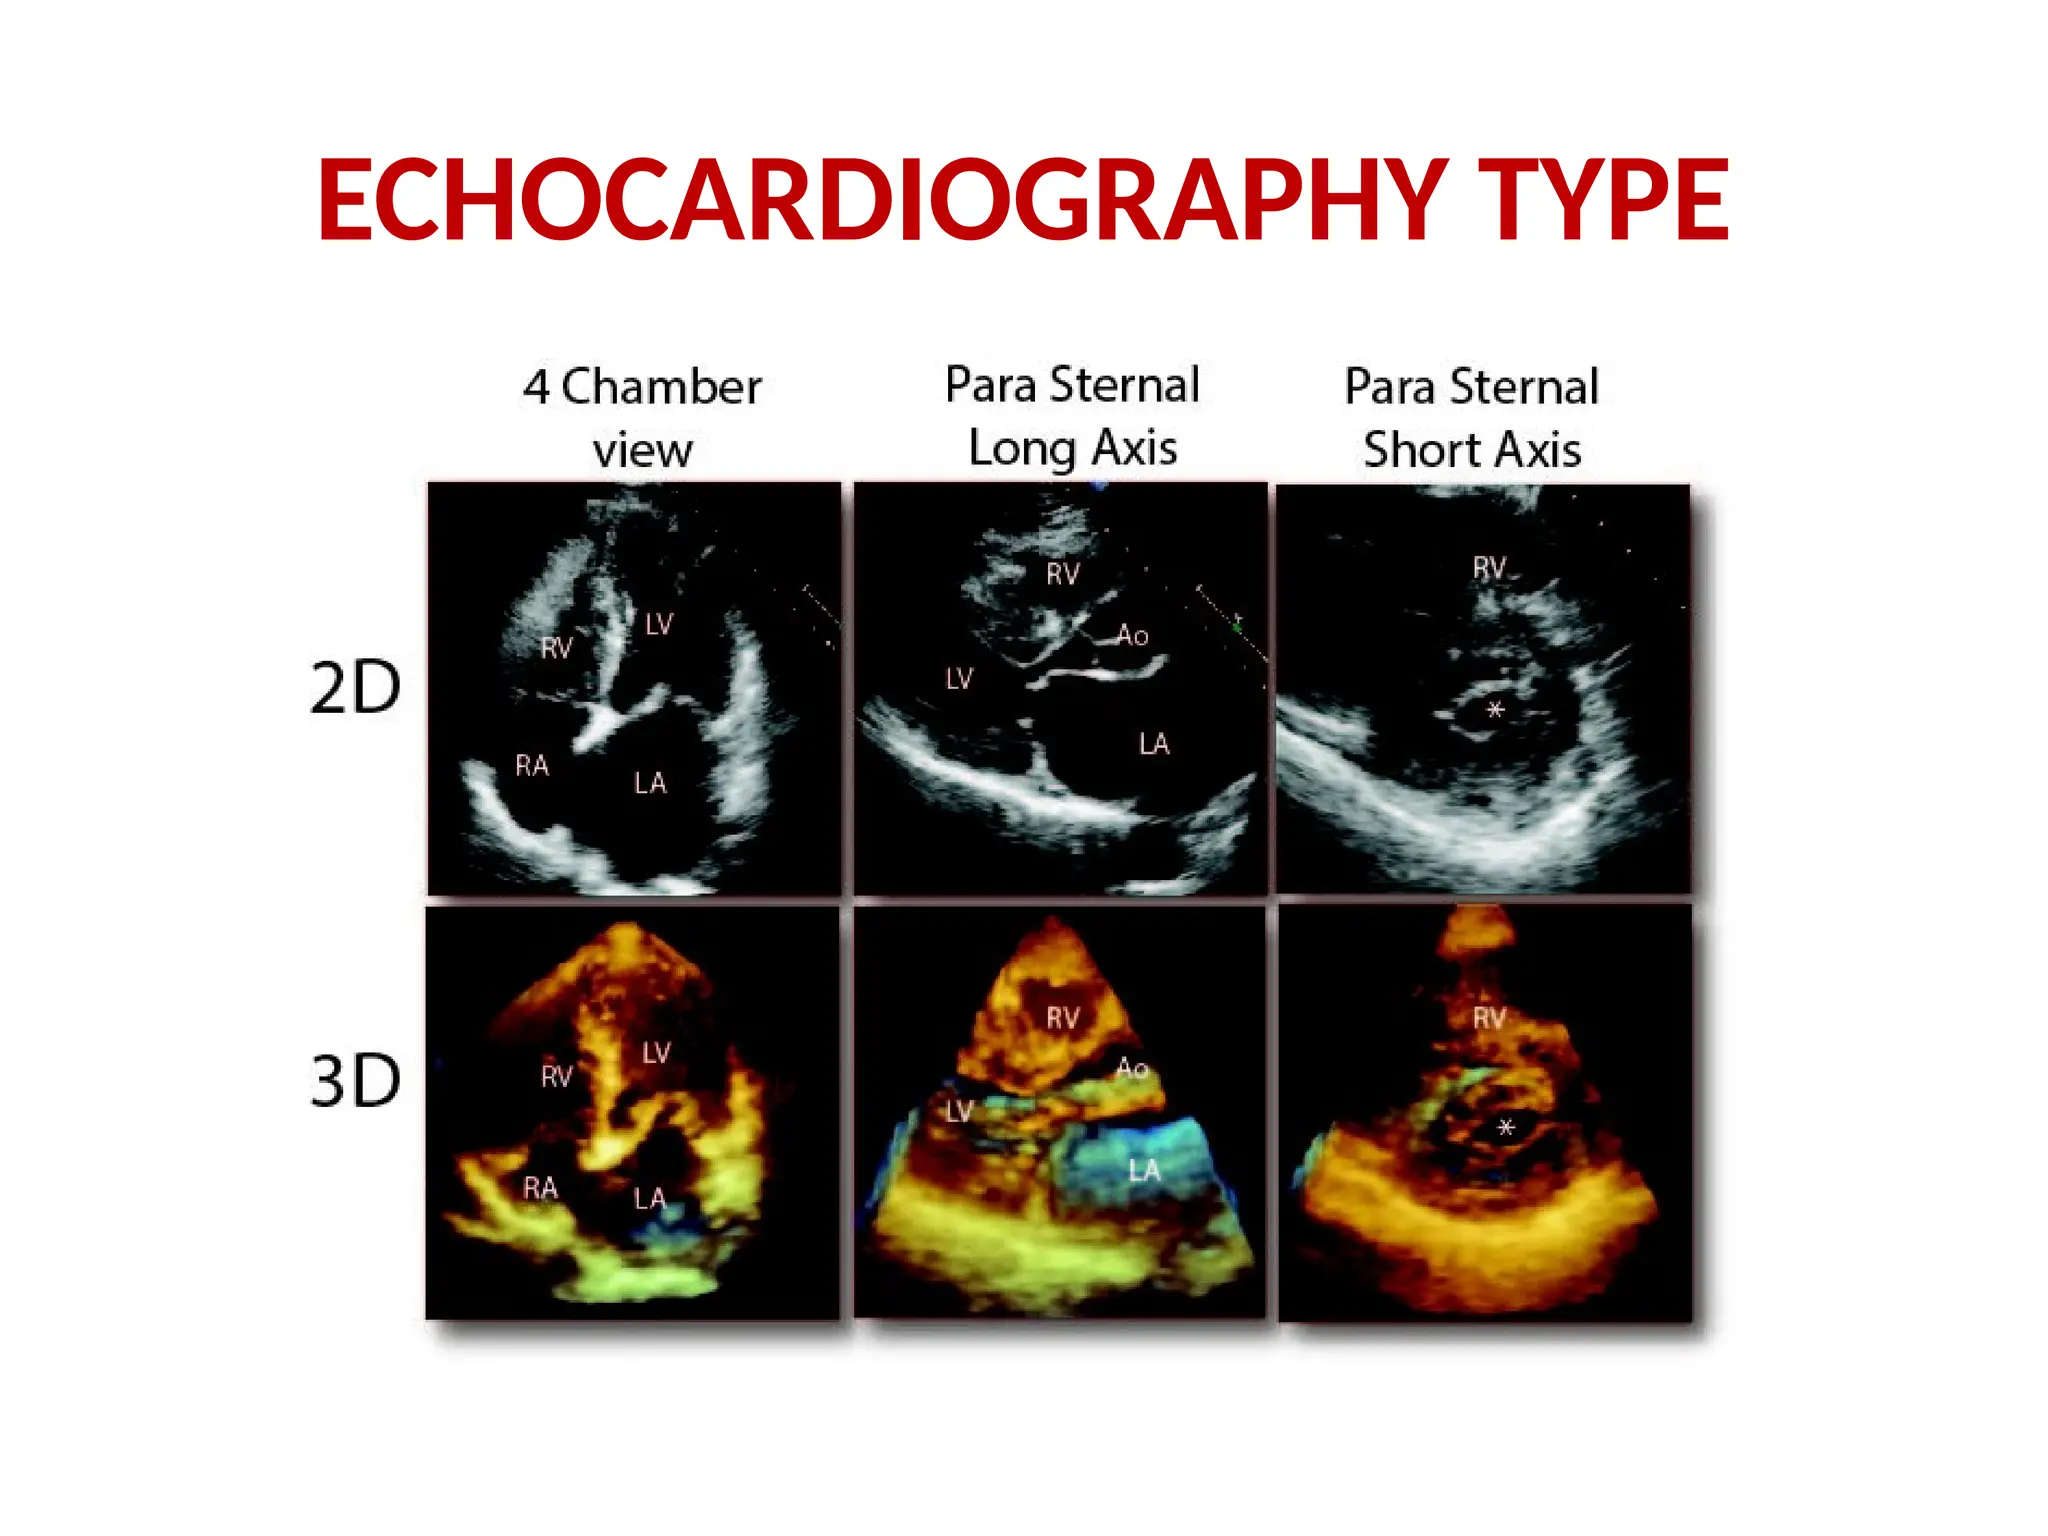
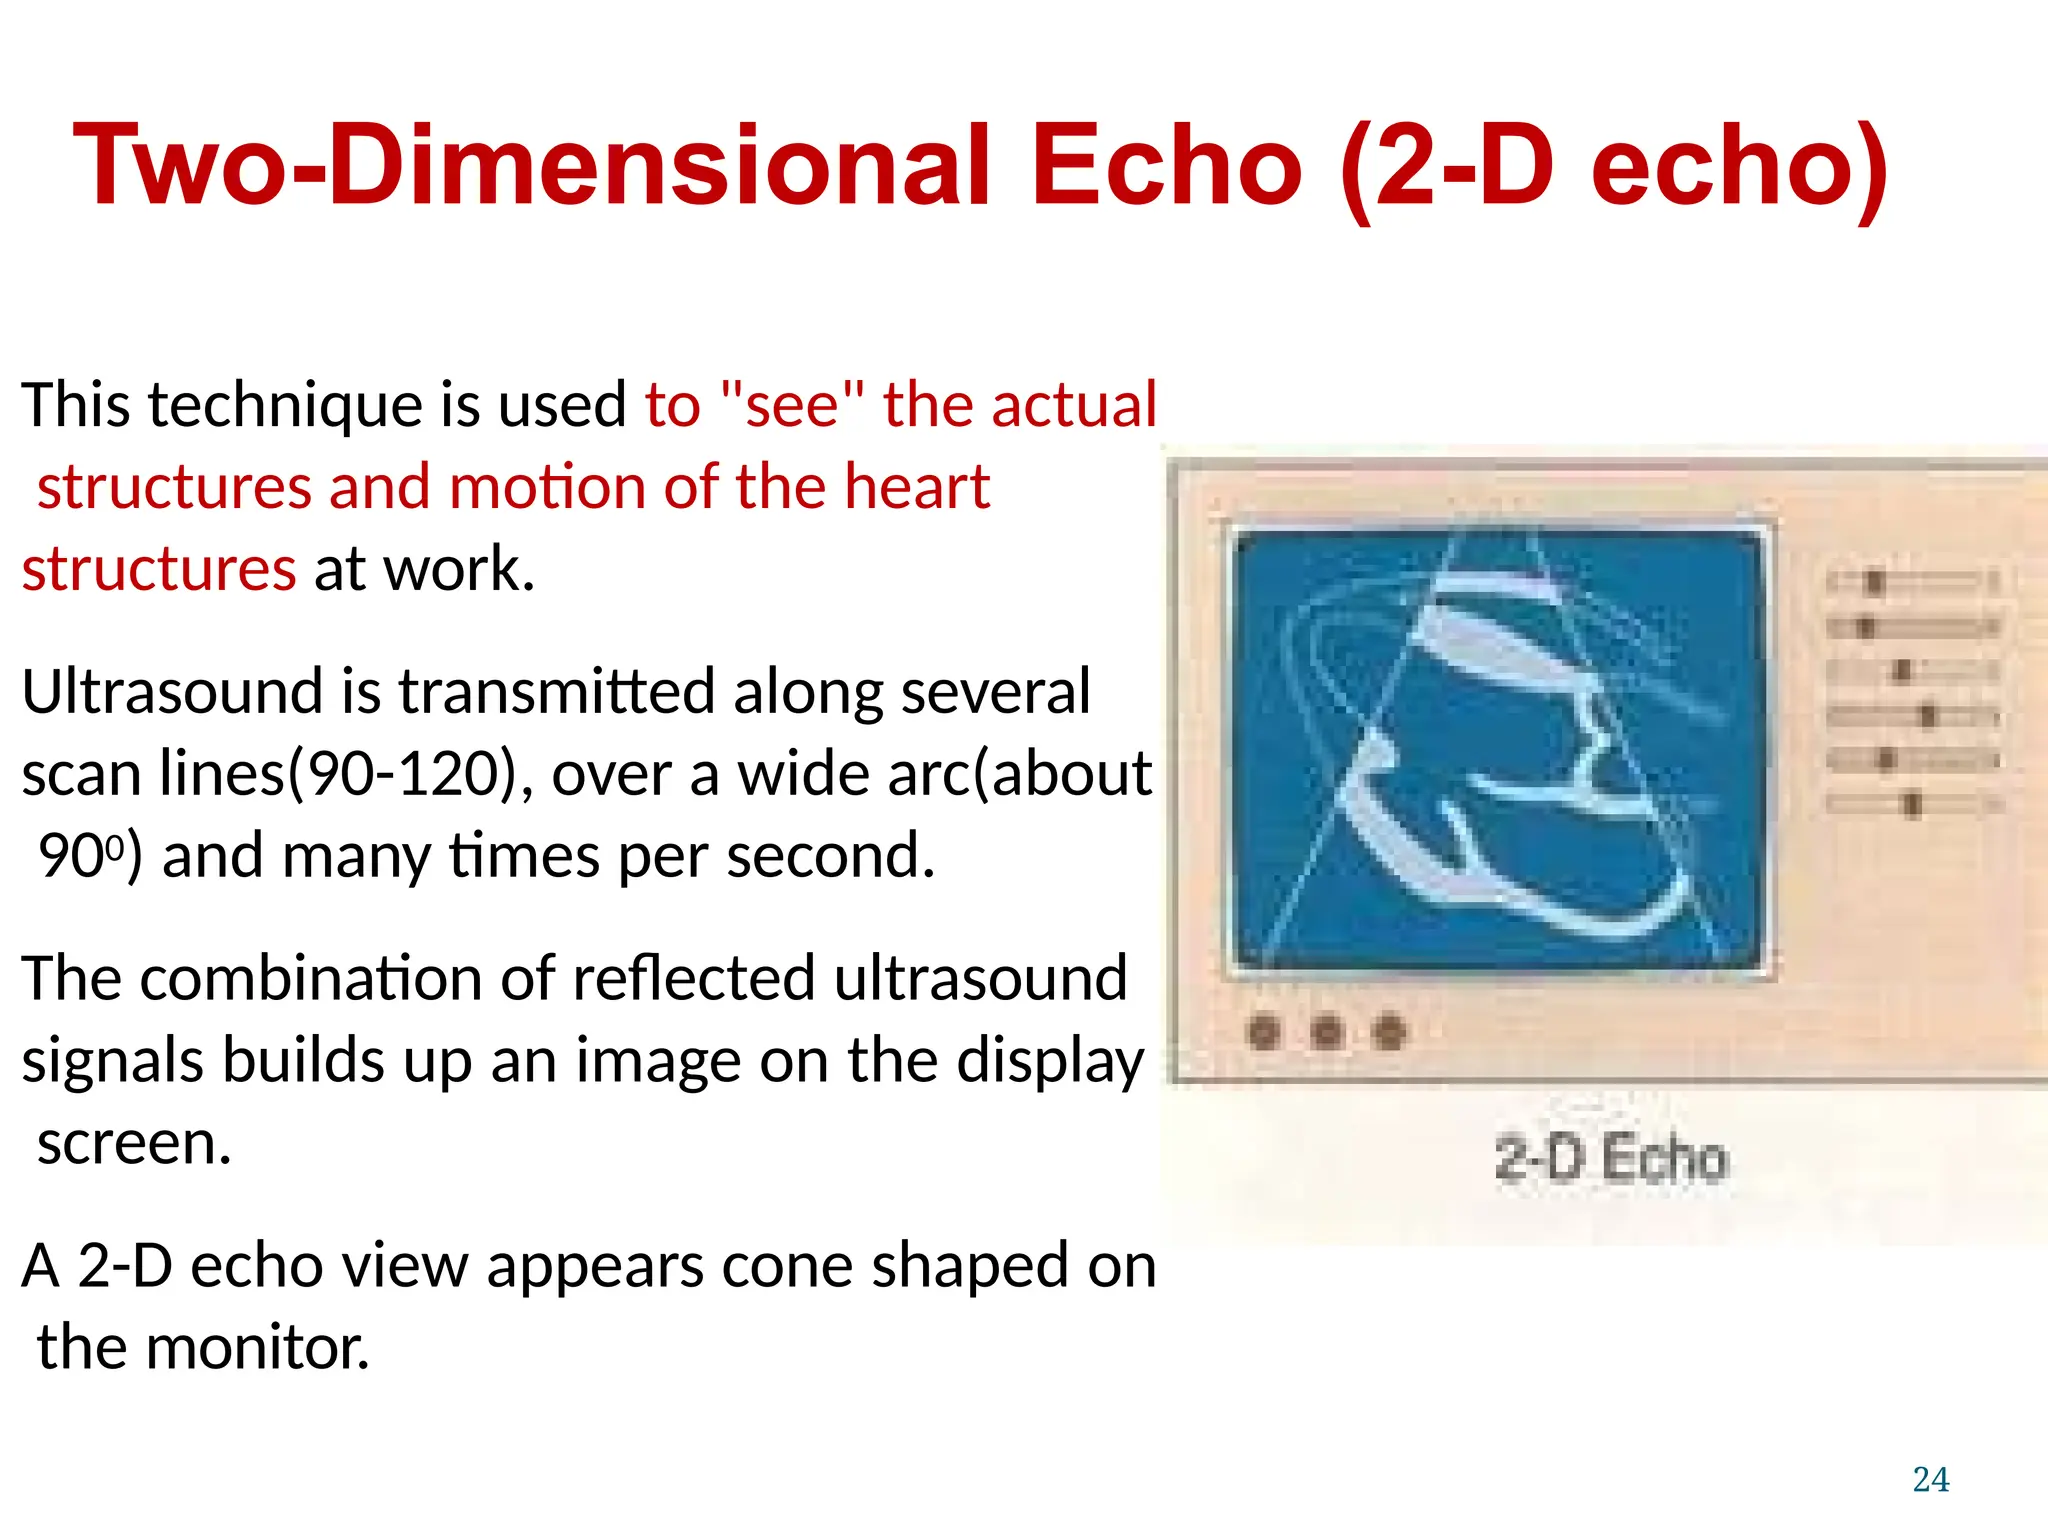
24.
Two-Dimensional Echo (2-Decho)
This technique is used to "see" the actual
structures and motion of the heart
structures at work.
Ultrasound is transmitted along several
scan lines(90-120), over a wide arc(about
900) and many times per second.
The combination of reflected ultrasound
signals builds up an image on the display
screen.
A 2-D echo view appears cone shaped on
the monitor.
24
25.
M-Mode echocardiography
An M-mode echocardiogram is not a
"picture" of the heart, but rather a
diagram that shows how the positions
of its structures change during the
course of the cardiac cycle.
M-mode recordings permit
measurement of cardiac dimensions
and motion patterns.
Also facilitate analysis of time
relationships with other physiological
variables such as ECG, and heart
sounds.
25
26.
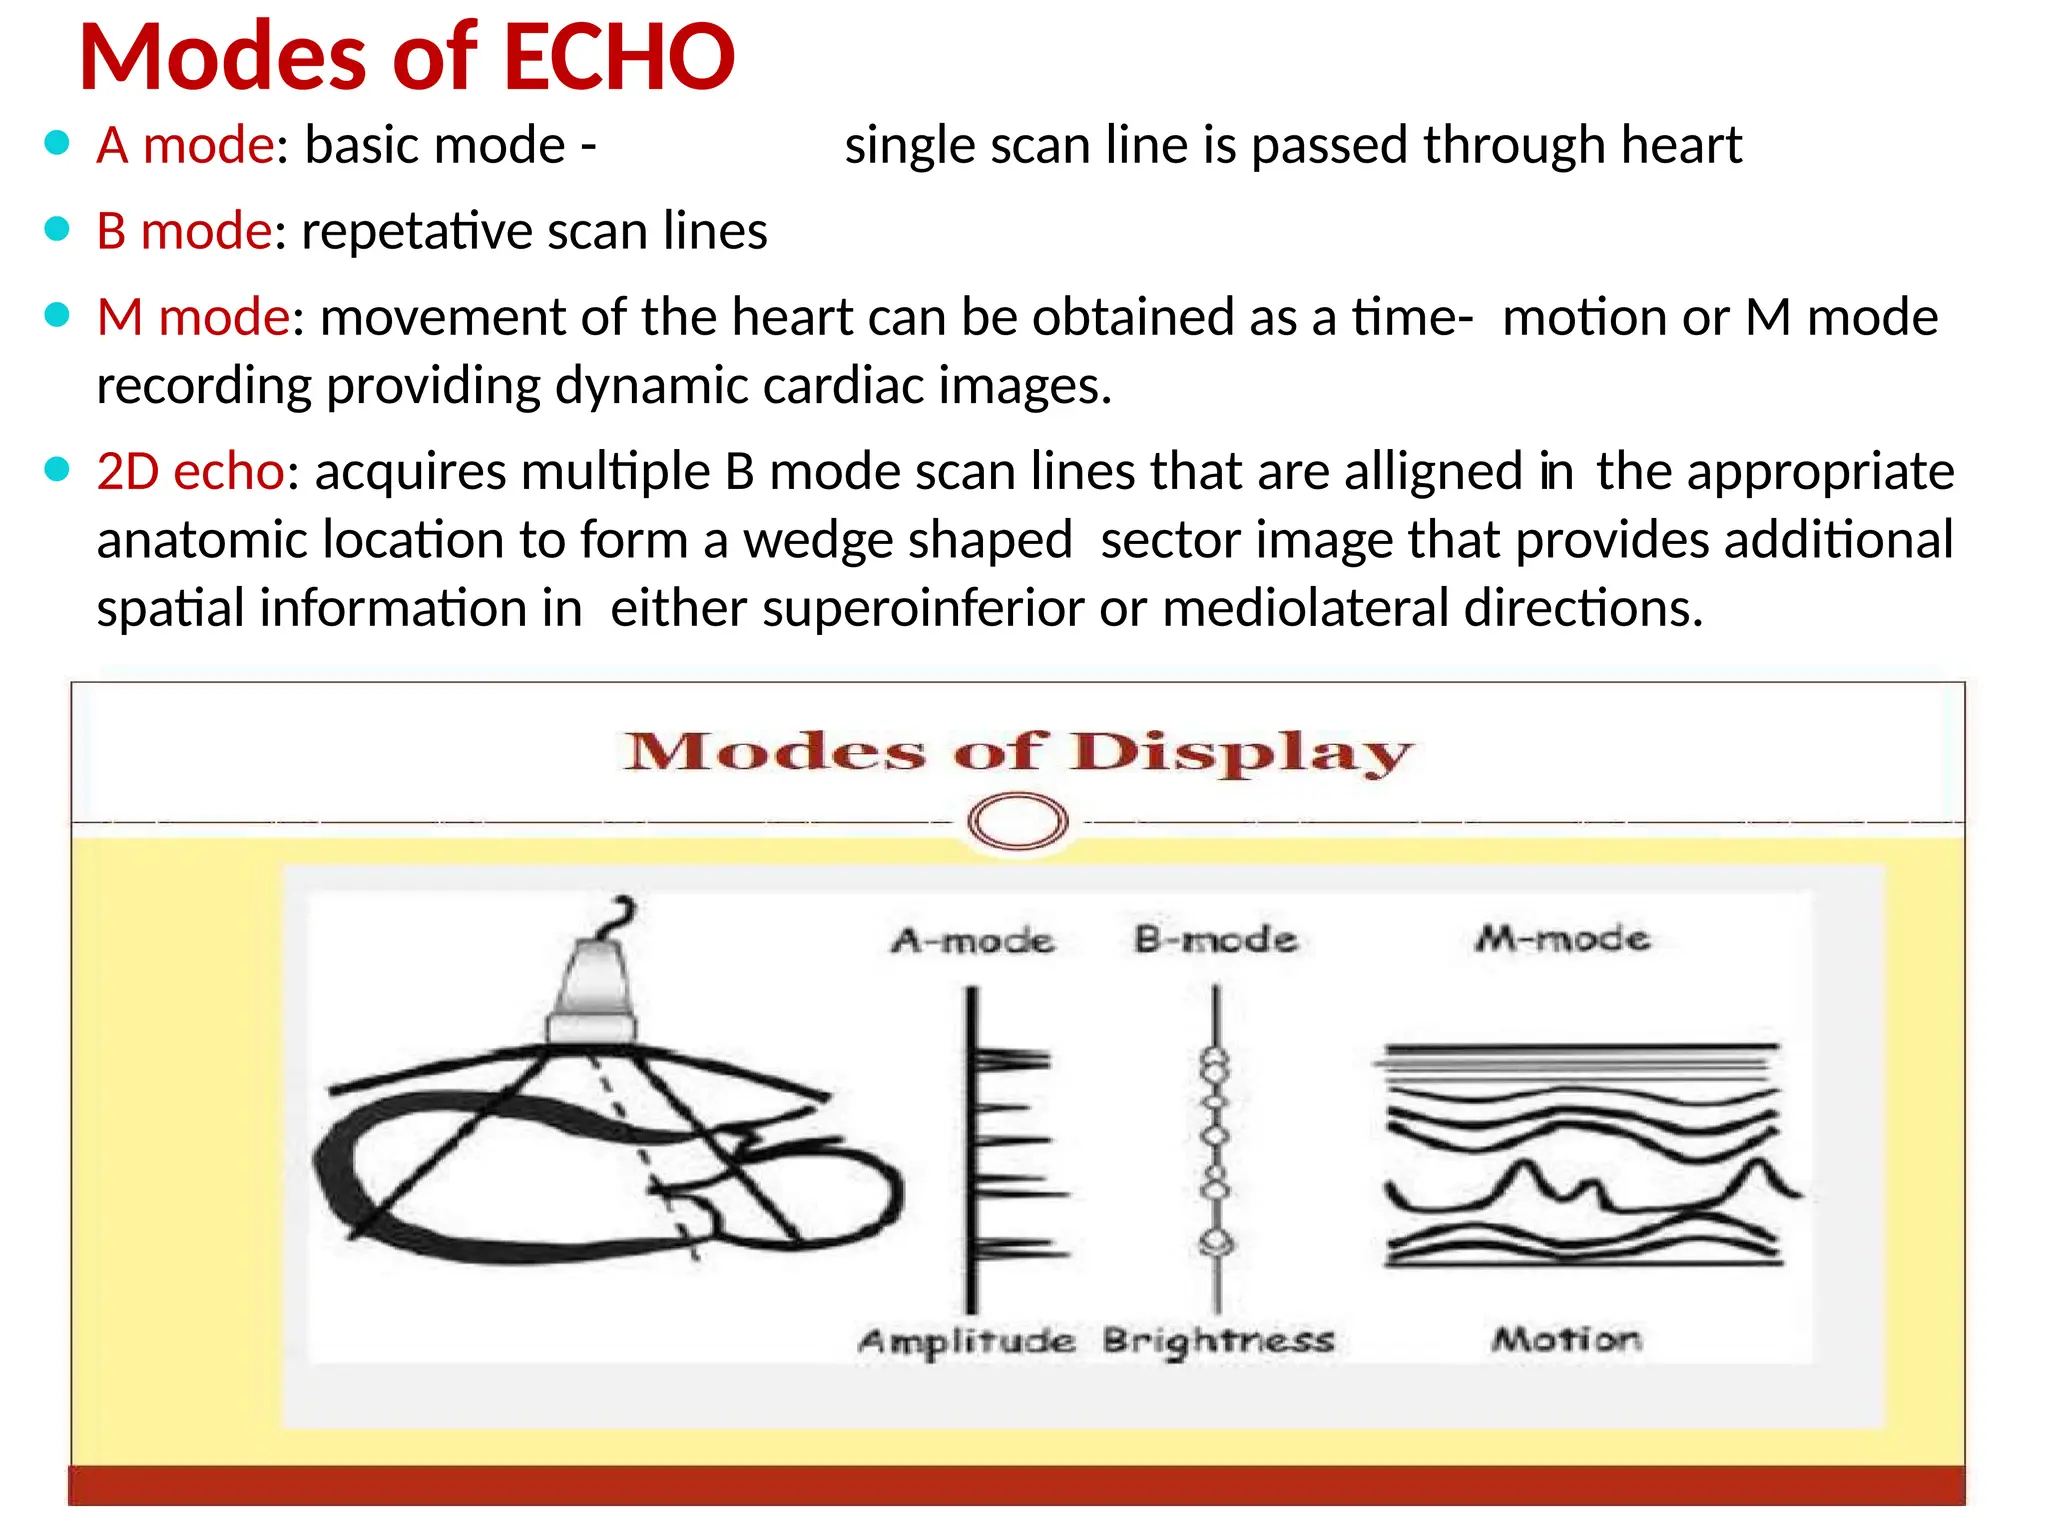
Modes of ECHO
⚫A mode: basic mode - single scan line is passed through heart
⚫ B mode: repetative scan lines
⚫ M mode: movement of the heart can be obtained as a time- motion or M mode
recording providing dynamic cardiac images.
⚫ 2D echo: acquires multiple B mode scan lines that are alligned in the appropriate
anatomic location to form a wedge shaped sector image that provides additional
spatial information in either superoinferior or mediolateral directions.
28.
Doppler echocardiography
49
Doppler echocardiographyis a method for
detecting the direction and velocity of
moving blood within the heart.
Pulsed Wave (PW) useful for low velocity
flow e.g. MV flow
Continuous Wave (CW) useful for high
velocity flow e.g aortic stenosis
Color Flow (CF) Different colors are used
to designate the direction of blood flow.
red is flow toward, and blue is flow away
from the transducer with turbulent flow
shown as a mosaic pattern.
Parasternal Long-Axis View
(PLAX)
Transducerposition: left sternal edge;
2nd – 4th intercostal space
Marker dot direction: points towards
right shoulder
Most echo studies begin with this
view
It sets the stage for subsequent echo
views
Many structures seen from this view
34
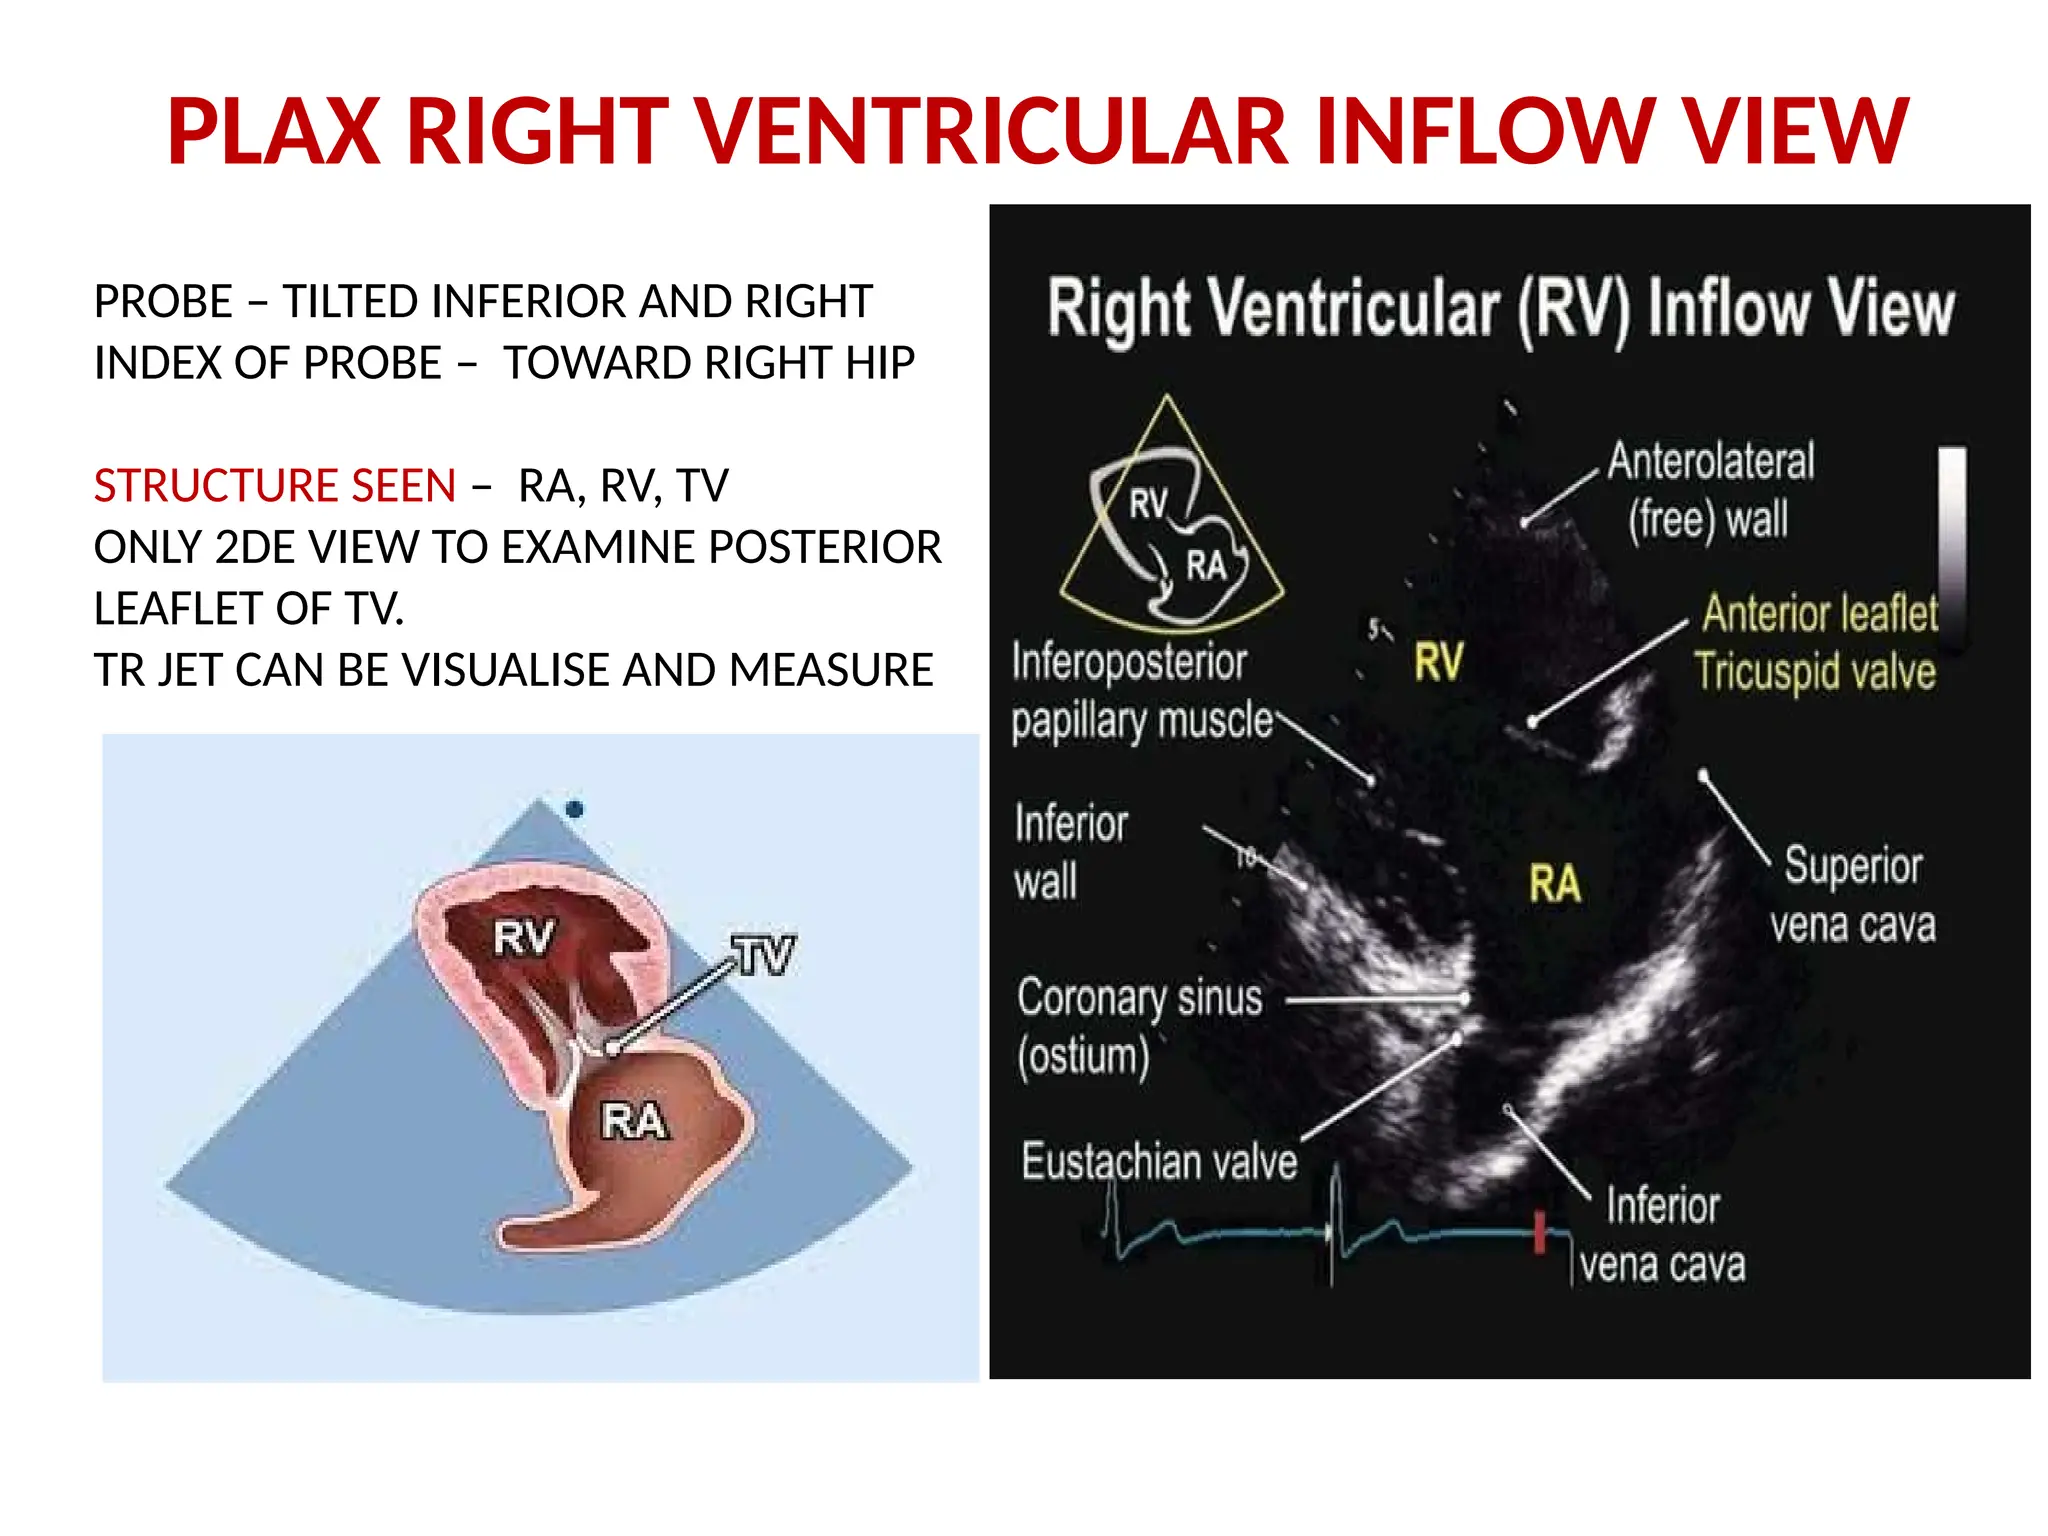
PLAX RIGHT VENTRICULARINFLOW VIEW
PROBE – TILTED INFERIOR AND RIGHT
INDEX OF PROBE – TOWARD RIGHT HIP
STRUCTURE SEEN – RA, RV, TV
ONLY 2DE VIEW TO EXAMINE POSTERIOR
LEAFLET OF TV.
TR JET CAN BE VISUALISE AND MEASURE
39.
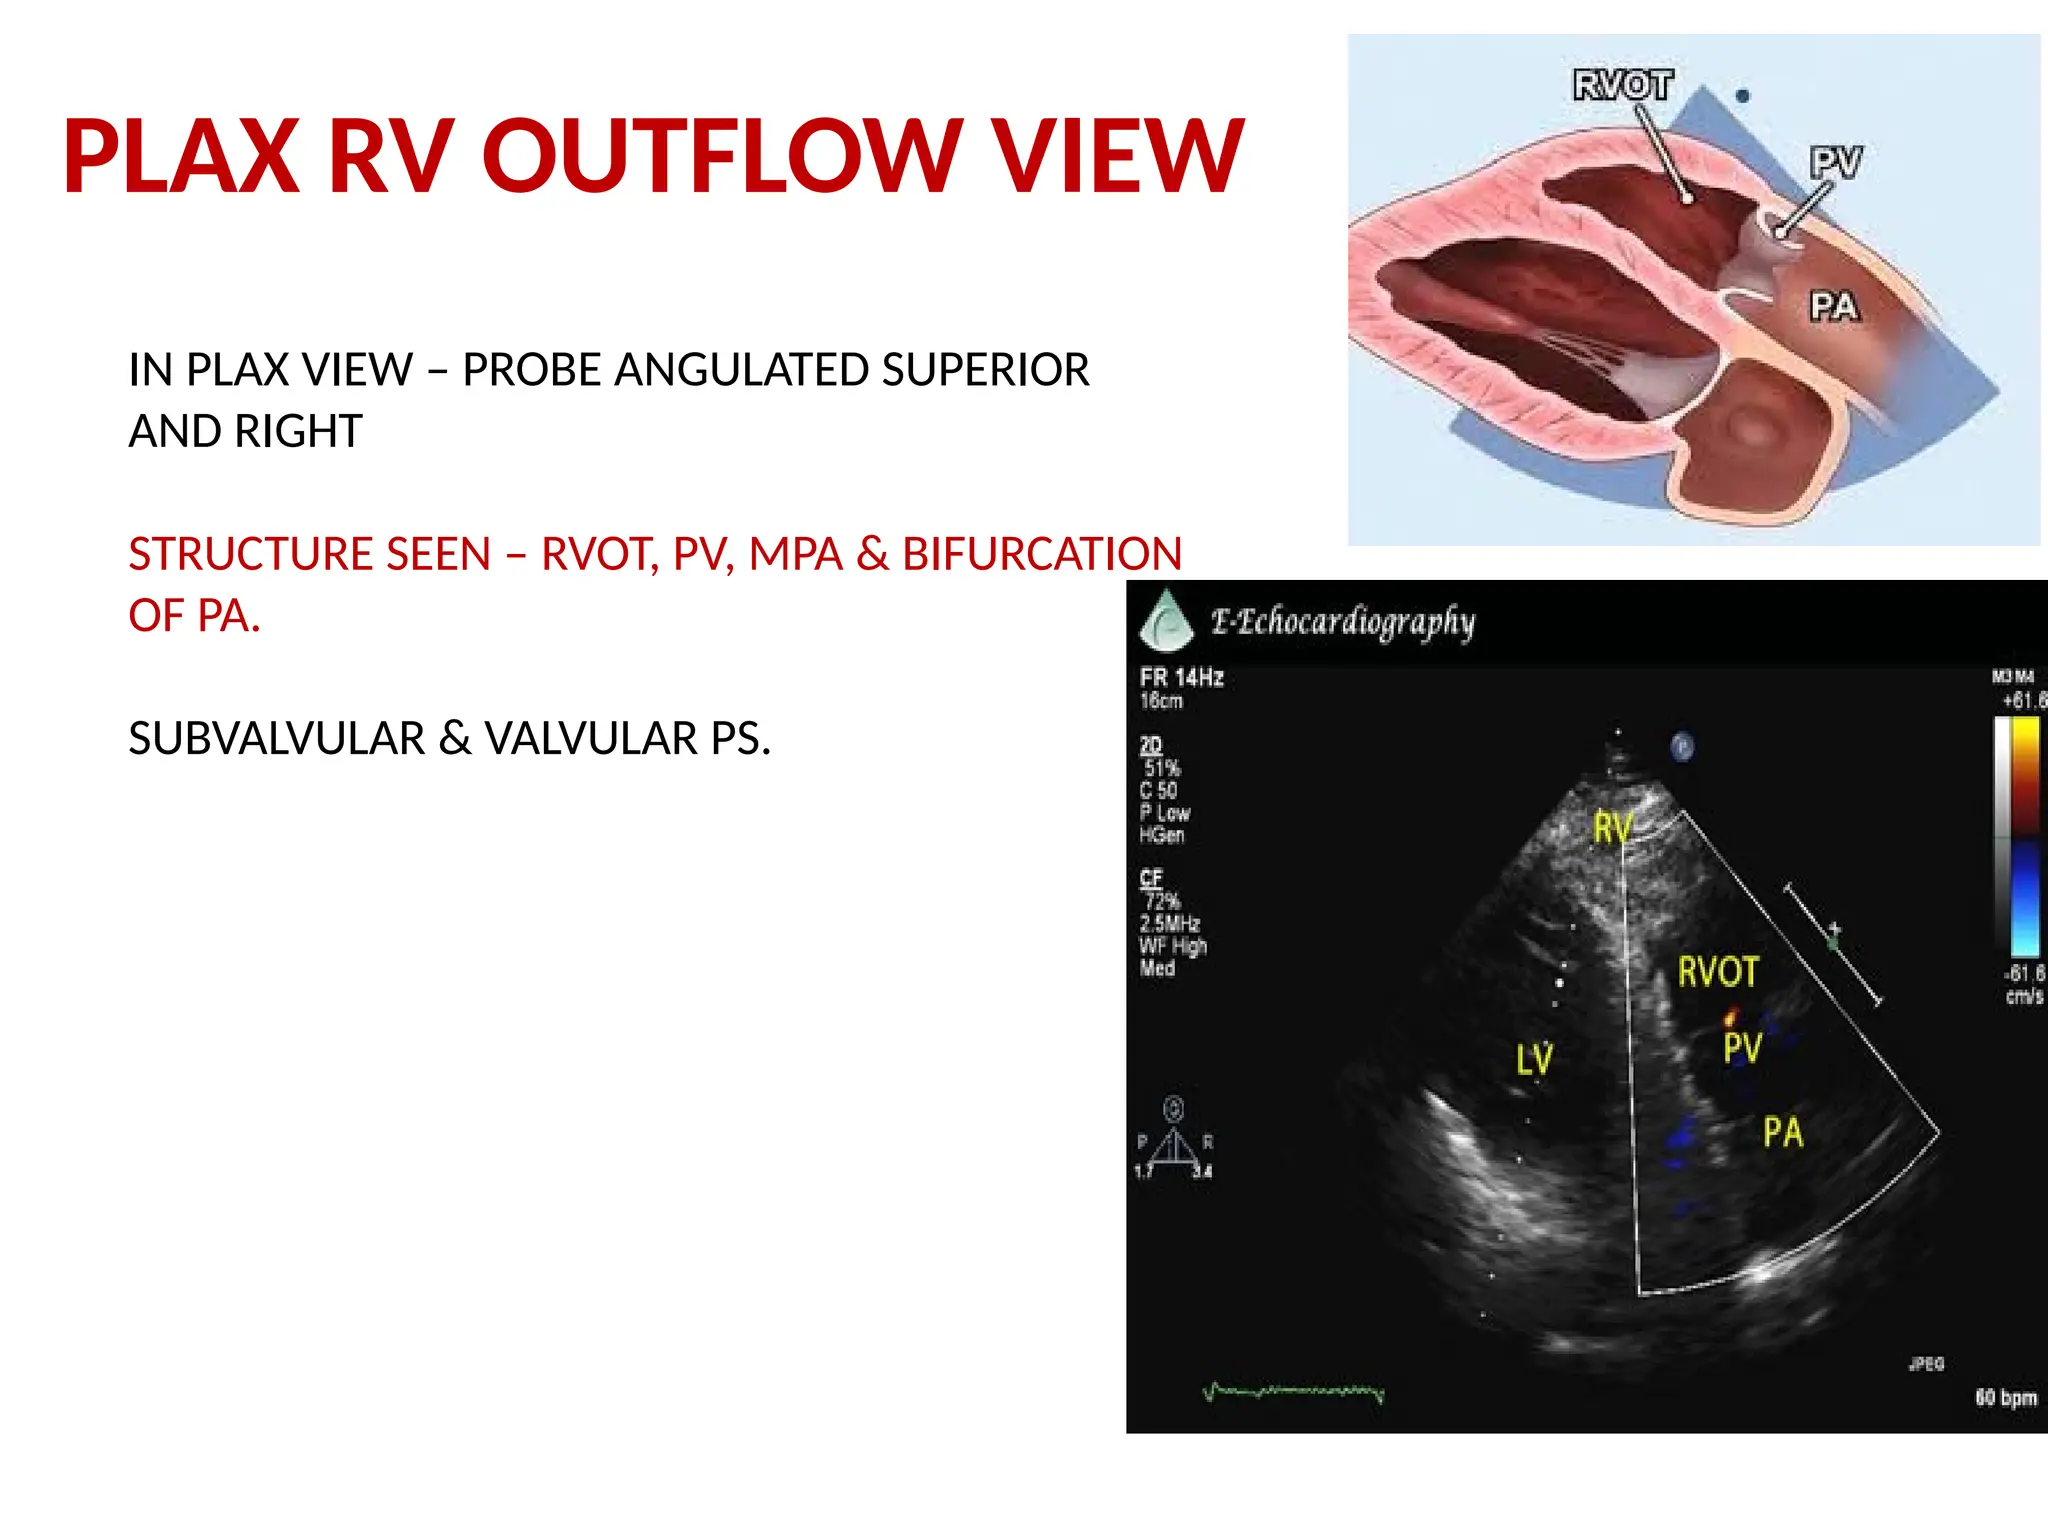
PLAX RV OUTFLOWVIEW
IN PLAX VIEW – PROBE ANGULATED SUPERIOR
AND RIGHT
STRUCTURE SEEN – RVOT, PV, MPA & BIFURCATION
OF PA.
SUBVALVULAR & VALVULAR PS.
40.
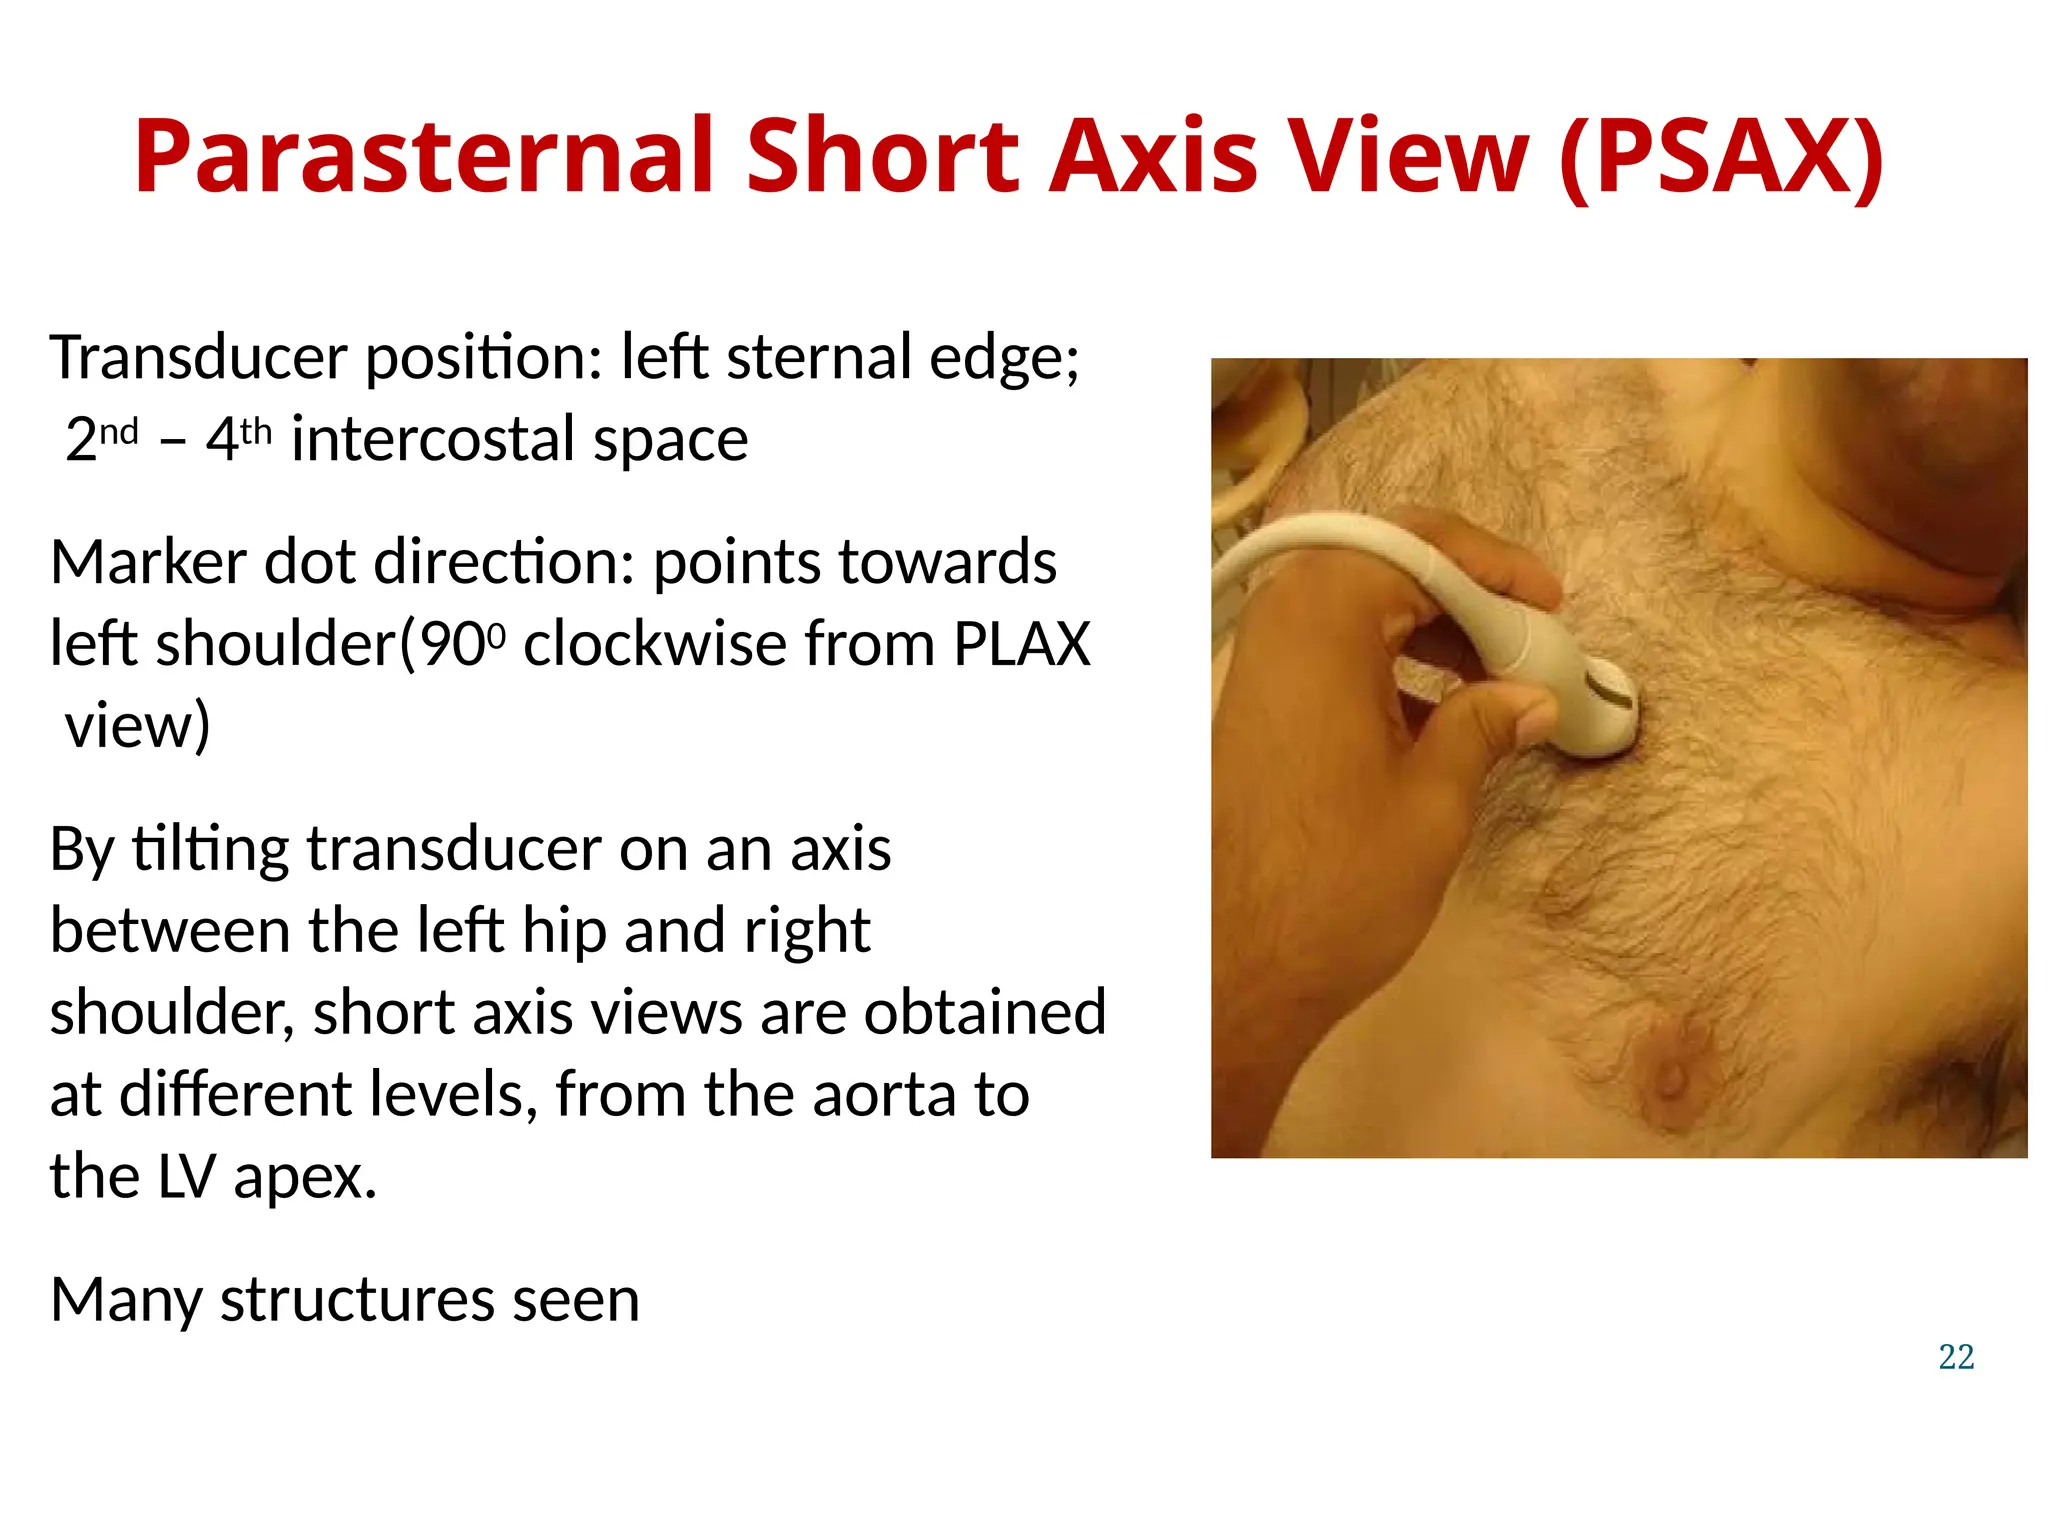
Parasternal Short AxisView (PSAX)
Transducer position: left sternal edge;
2nd – 4th intercostal space
Marker dot direction: points towards
left shoulder(900 clockwise from PLAX
view)
By tilting transducer on an axis
between the left hip and right
shoulder, short axis views are obtained
at different levels, from the aorta to
the LV apex.
Many structures seen
22
44.
PSAX AT AORTICVALVE LEVEL
90 DEGREE CLOCKWISE ROATION FROM PLAX VIEW
INDEX POINT ON PROBE – LEFT SHOULDER
STRUCTURE SEEN – AORTIC VALVE, RVOT, PV, MPA
RA,LA, TV
PV, MPA OR BIFURCATION – SUPERIOR & LEFT
TV – PROBE -> INFERIOR & RIGHT
LAA – PROBE -> INFERIOR & LEFT
PATHOLOGY SEEN – VSD (PERIMEMBRANOUS, SUBAORTIC &
SUBPULMONIC), ASD , PFO, PDA, RVOT & PV ABNORMALITY.
ABNORMALITIES OF CORONARY ARTERY CAN BE SEEN
45.
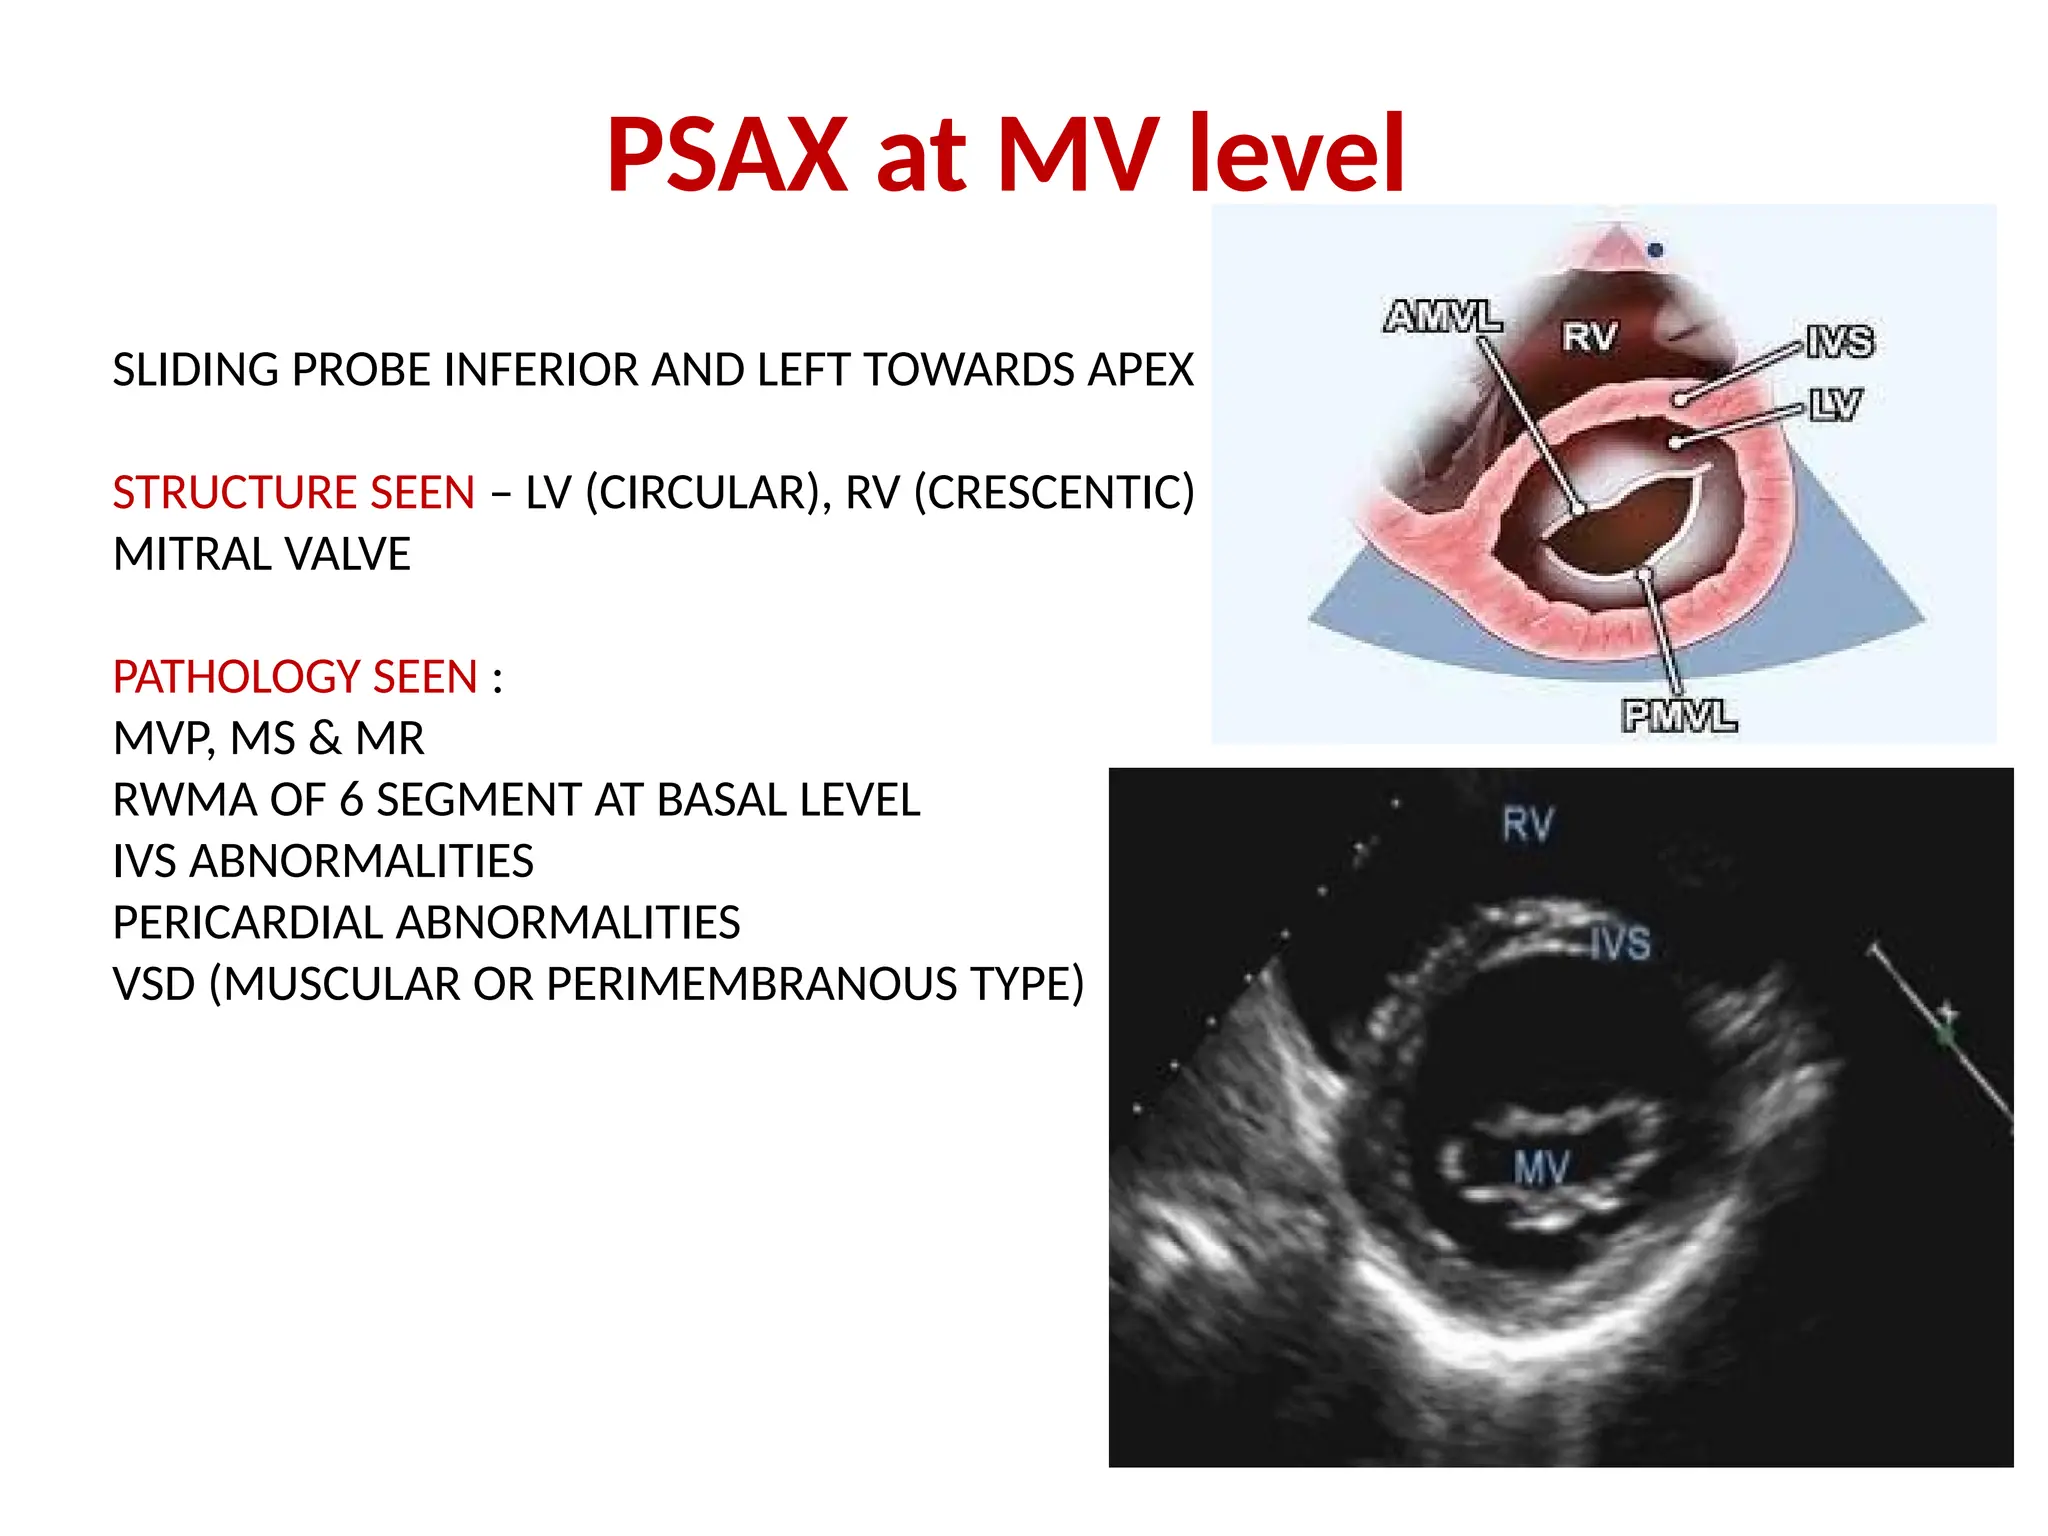
PSAX at MVlevel
SLIDING PROBE INFERIOR AND LEFT TOWARDS APEX
STRUCTURE SEEN – LV (CIRCULAR), RV (CRESCENTIC)
MITRAL VALVE
PATHOLOGY SEEN :
MVP, MS & MR
RWMA OF 6 SEGMENT AT BASAL LEVEL
IVS ABNORMALITIES
PERICARDIAL ABNORMALITIES
VSD (MUSCULAR OR PERIMEMBRANOUS TYPE)
46.
PSAX view atPM level
PROBE POSITION – SLIDING LITTLE INFERIOR AND LEFT
STRUCTURE SEEN : LV (CIRCULAR), RV (CRESCENTIC)
ALPM (4o’ clock), PMPM (8o’ clock)
PATHOLOGY SEEN :
RWMA OF 6 SEGMENT AT PM LEVEL
VSD (MUSCULAR)
PERICARDIAL EFFUSION
47.
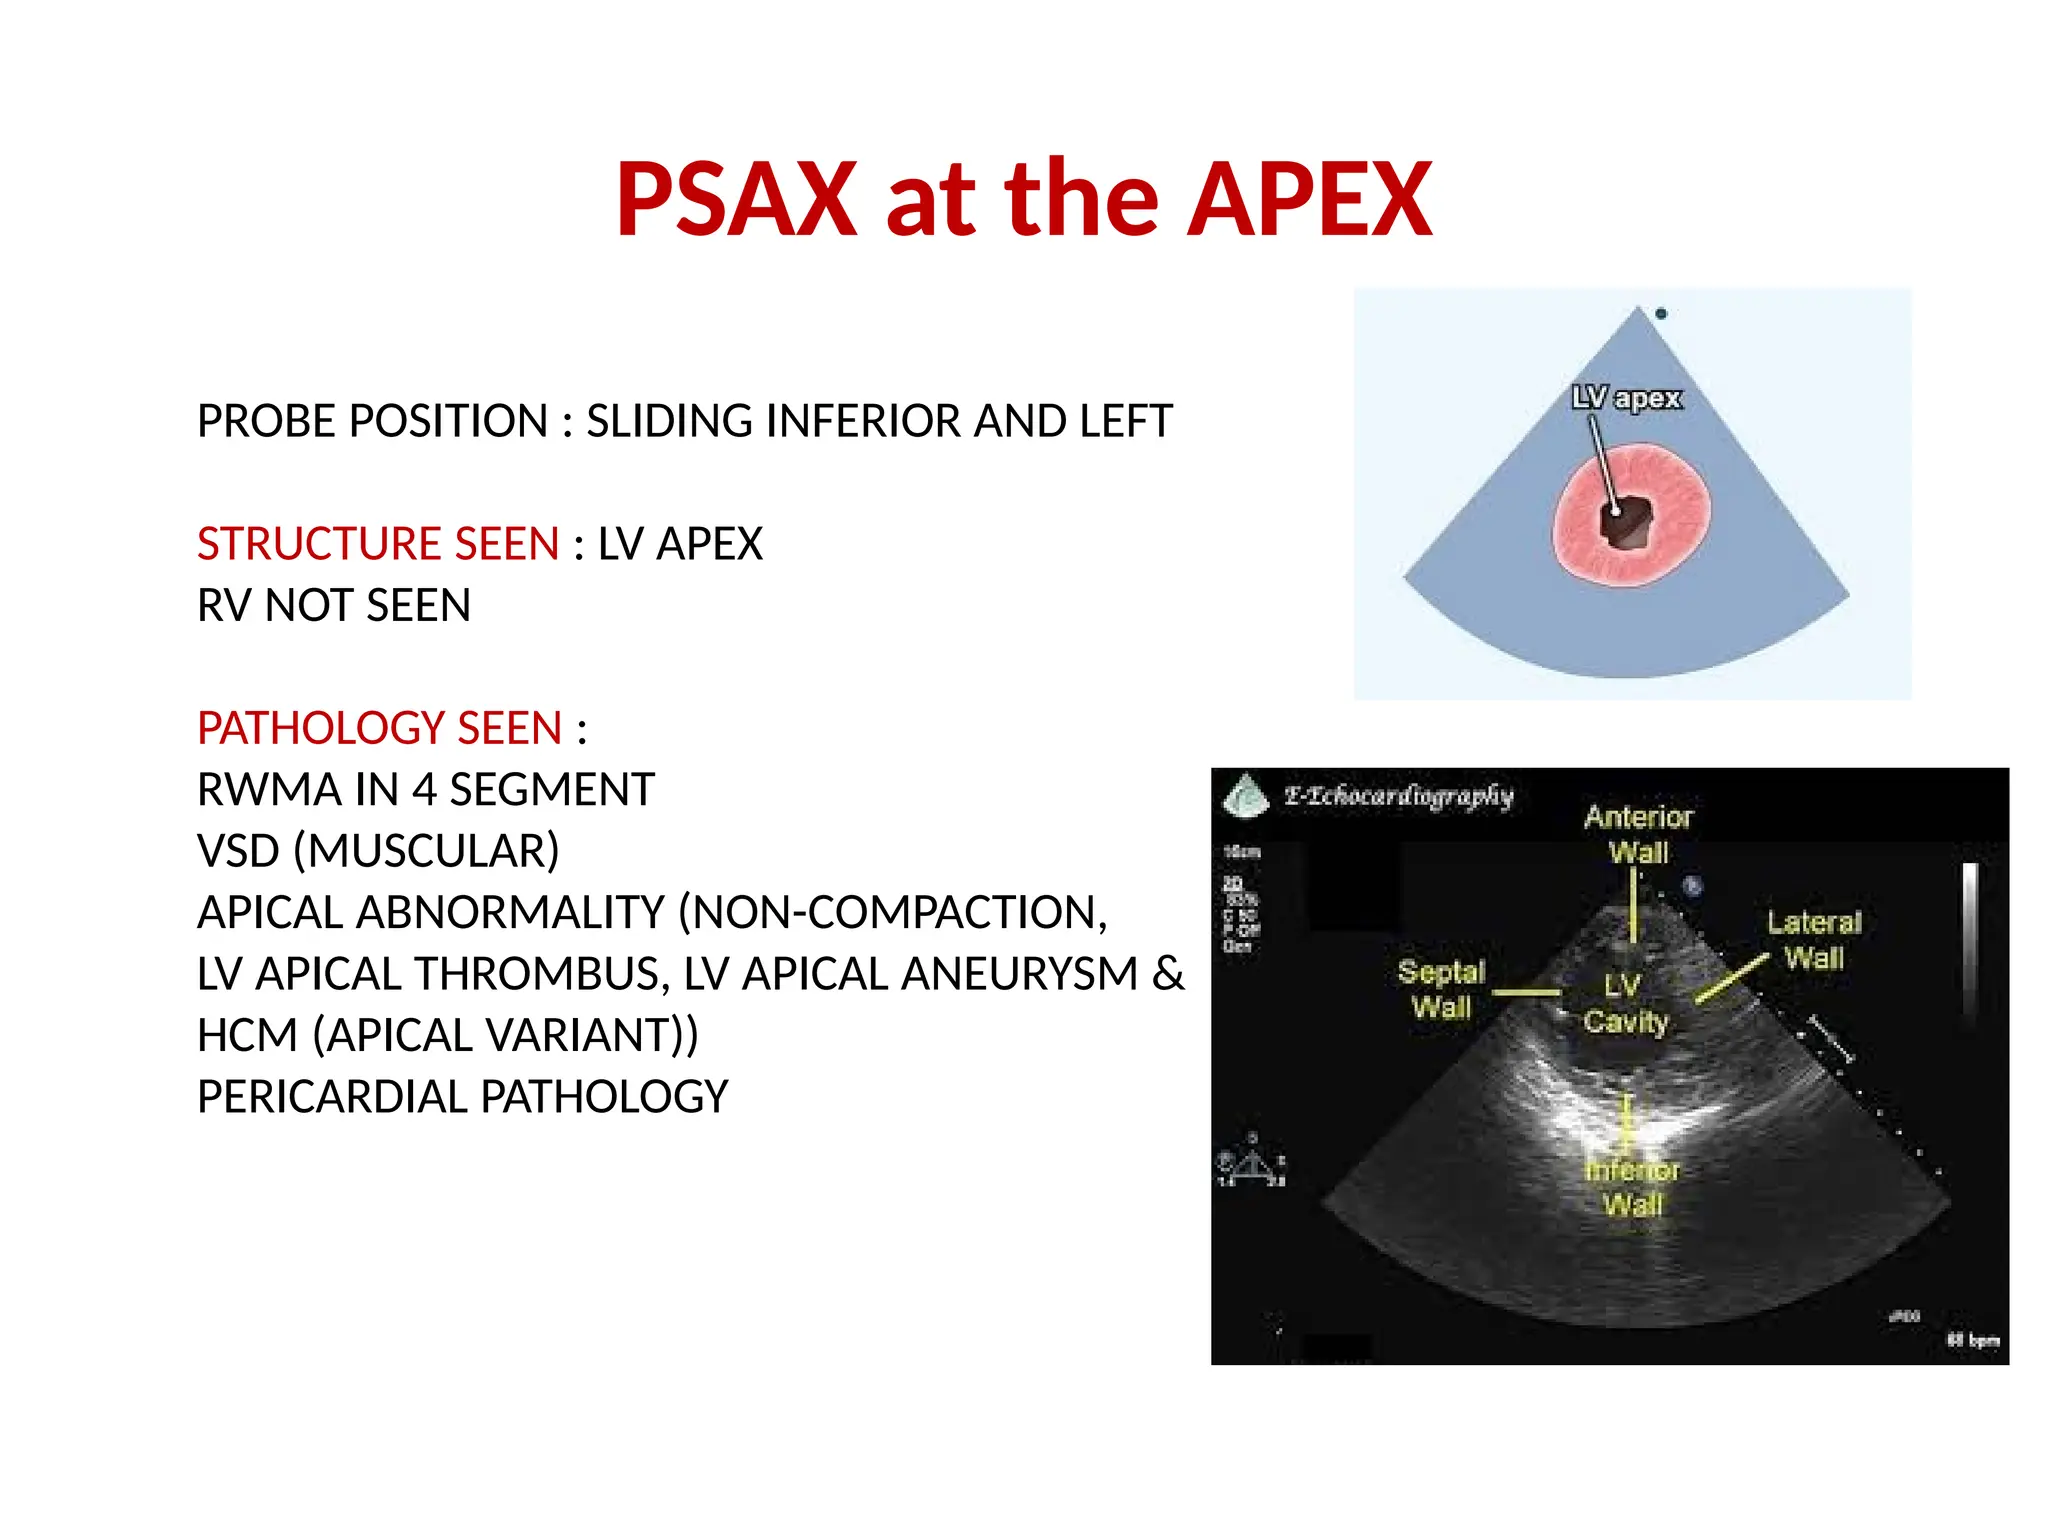
PSAX at theAPEX
PROBE POSITION : SLIDING INFERIOR AND LEFT
STRUCTURE SEEN : LV APEX
RV NOT SEEN
PATHOLOGY SEEN :
RWMA IN 4 SEGMENT
VSD (MUSCULAR)
APICAL ABNORMALITY (NON-COMPACTION,
LV APICAL THROMBUS, LV APICAL ANEURYSM &
HCM (APICAL VARIANT))
PERICARDIAL PATHOLOGY
49.
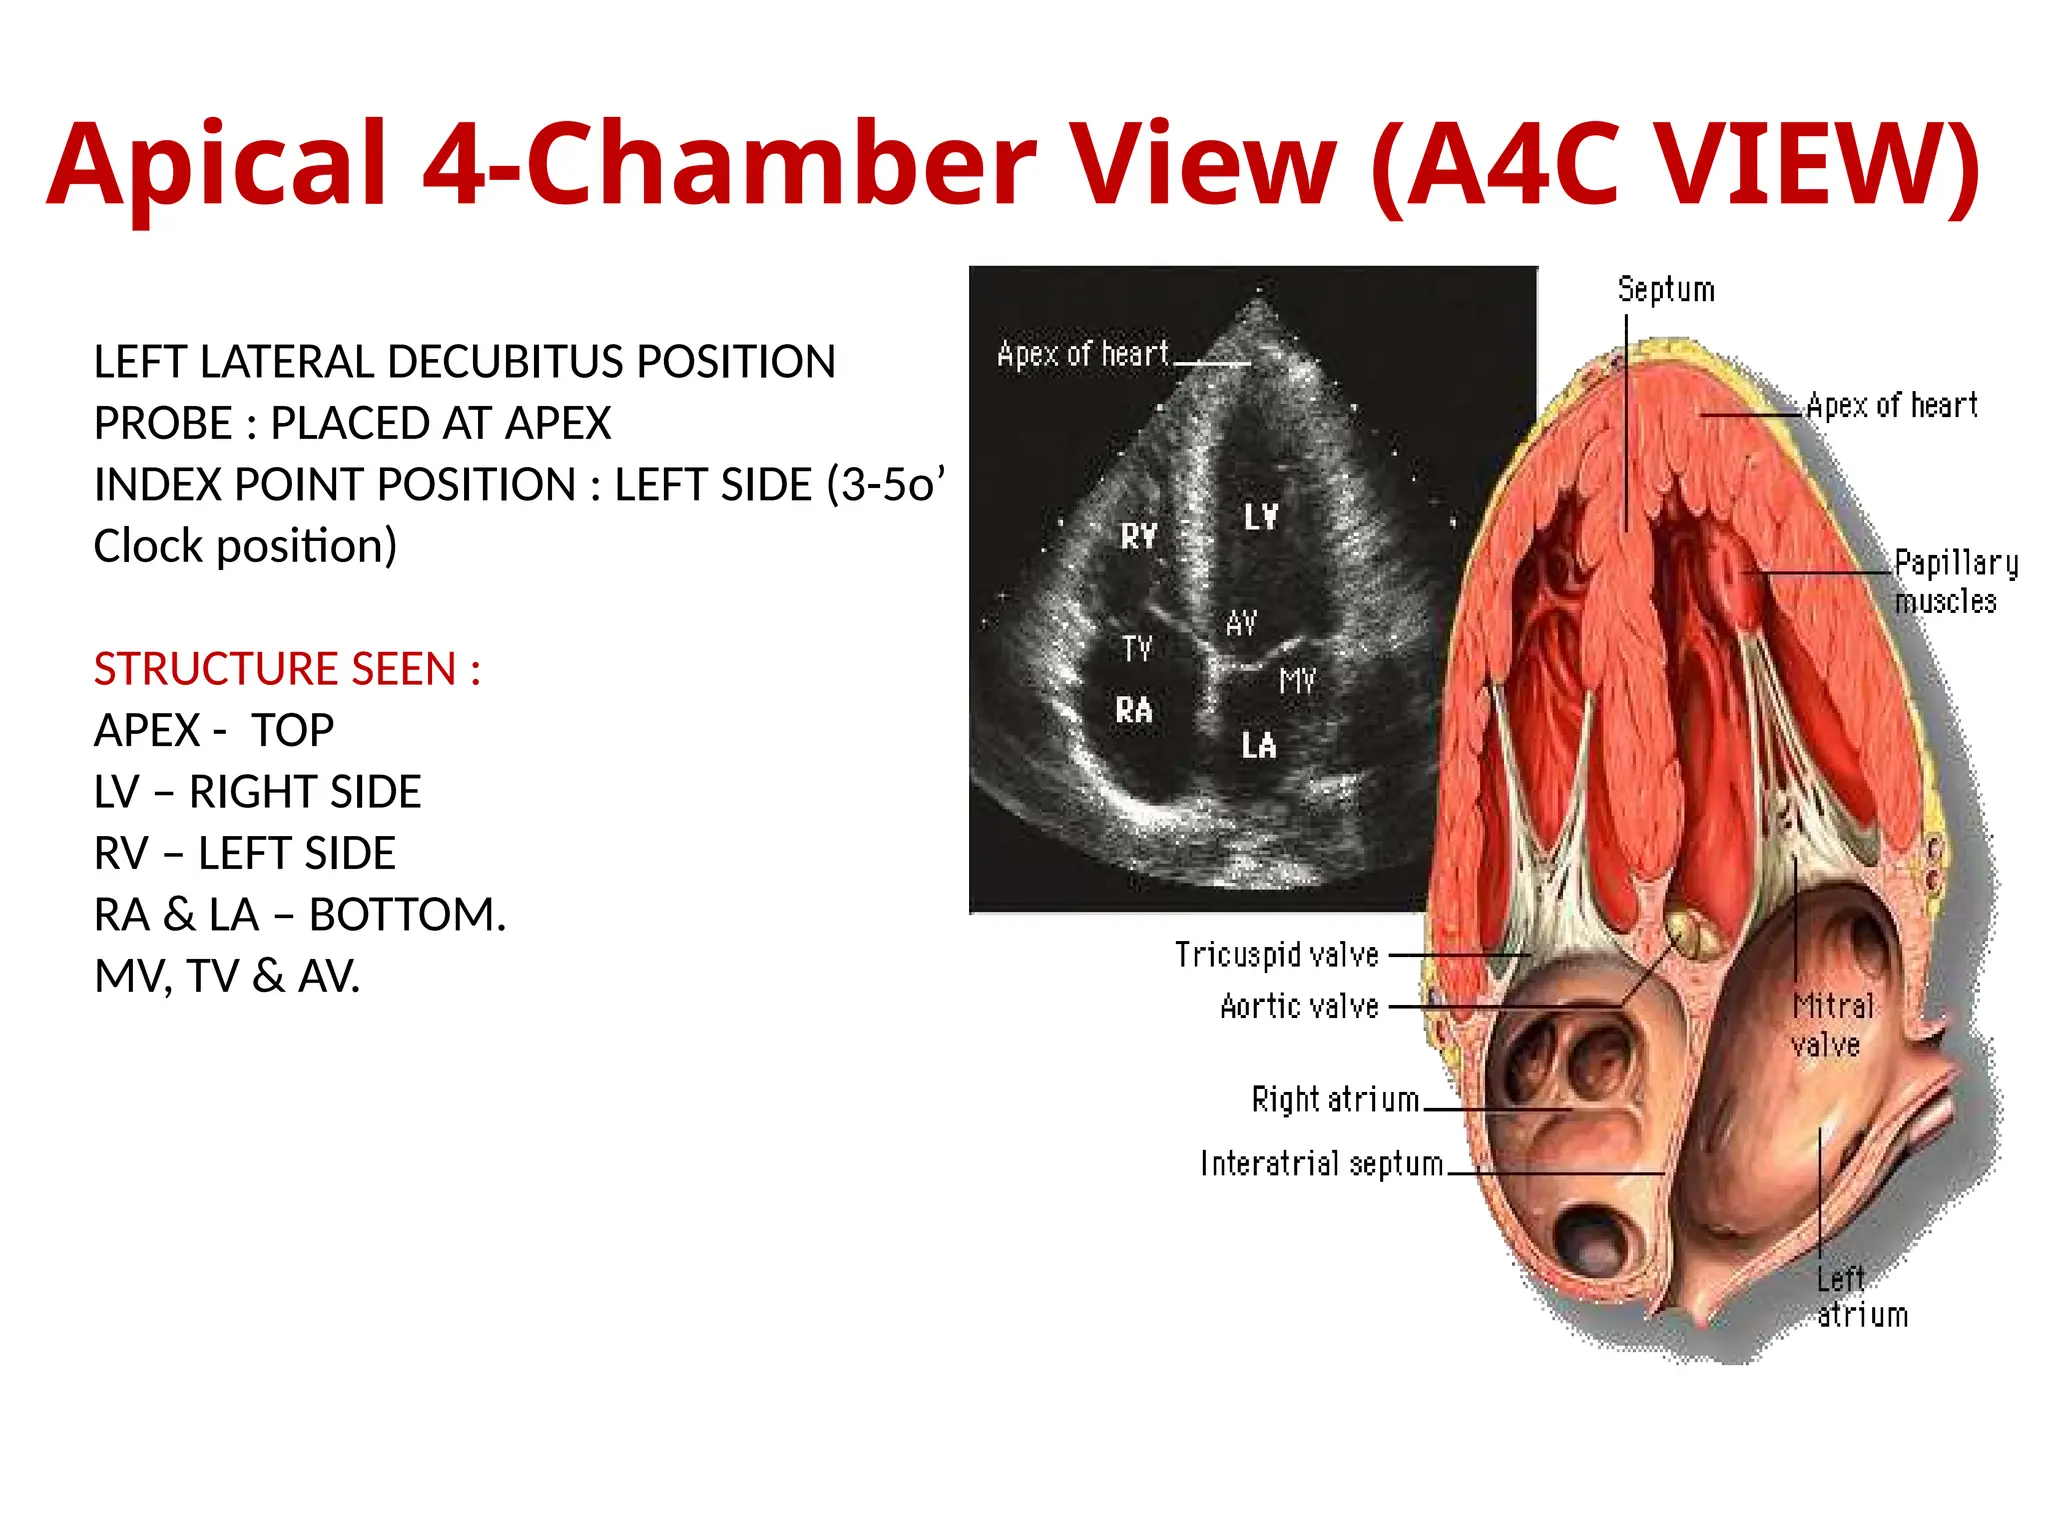
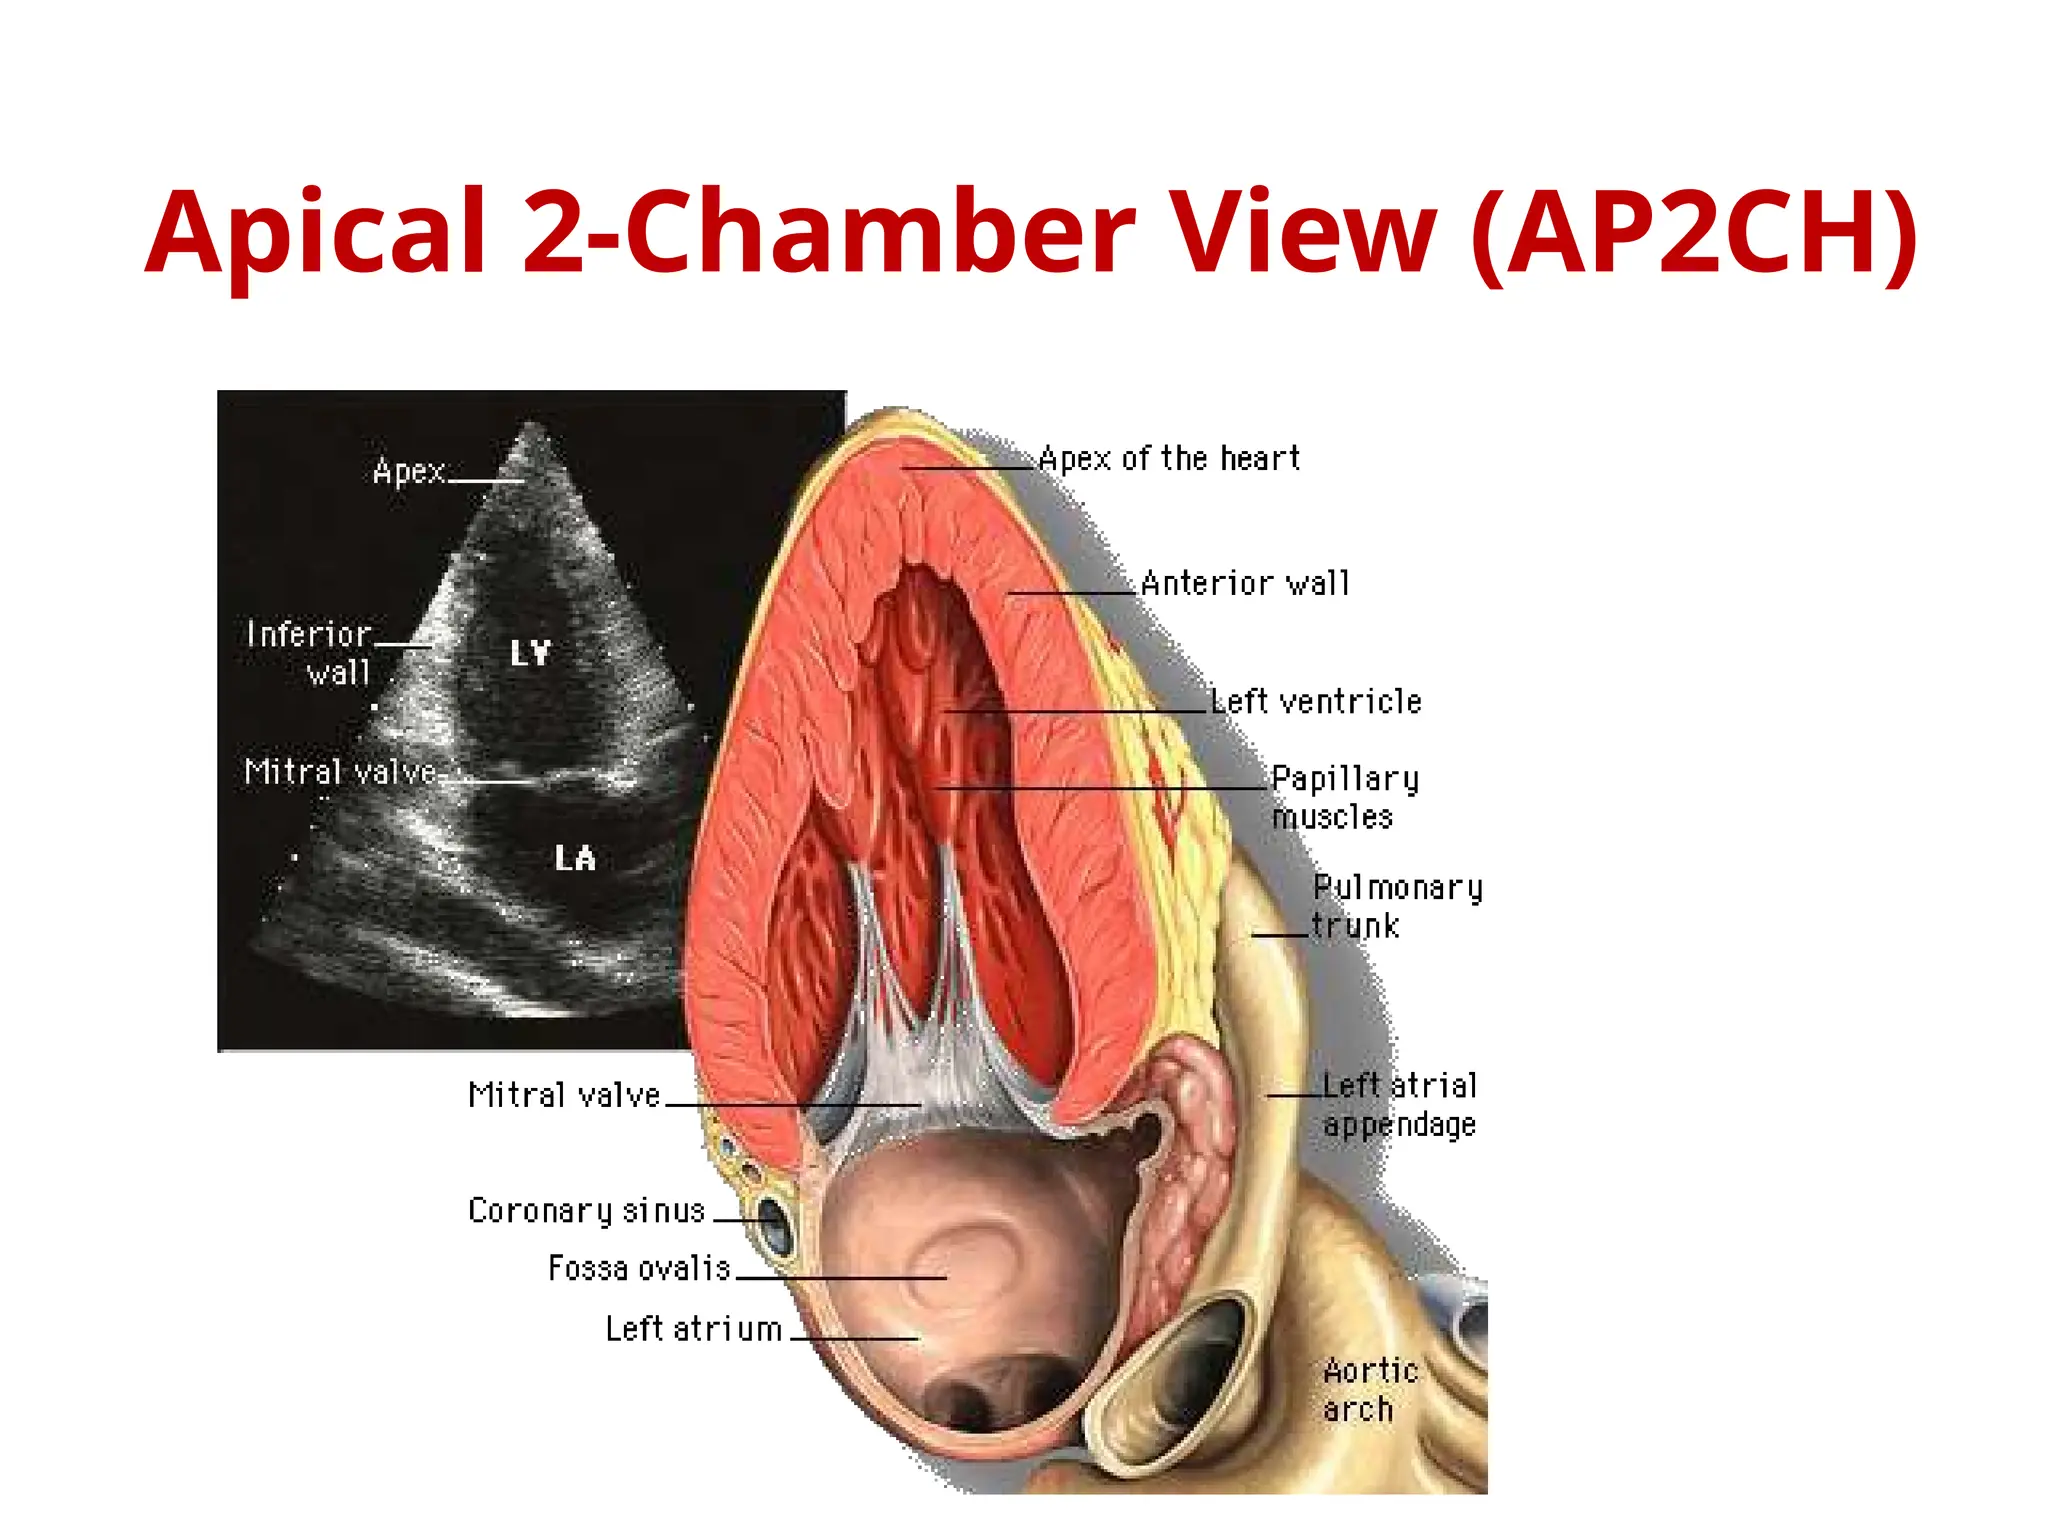
Apical 4-Chamber View(A4C VIEW)
LEFT LATERAL DECUBITUS POSITION
PROBE : PLACED AT APEX
INDEX POINT POSITION : LEFT SIDE (3-5o’
Clock position)
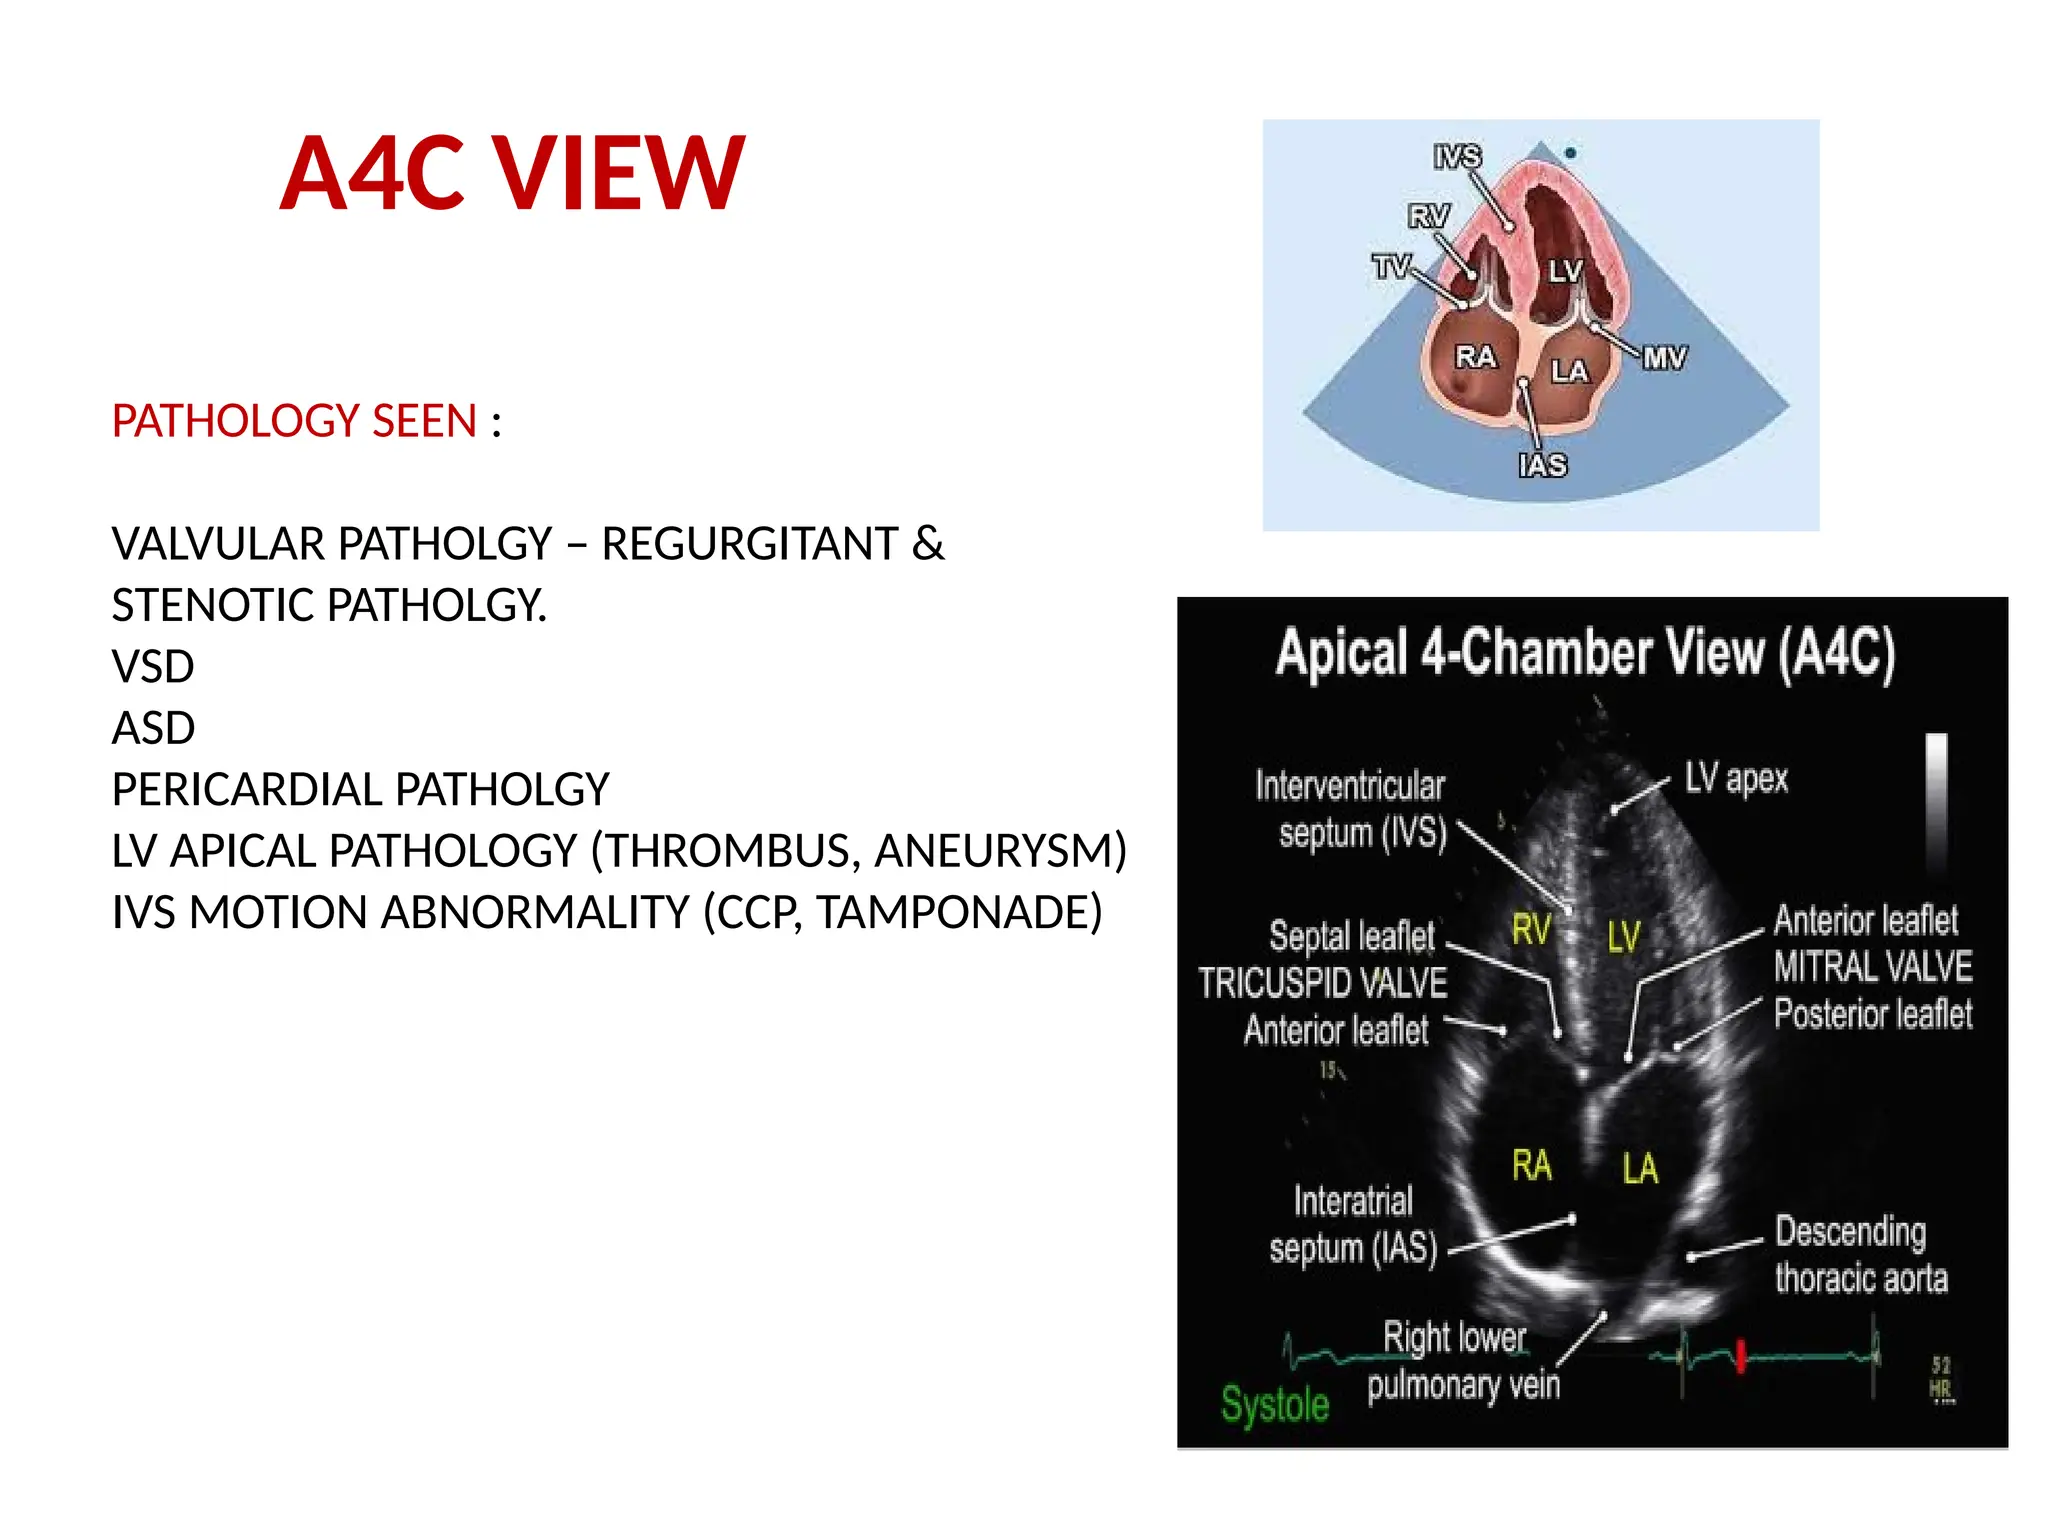
STRUCTURE SEEN :
APEX - TOP
LV – RIGHT SIDE
RV – LEFT SIDE
RA & LA – BOTTOM.
MV, TV & AV.
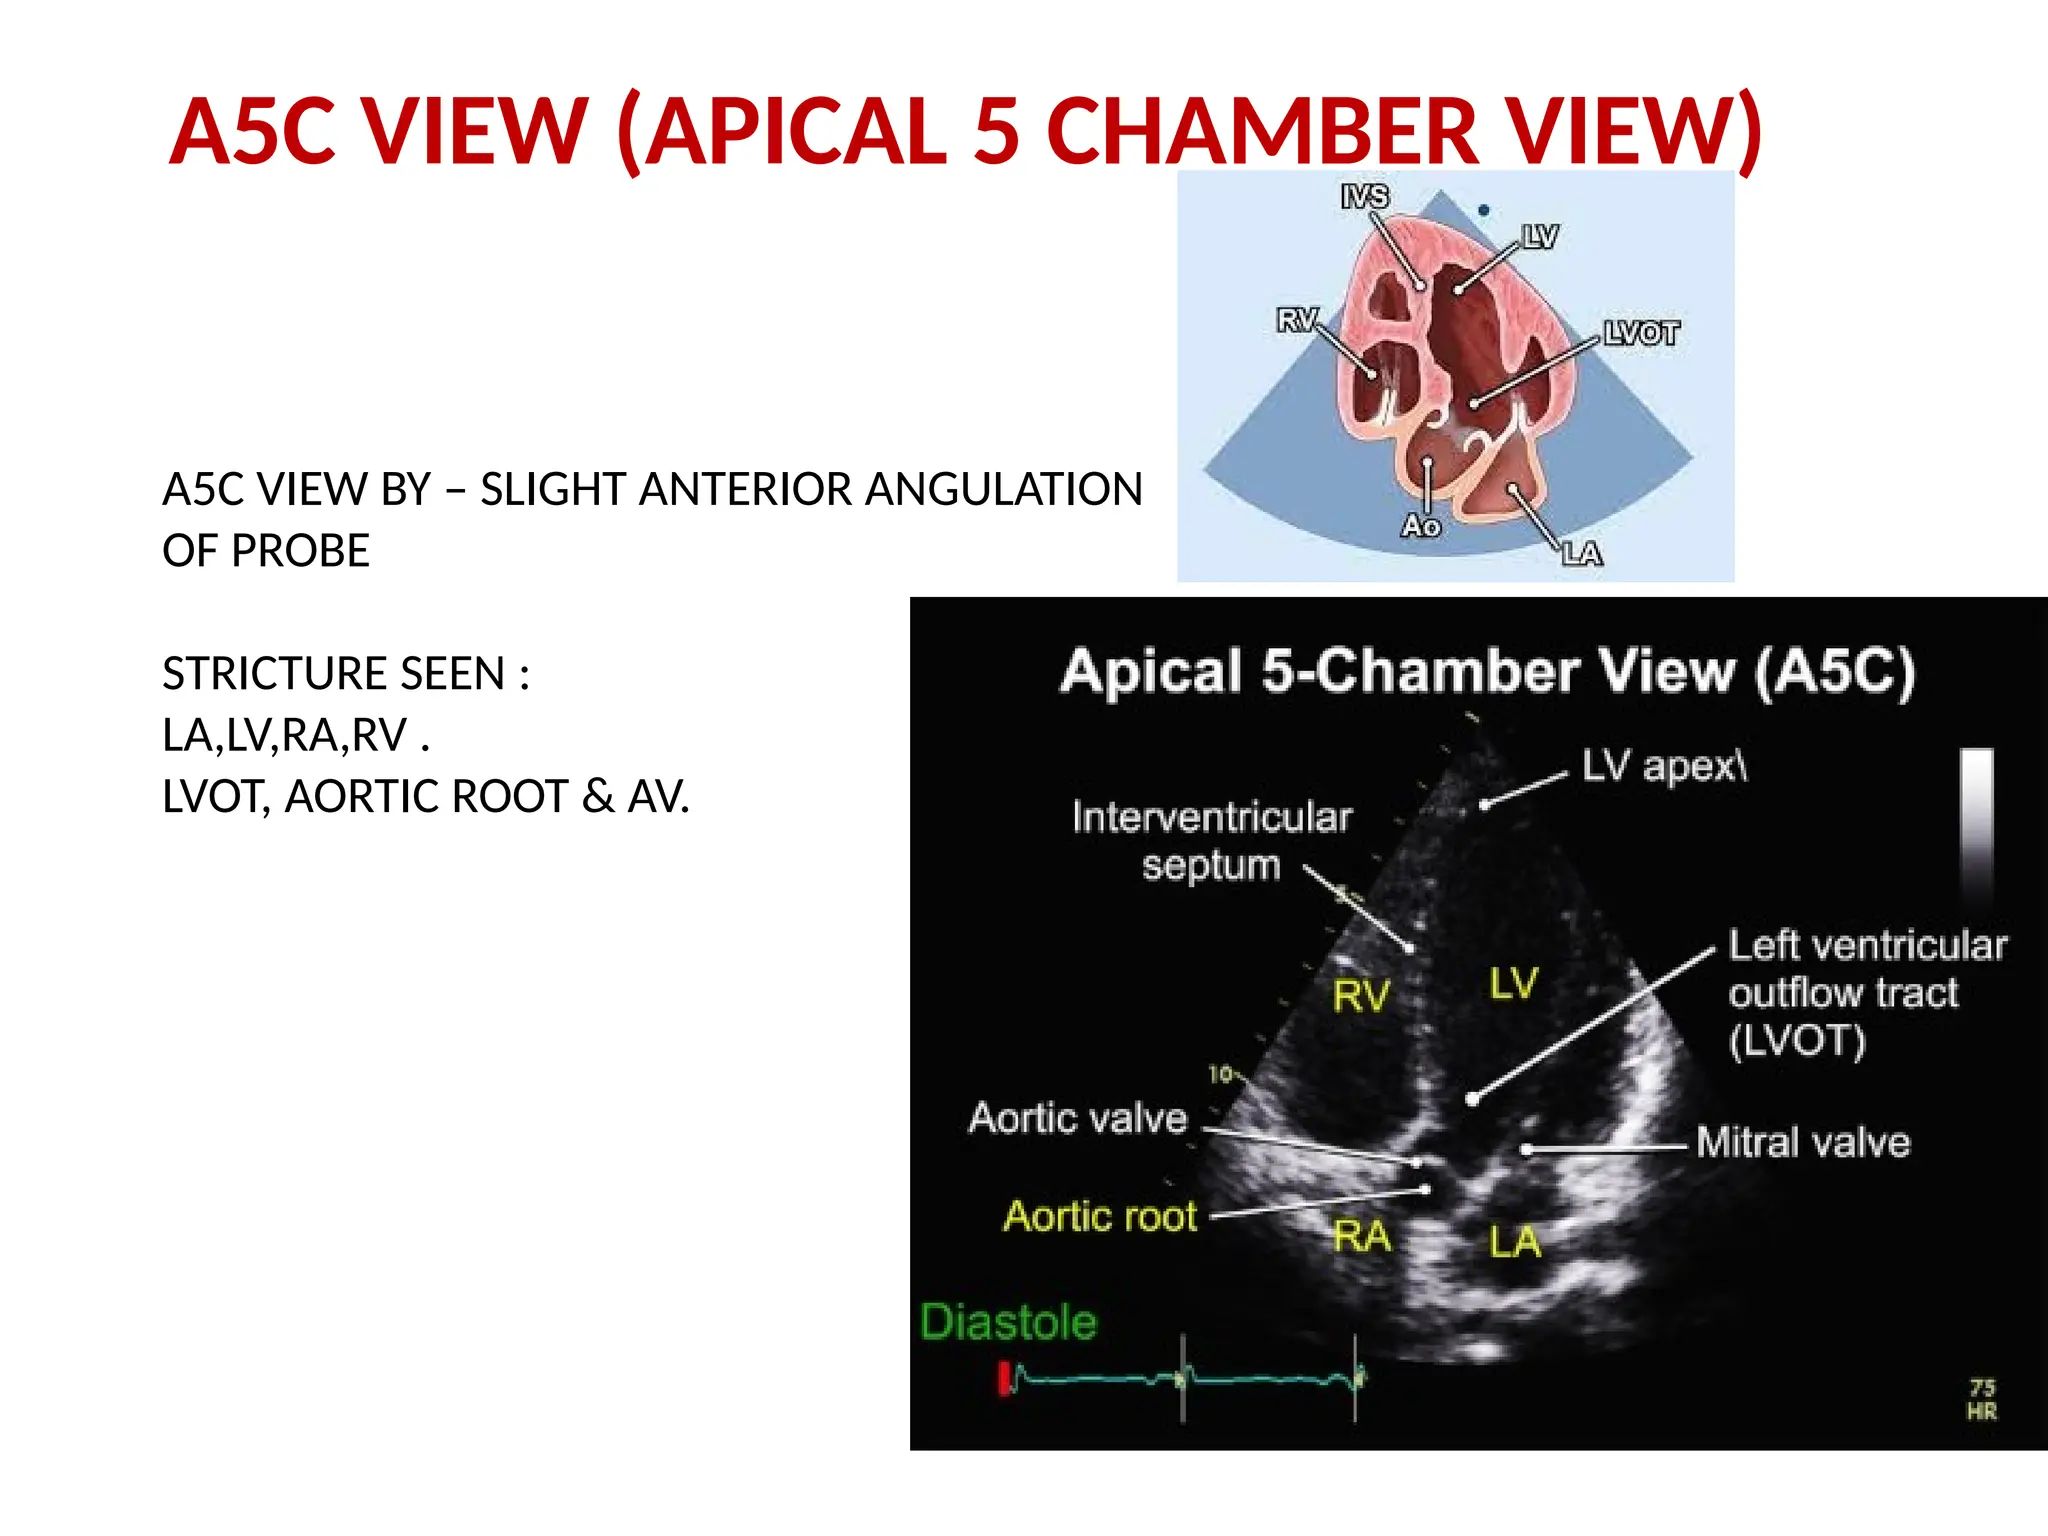
A5C VIEW (APICAL5 CHAMBER VIEW)
A5C VIEW BY – SLIGHT ANTERIOR ANGULATION
OF PROBE
STRICTURE SEEN :
LA,LV,RA,RV .
LVOT, AORTIC ROOT & AV.
54.
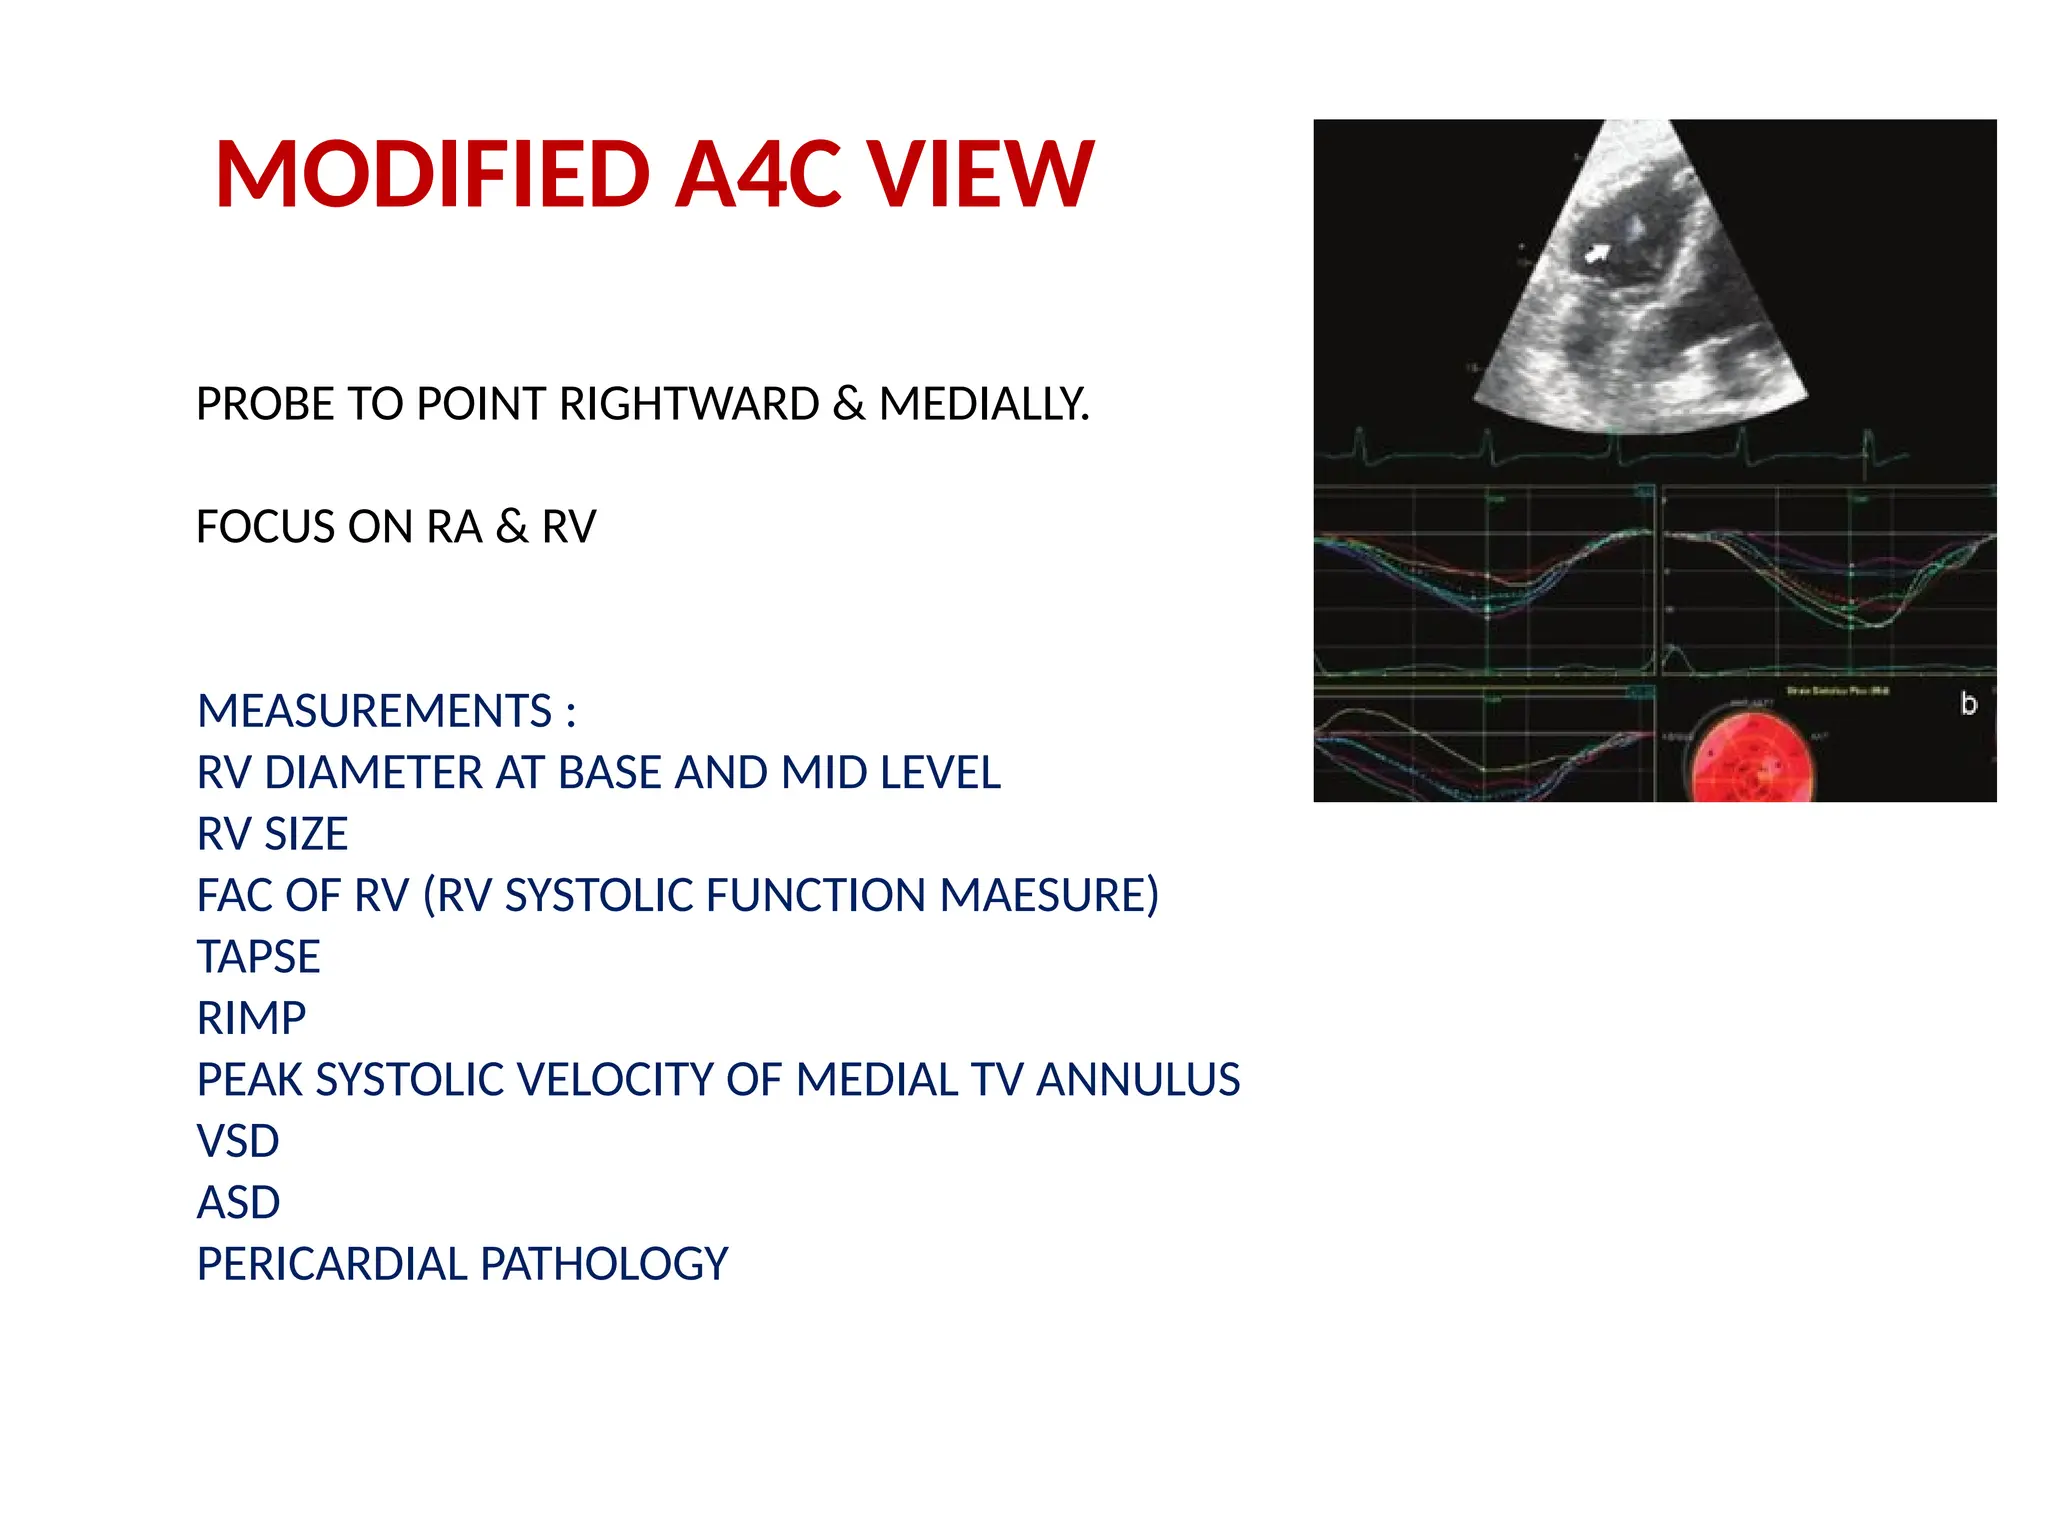
MODIFIED A4C VIEW
PROBETO POINT RIGHTWARD & MEDIALLY.
FOCUS ON RA & RV
MEASUREMENTS :
RV DIAMETER AT BASE AND MID LEVEL
RV SIZE
FAC OF RV (RV SYSTOLIC FUNCTION MAESURE)
TAPSE
RIMP
PEAK SYSTOLIC VELOCITY OF MEDIAL TV ANNULUS
VSD
ASD
PERICARDIAL PATHOLOGY
55.
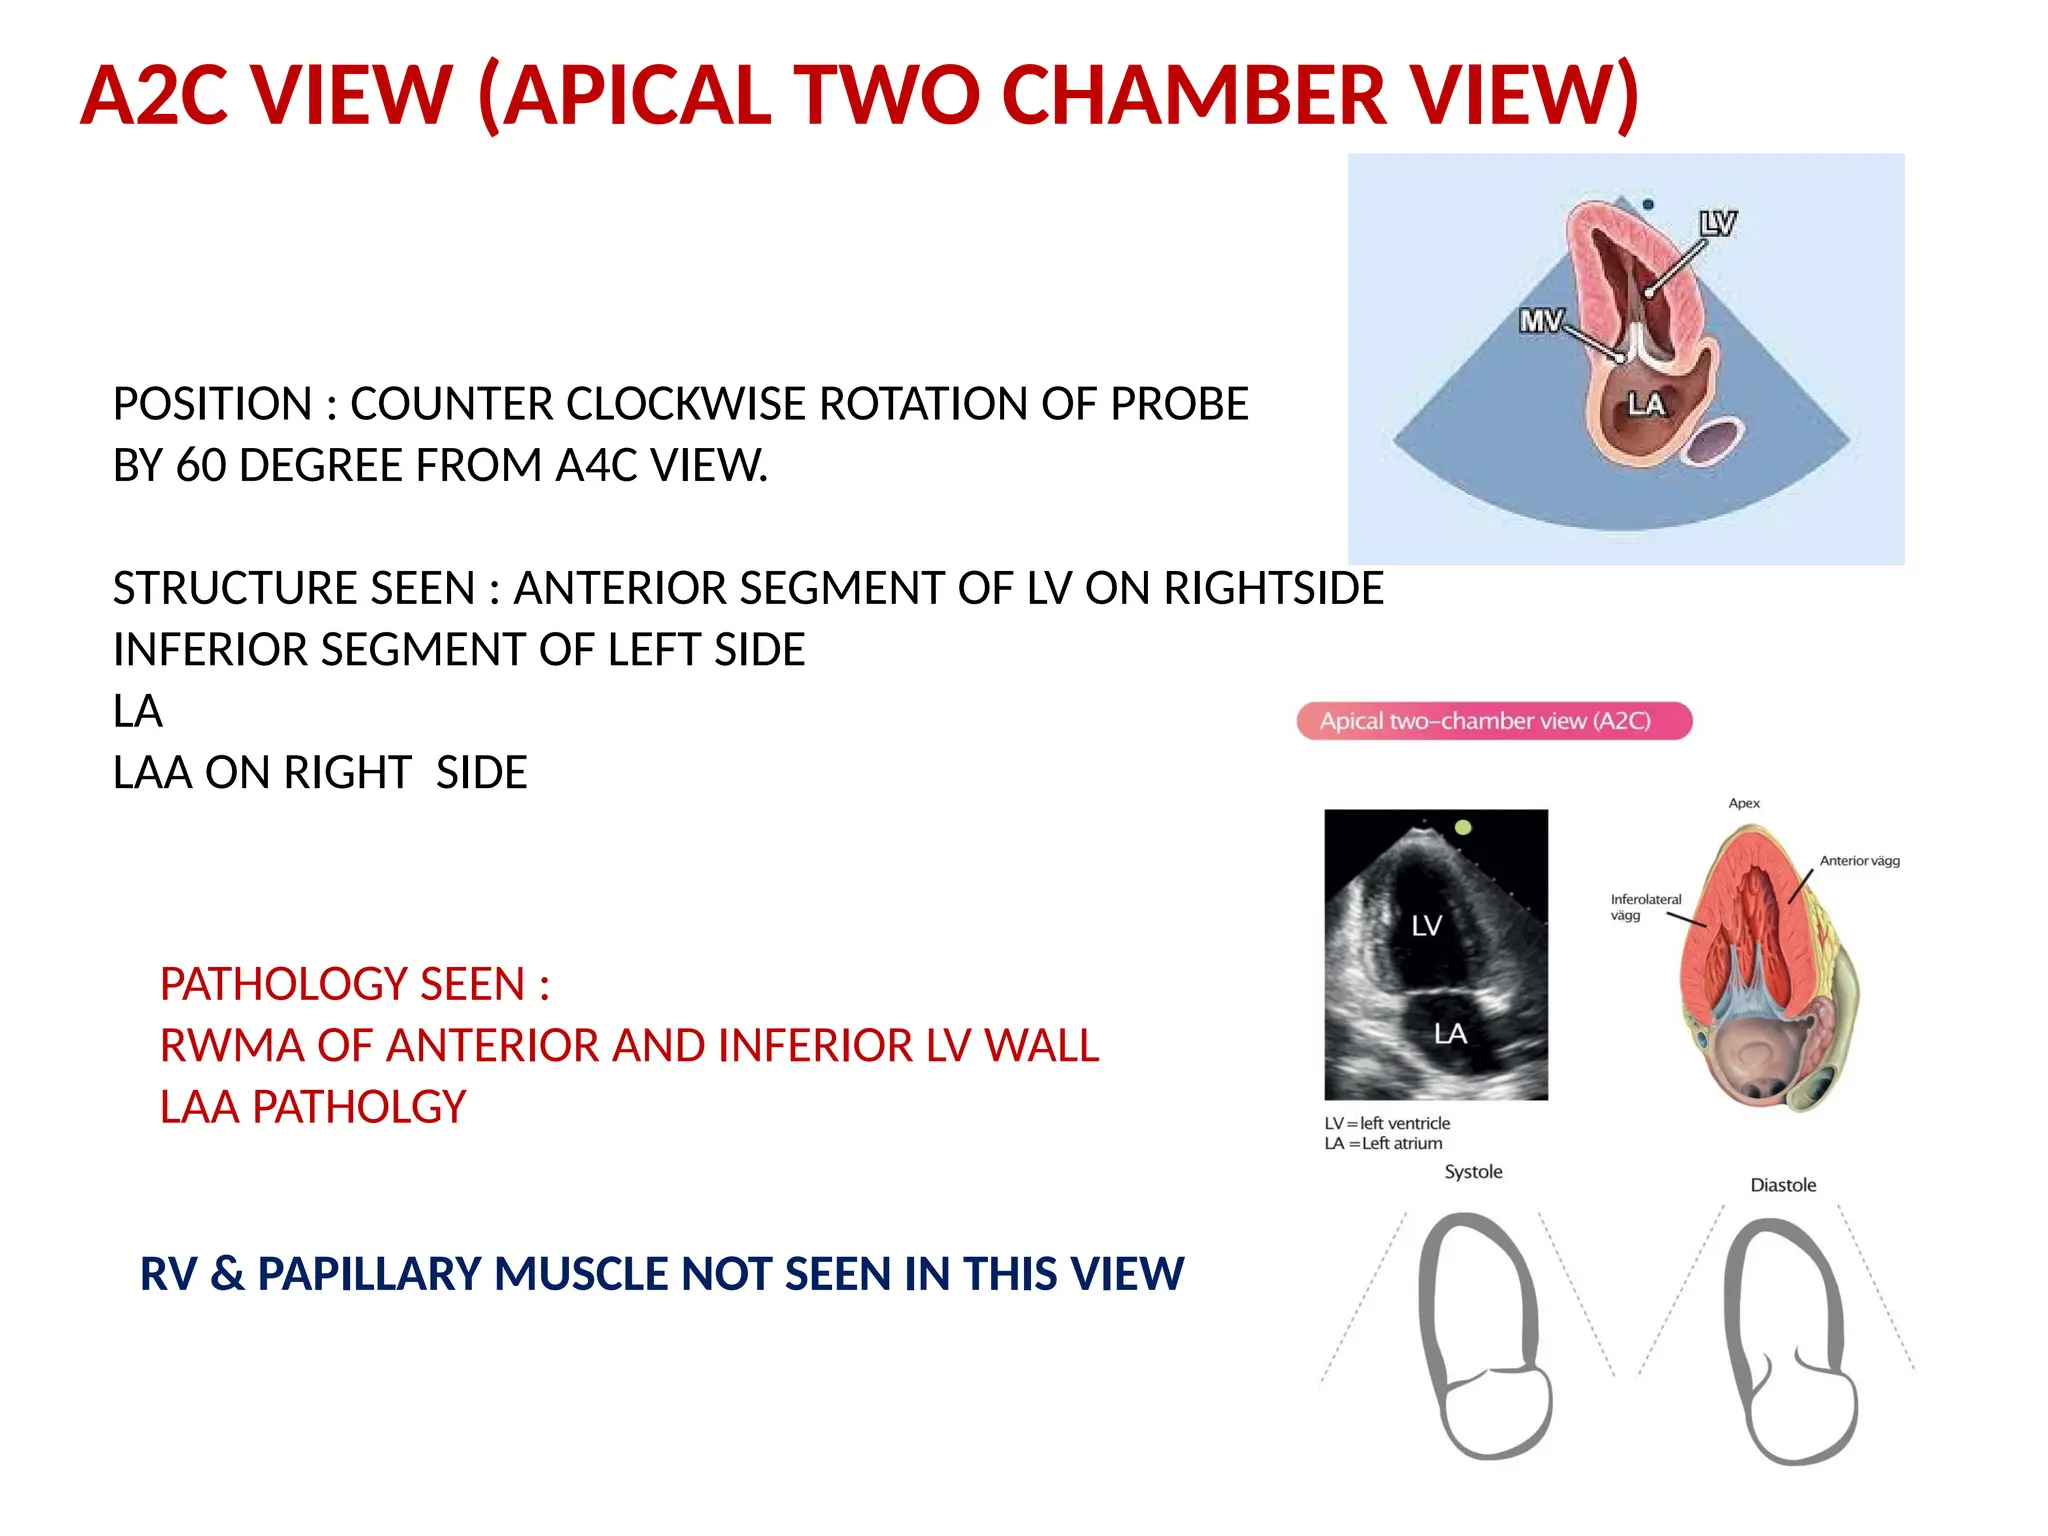
A2C VIEW (APICALTWO CHAMBER VIEW)
POSITION : COUNTER CLOCKWISE ROTATION OF PROBE
BY 60 DEGREE FROM A4C VIEW.
STRUCTURE SEEN : ANTERIOR SEGMENT OF LV ON RIGHTSIDE
INFERIOR SEGMENT OF LEFT SIDE
LA
LAA ON RIGHT SIDE
PATHOLOGY SEEN :
RWMA OF ANTERIOR AND INFERIOR LV WALL
LAA PATHOLGY
RV & PAPILLARY MUSCLE NOT SEEN IN THIS VIEW
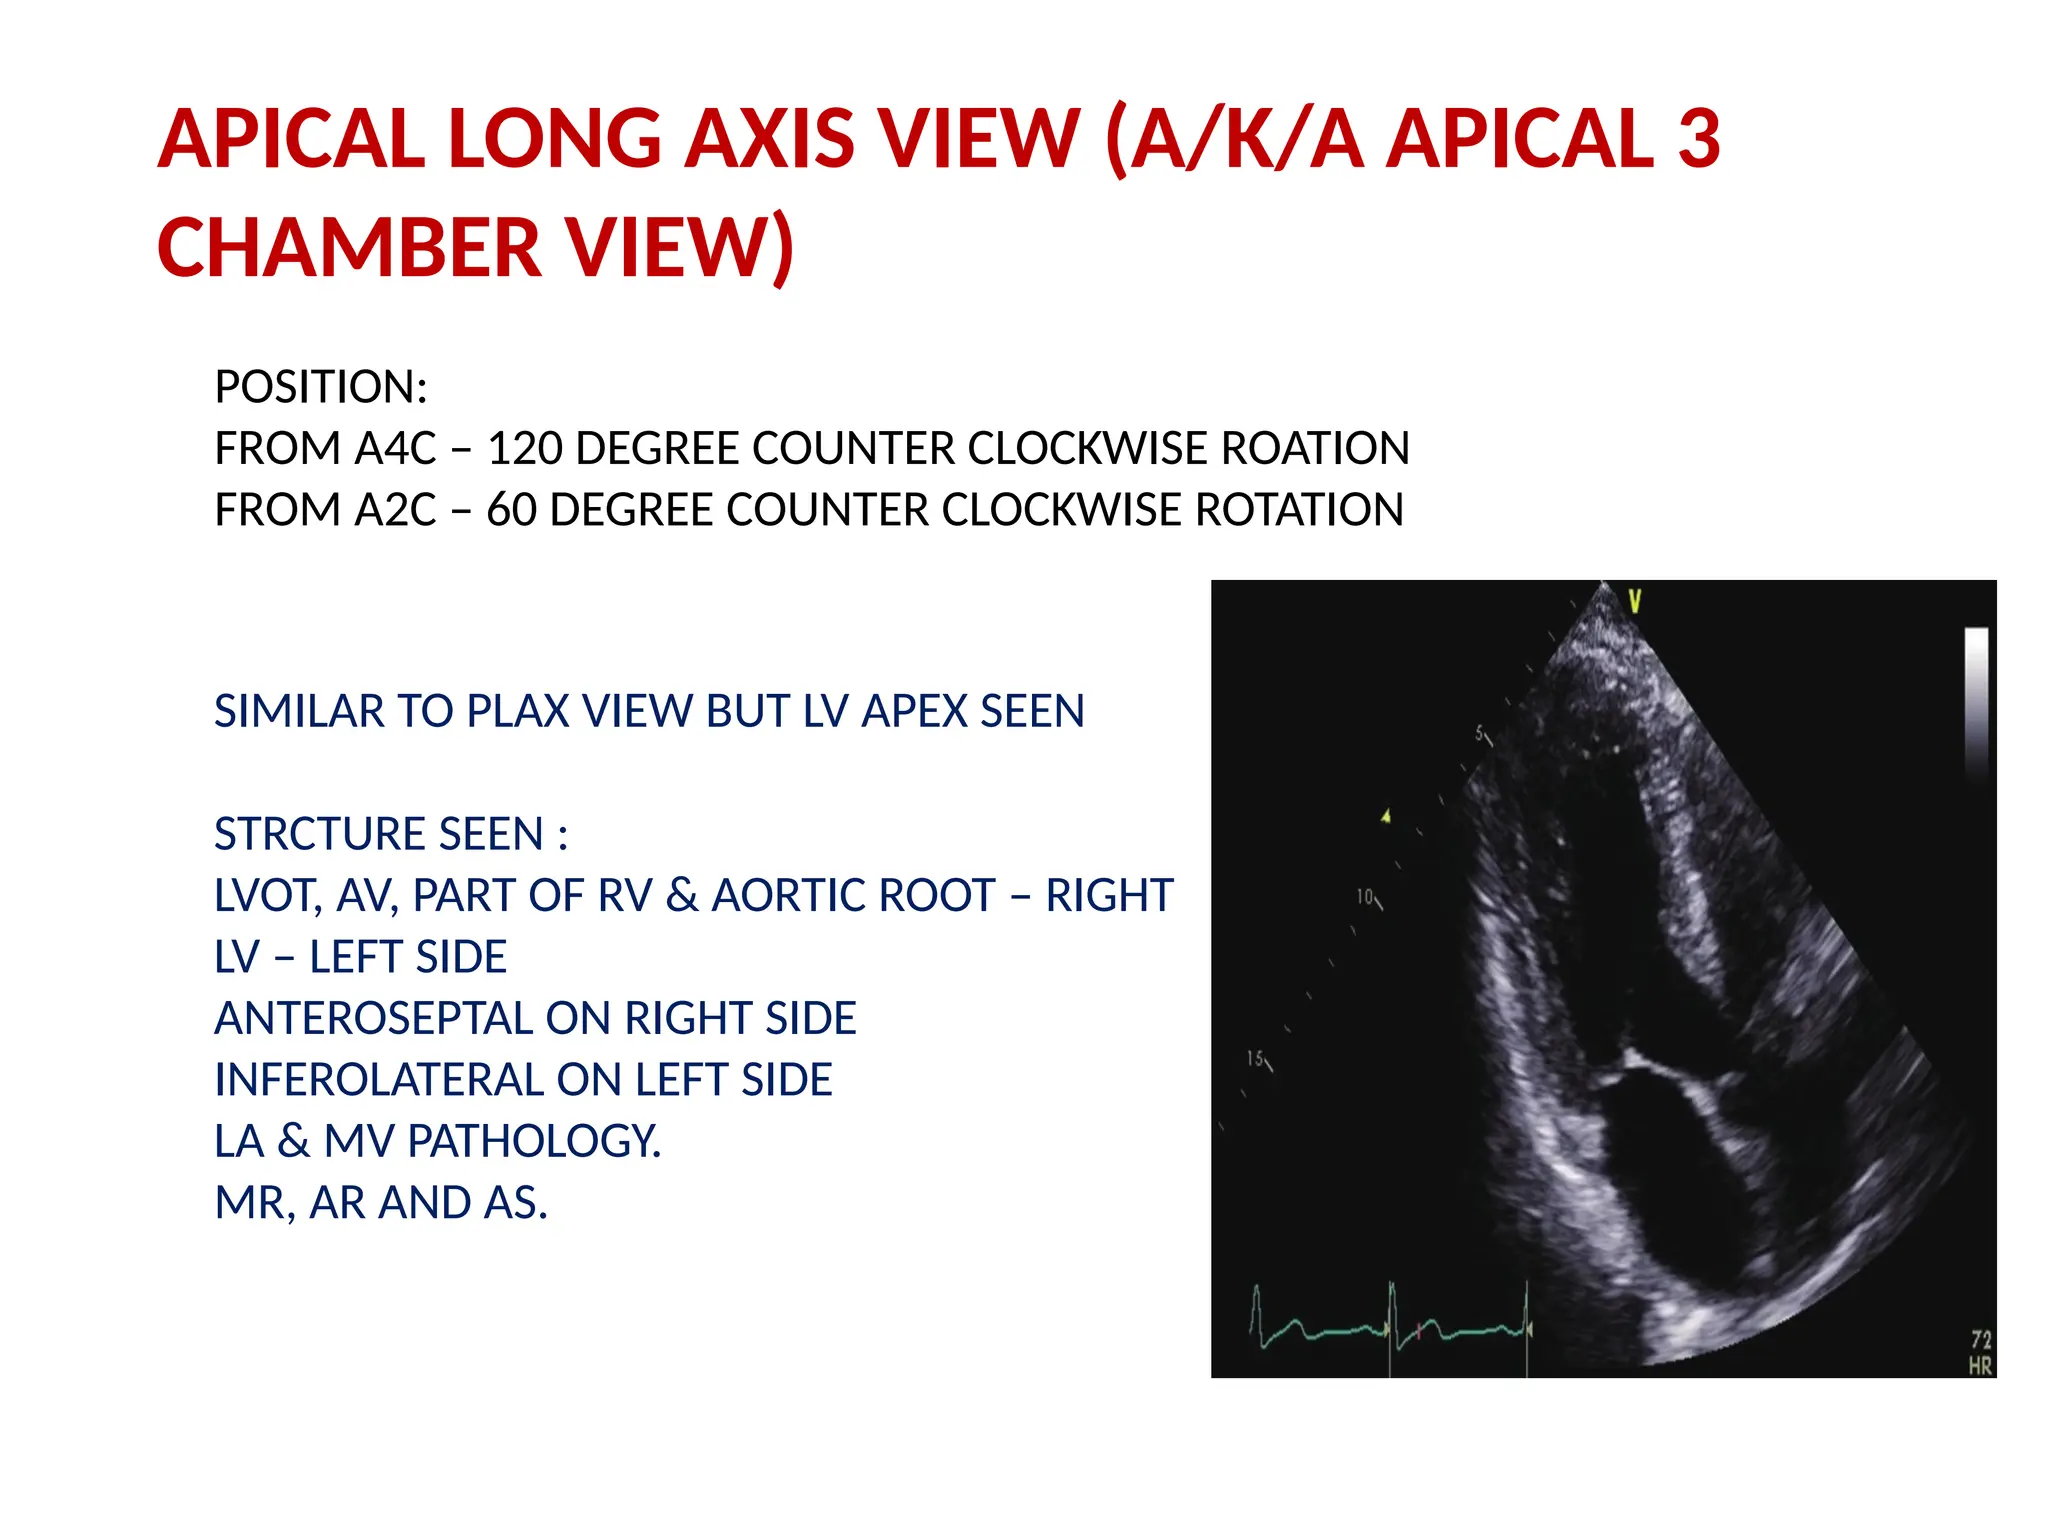
APICAL LONG AXISVIEW (A/K/A APICAL 3
CHAMBER VIEW)
POSITION:
FROM A4C – 120 DEGREE COUNTER CLOCKWISE ROATION
FROM A2C – 60 DEGREE COUNTER CLOCKWISE ROTATION
SIMILAR TO PLAX VIEW BUT LV APEX SEEN
STRCTURE SEEN :
LVOT, AV, PART OF RV & AORTIC ROOT – RIGHT
LV – LEFT SIDE
ANTEROSEPTAL ON RIGHT SIDE
INFEROLATERAL ON LEFT SIDE
LA & MV PATHOLOGY.
MR, AR AND AS.
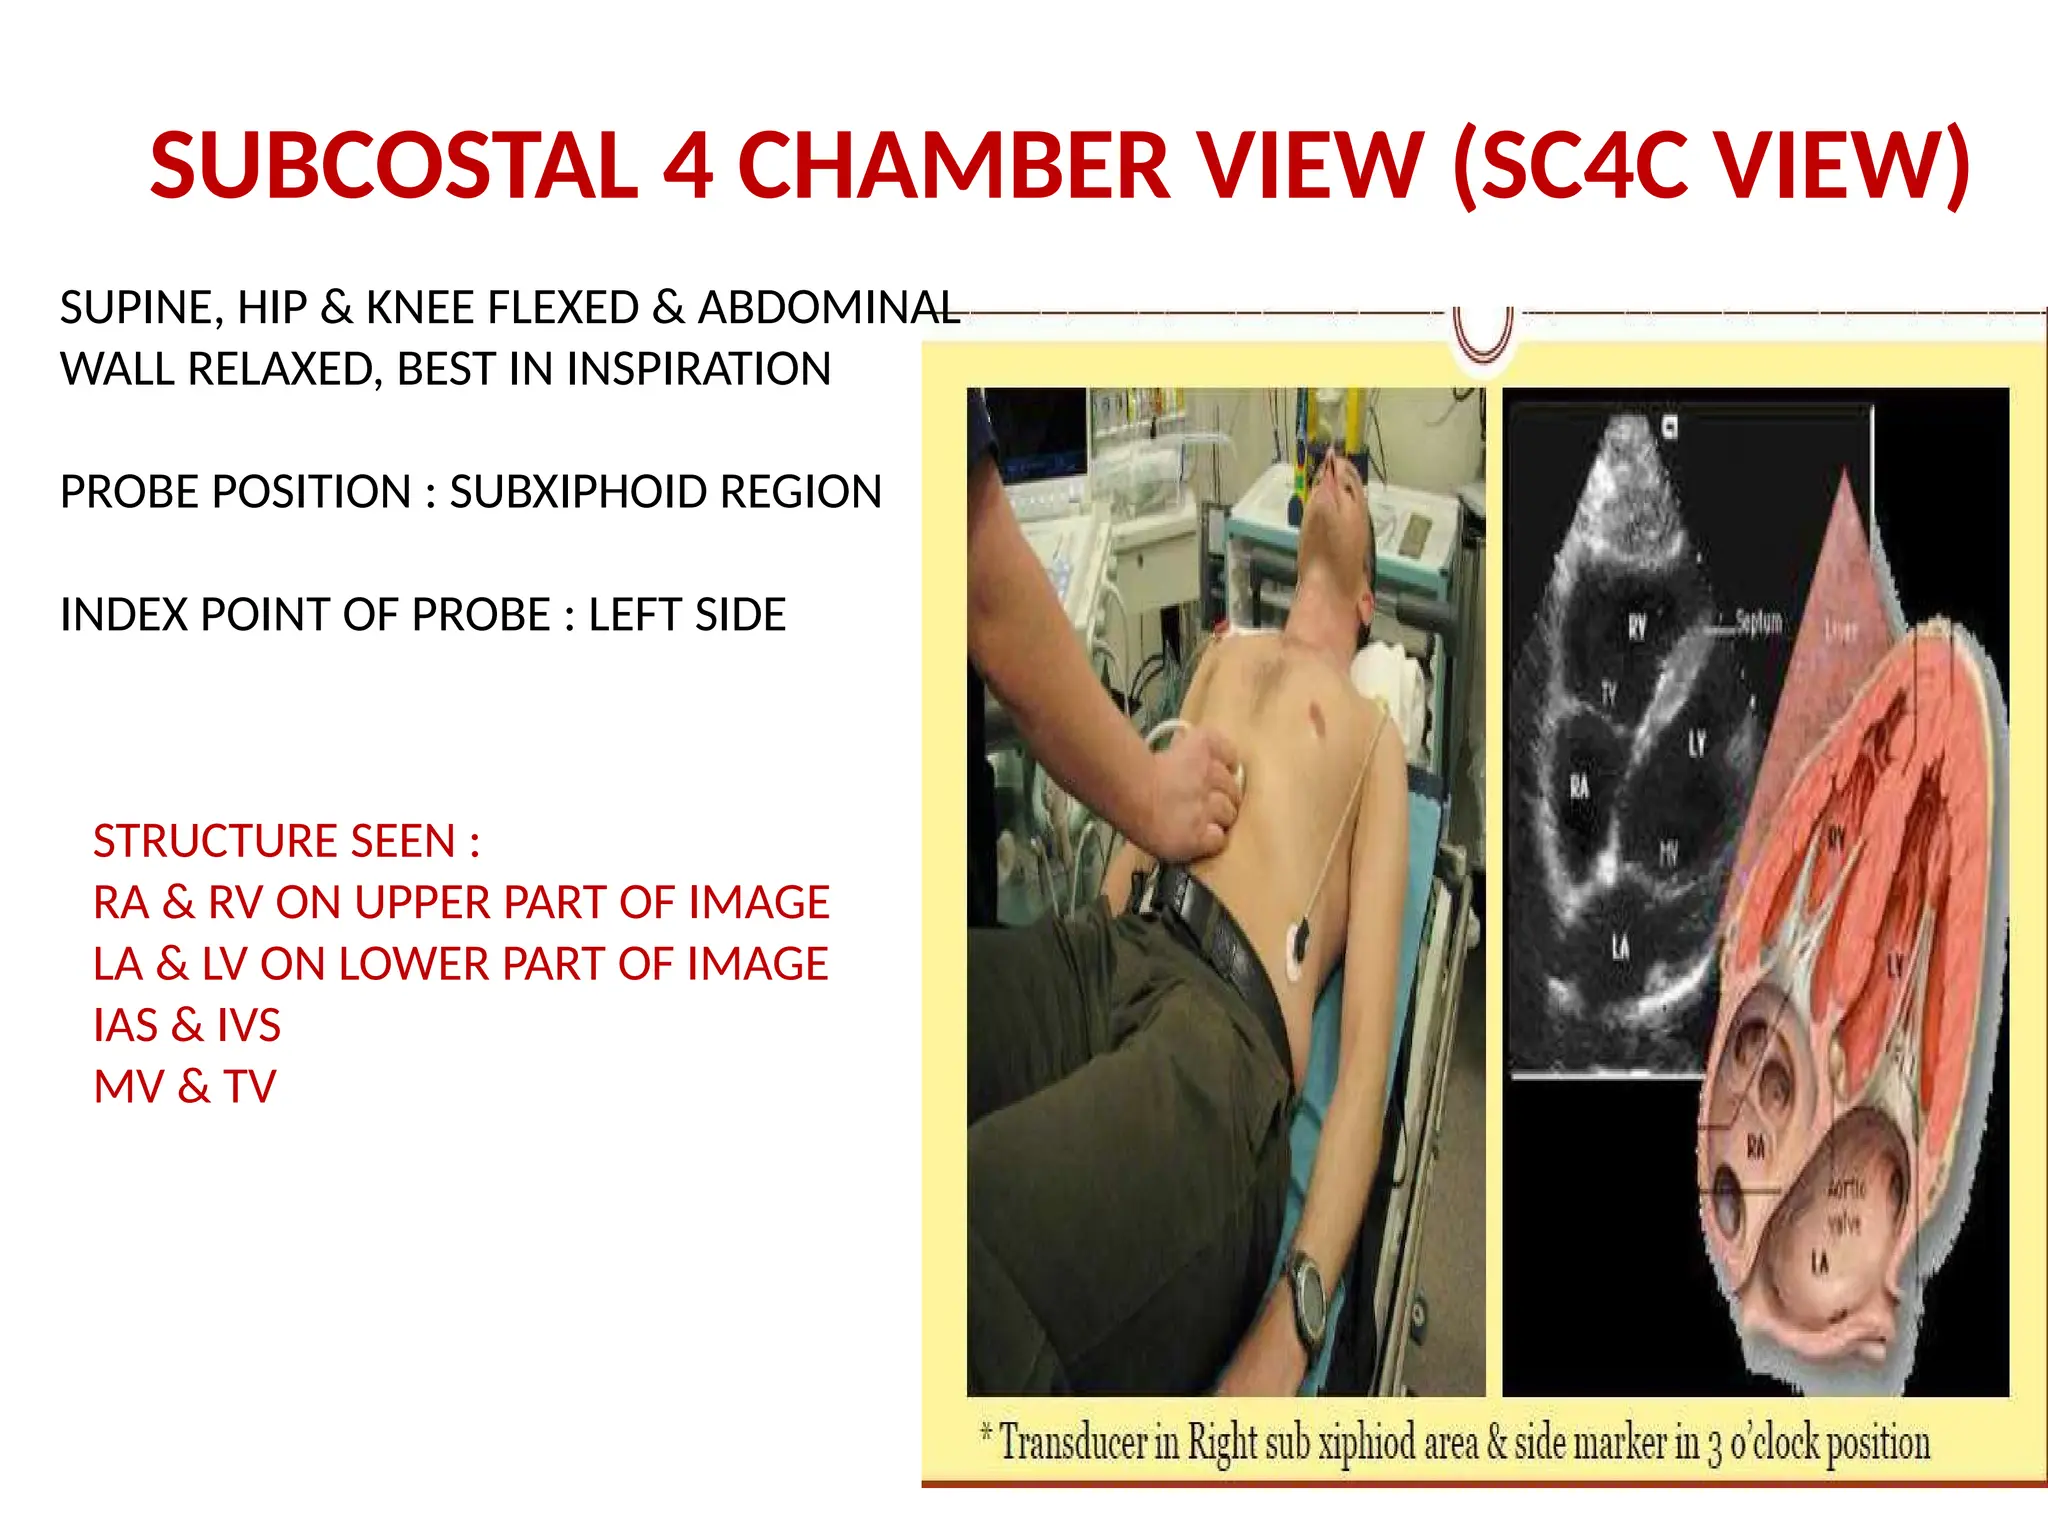
SUPINE, HIP &KNEE FLEXED & ABDOMINAL
WALL RELAXED, BEST IN INSPIRATION
PROBE POSITION : SUBXIPHOID REGION
INDEX POINT OF PROBE : LEFT SIDE
STRUCTURE SEEN :
RA & RV ON UPPER PART OF IMAGE
LA & LV ON LOWER PART OF IMAGE
IAS & IVS
MV & TV
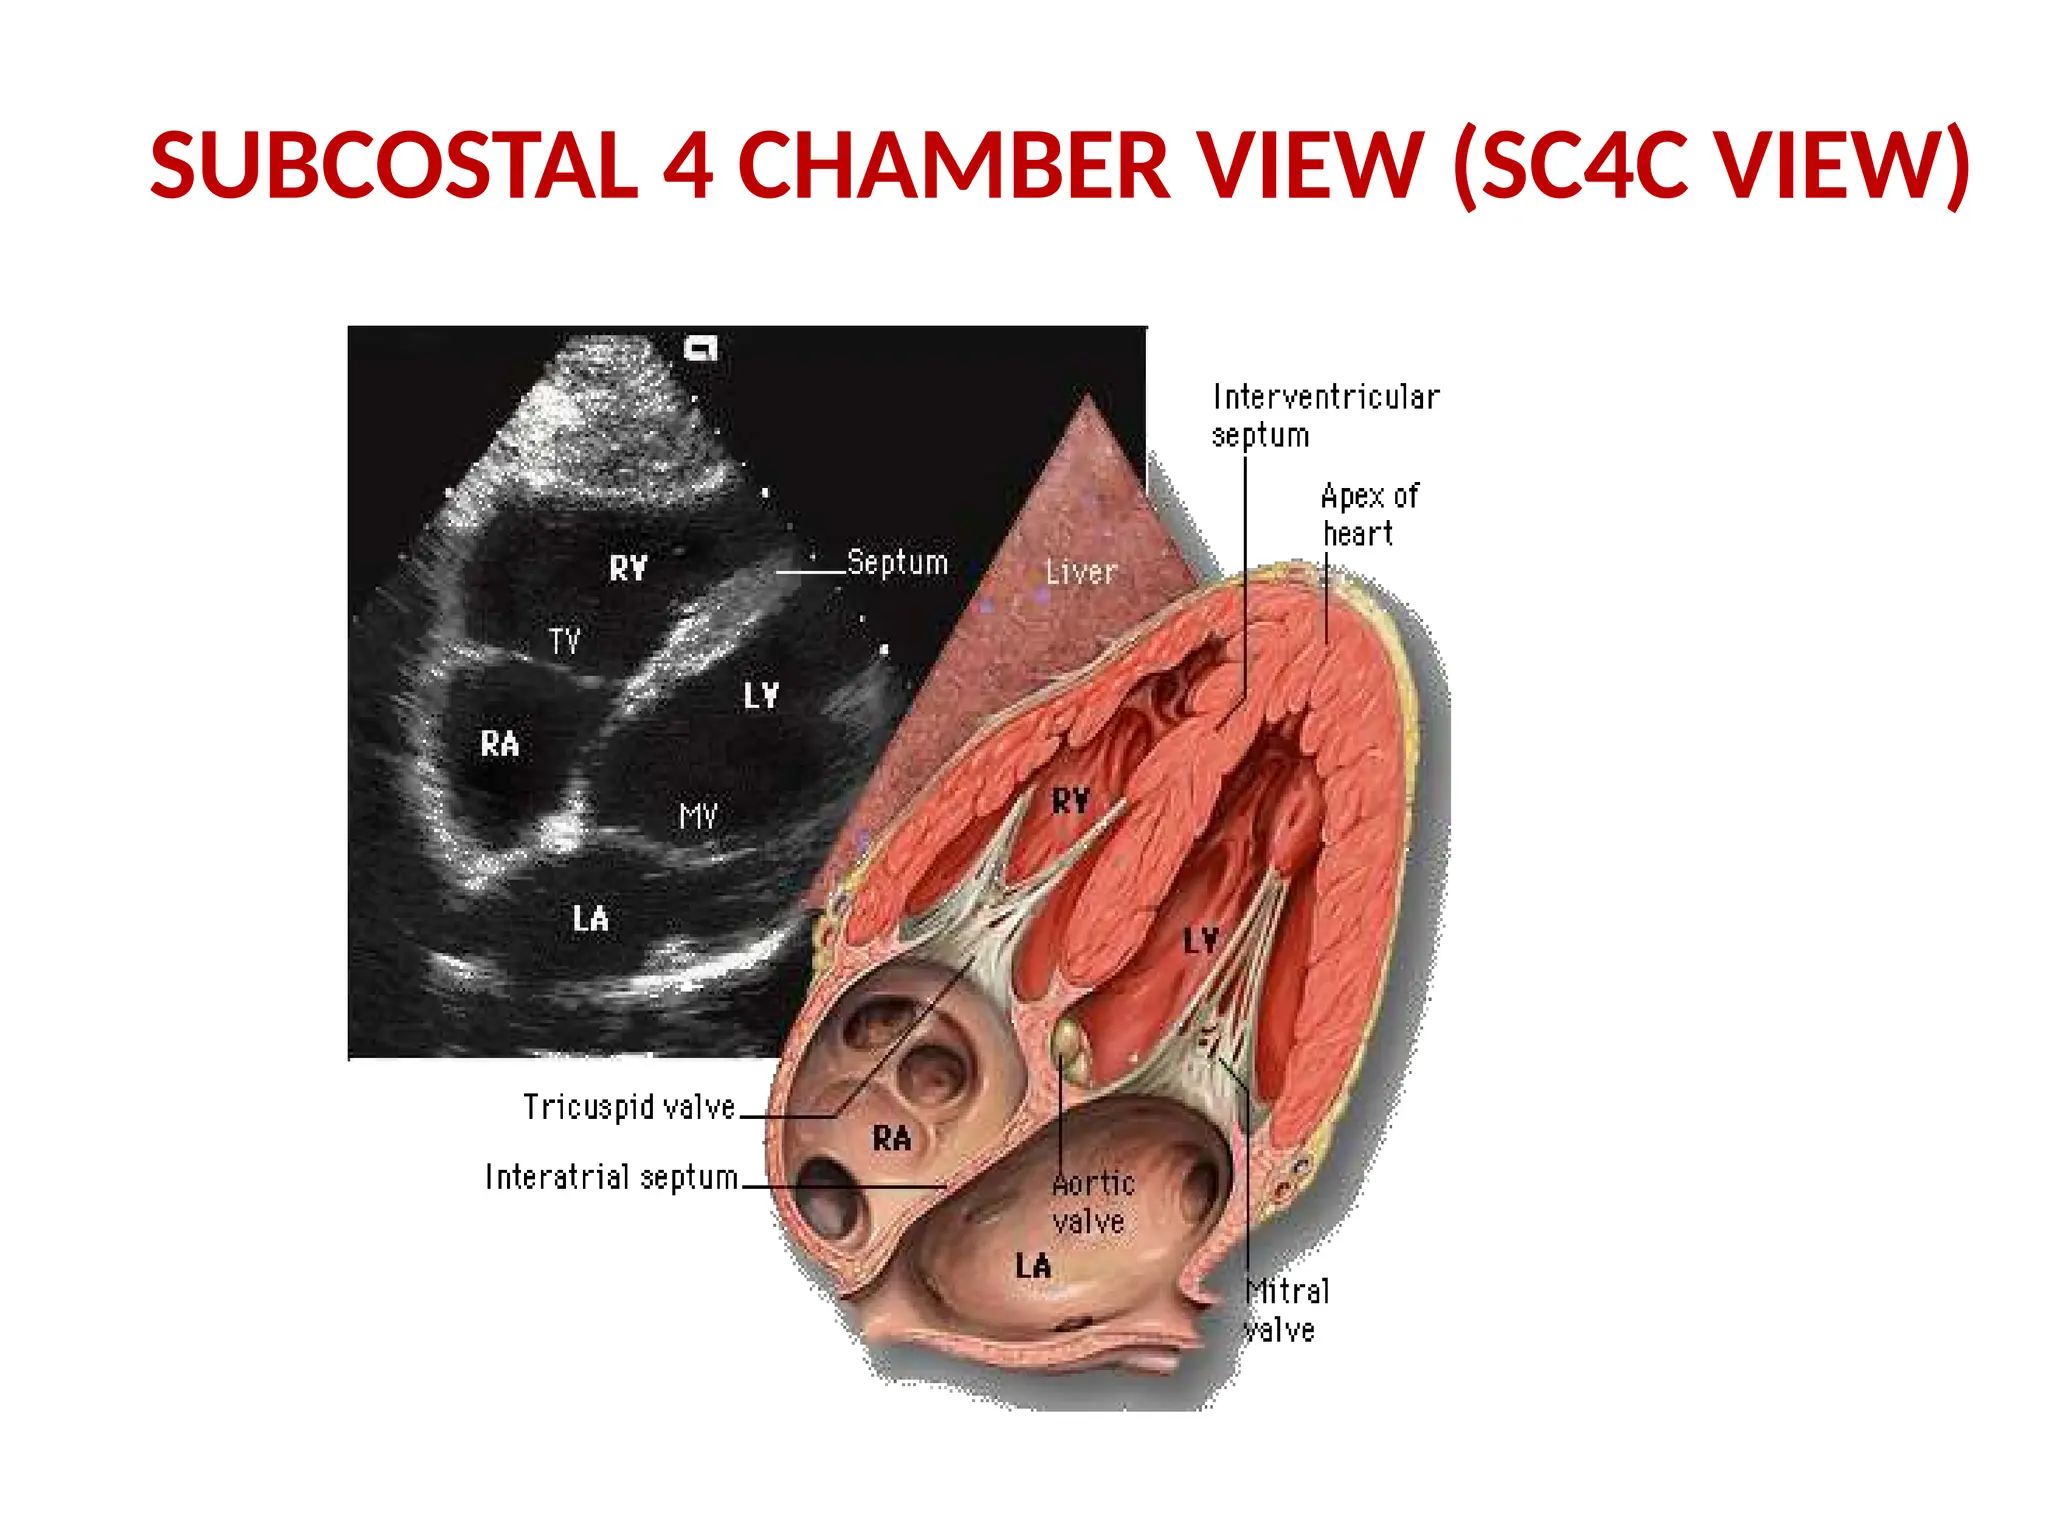
SUBCOSTAL 4 CHAMBER VIEW (SC4C VIEW)
60.
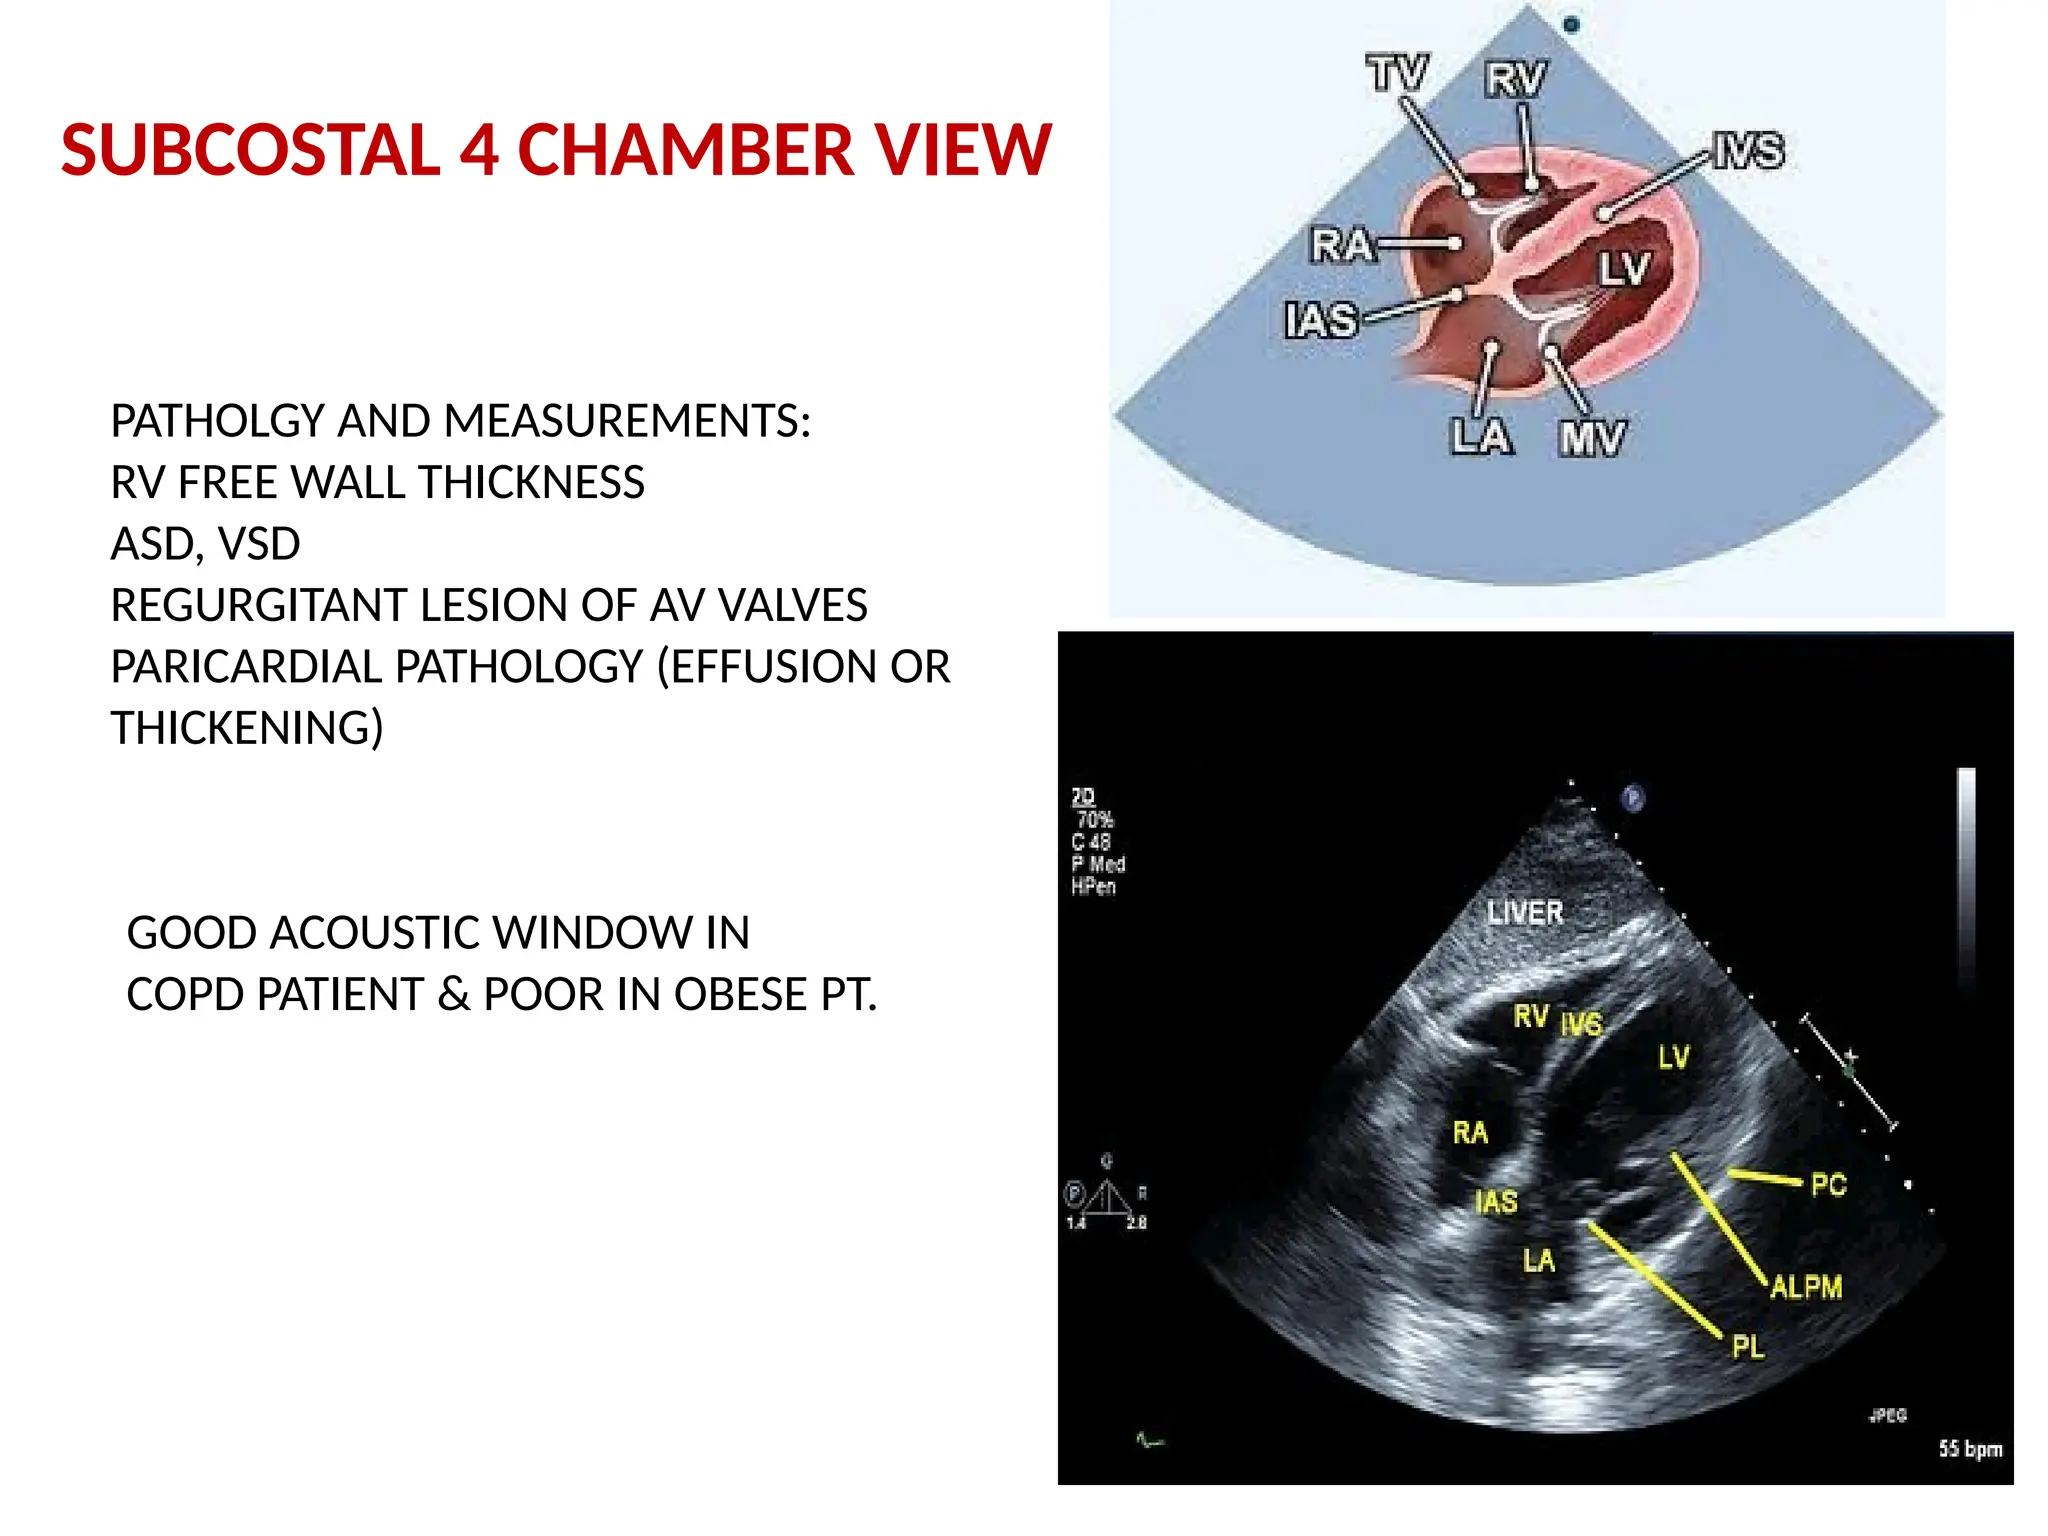
SUBCOSTAL 4 CHAMBERVIEW
PATHOLGY AND MEASUREMENTS:
RV FREE WALL THICKNESS
ASD, VSD
REGURGITANT LESION OF AV VALVES
PARICARDIAL PATHOLOGY (EFFUSION OR
THICKENING)
GOOD ACOUSTIC WINDOW IN
COPD PATIENT & POOR IN OBESE PT.
61.
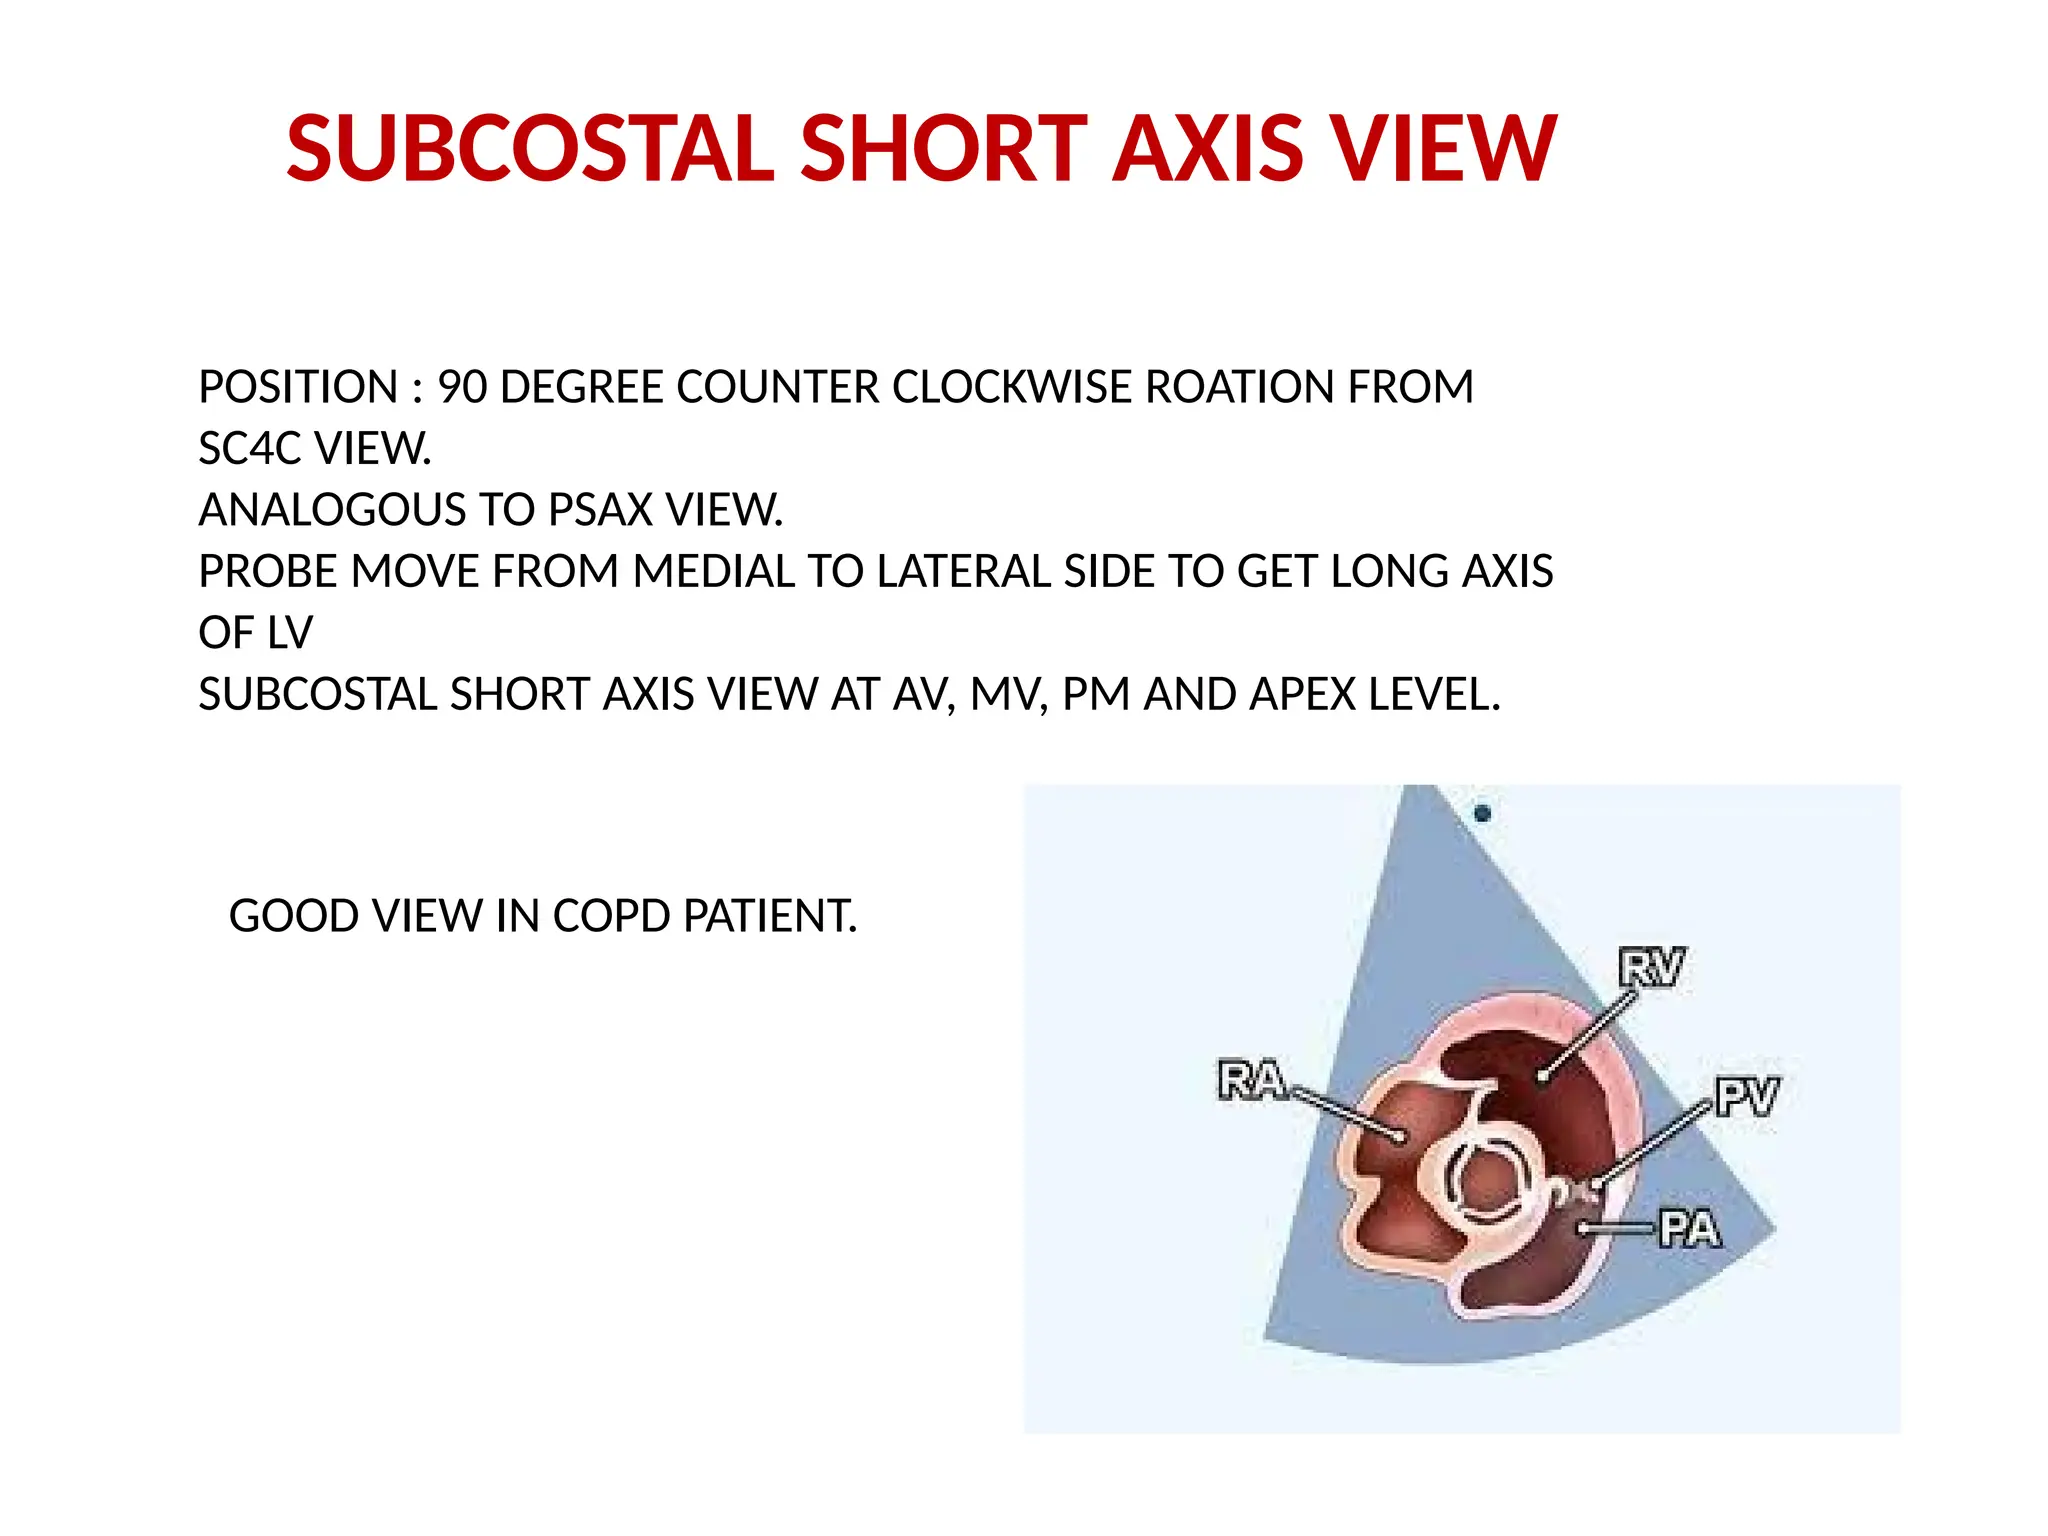
SUBCOSTAL SHORT AXISVIEW
POSITION : 90 DEGREE COUNTER CLOCKWISE ROATION FROM
SC4C VIEW.
ANALOGOUS TO PSAX VIEW.
PROBE MOVE FROM MEDIAL TO LATERAL SIDE TO GET LONG AXIS
OF LV
SUBCOSTAL SHORT AXIS VIEW AT AV, MV, PM AND APEX LEVEL.
GOOD VIEW IN COPD PATIENT.
62.
SUBCOSTAL VIEW OFIVC
POSITON : SUBXIPHOID REGION
INDEX POINT OF PROBE : SUPERIORLY
ULTRASOUND BEAM : POSTERIOR & RIGHT
IVC : THIN WALLED, COLLAPSIBLE WITH
INSPIRATION & NON-PULSATILE NATURE.
PATHOLOGY :
SYSTOLIC FLOW REVERSAL IN IVC IN SEVERE
TR
DISTENDED, NON-COLLAPSING IVC IN TS
THROMBUS IN IVC CAN BE SEEN
63.
SUBCOSTAL VIEW OFTHE ABDOMINAL AORTA
PROBE POSITION : LEFTWARD TO IVC PROBE POSITION.
PATHOLOGY OF ABDOMINAL AORTA :
ANEURYSM, DISEECTION OR PLAQUE.
DIASTOLIC FLOW REVERSAL IN SEVERE AR
CONTINUOUS FORWARD FLOW THROUGHOUT CARDIAC CYCLE S/O SEVERE COA.
64.
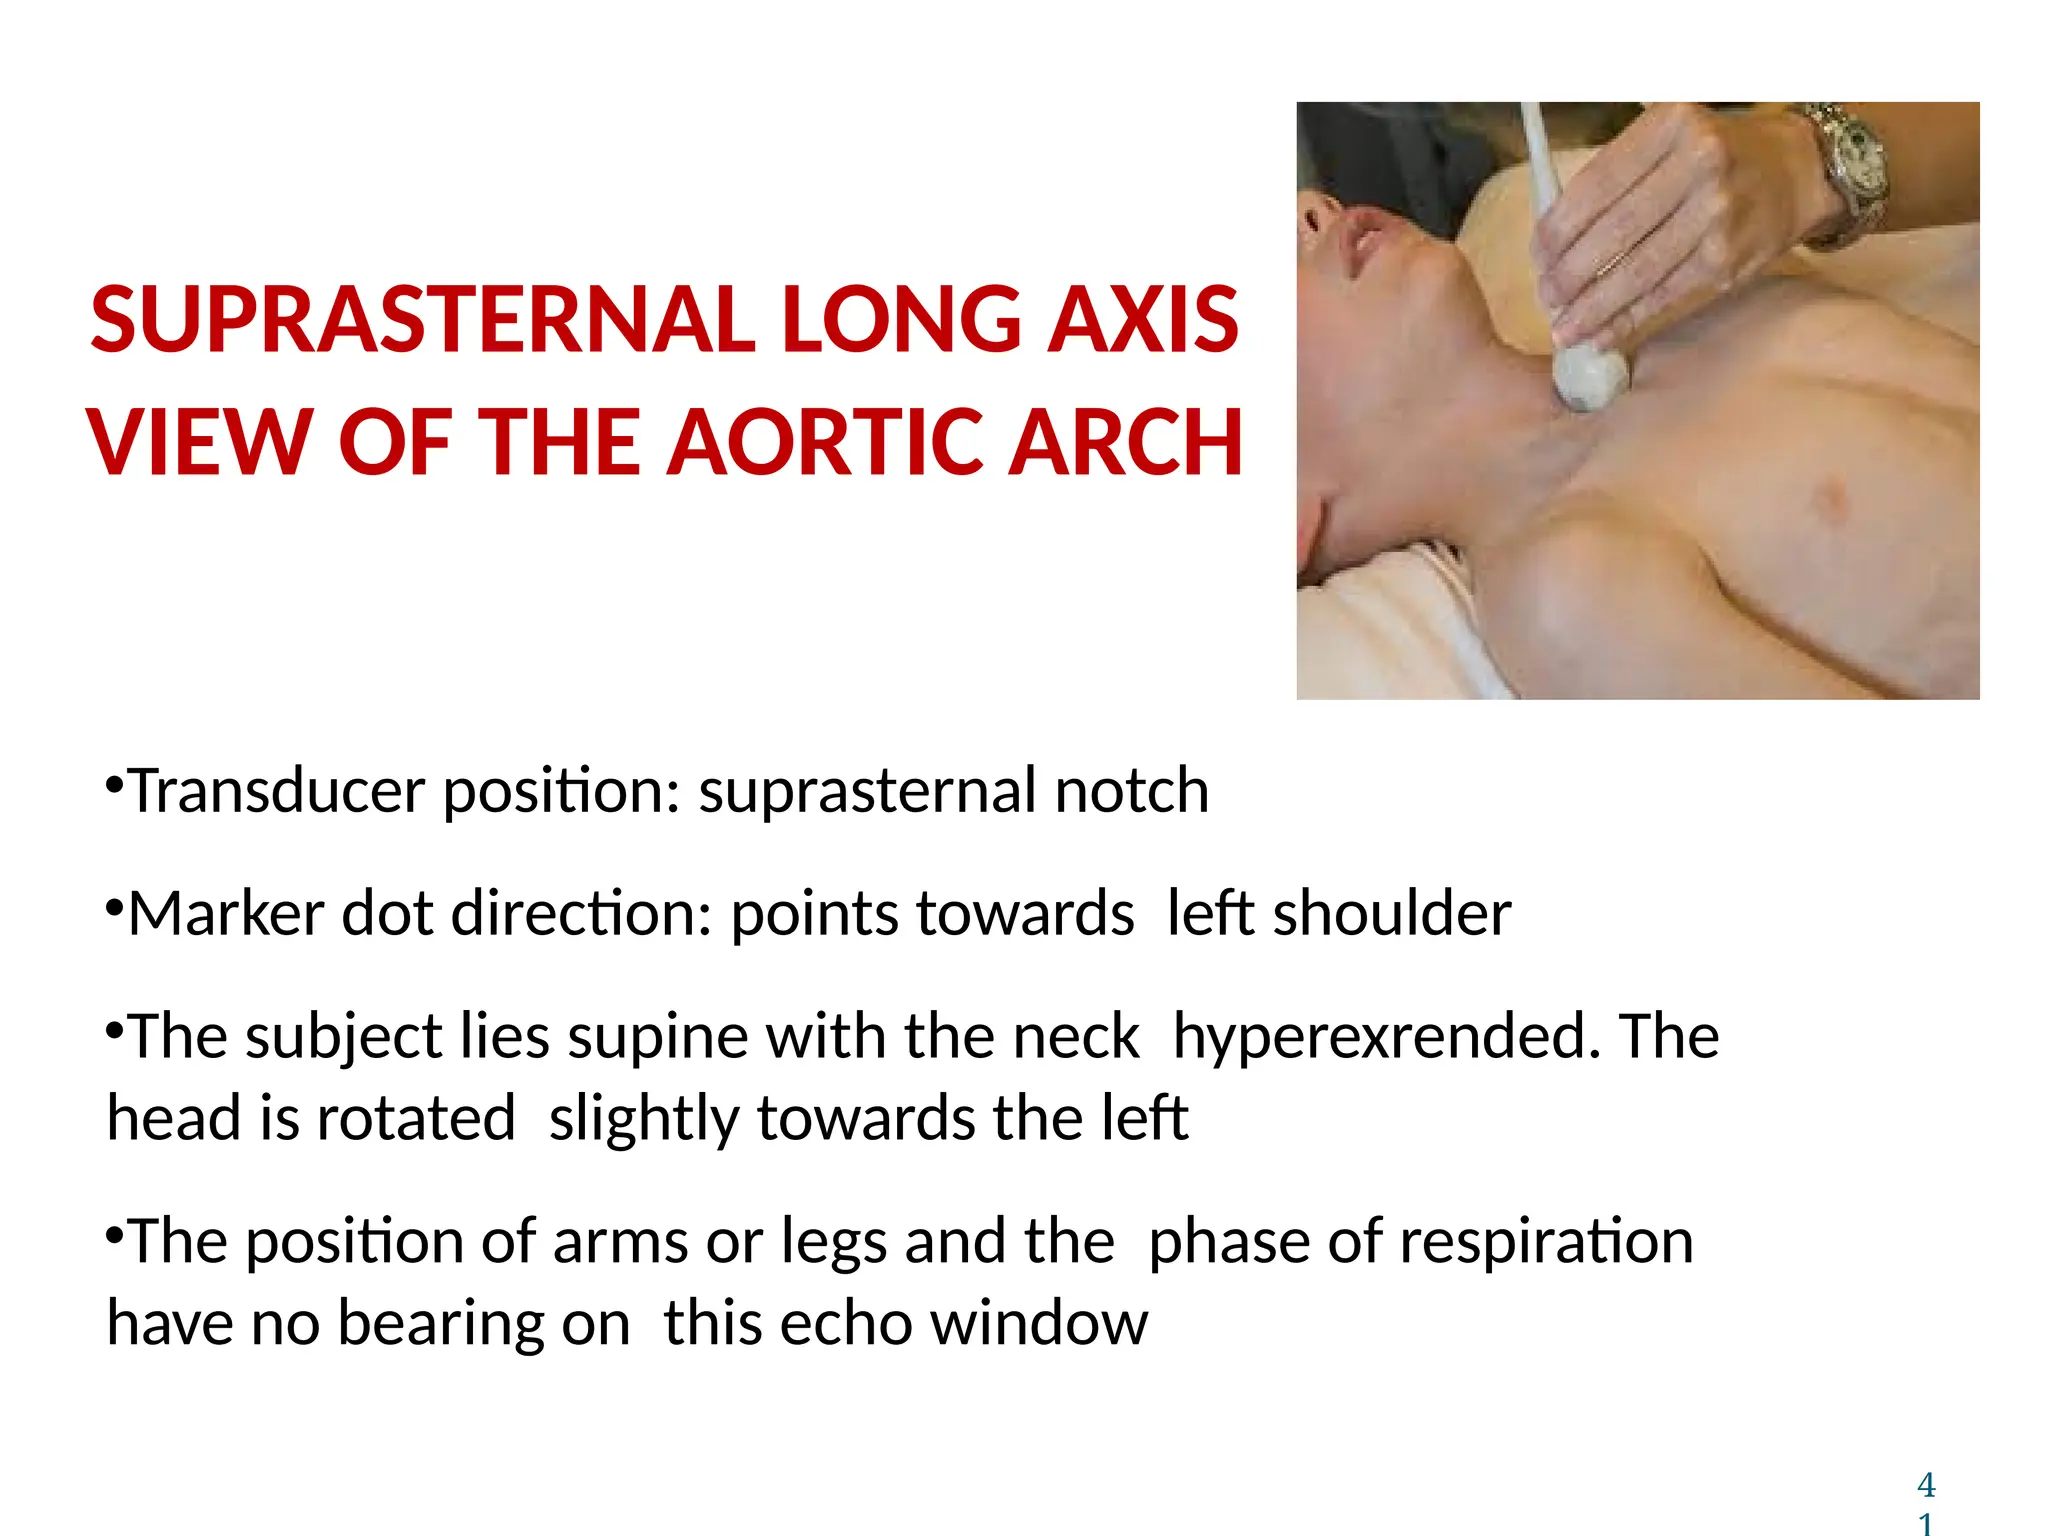
•Transducer position: suprasternalnotch
•Marker dot direction: points towards left shoulder
•The subject lies supine with the neck hyperexrended. The
head is rotated slightly towards the left
•The position of arms or legs and the phase of respiration
have no bearing on this echo window
4
SUPRASTERNAL LONG AXIS
VIEW OF THE AORTIC ARCH
65.
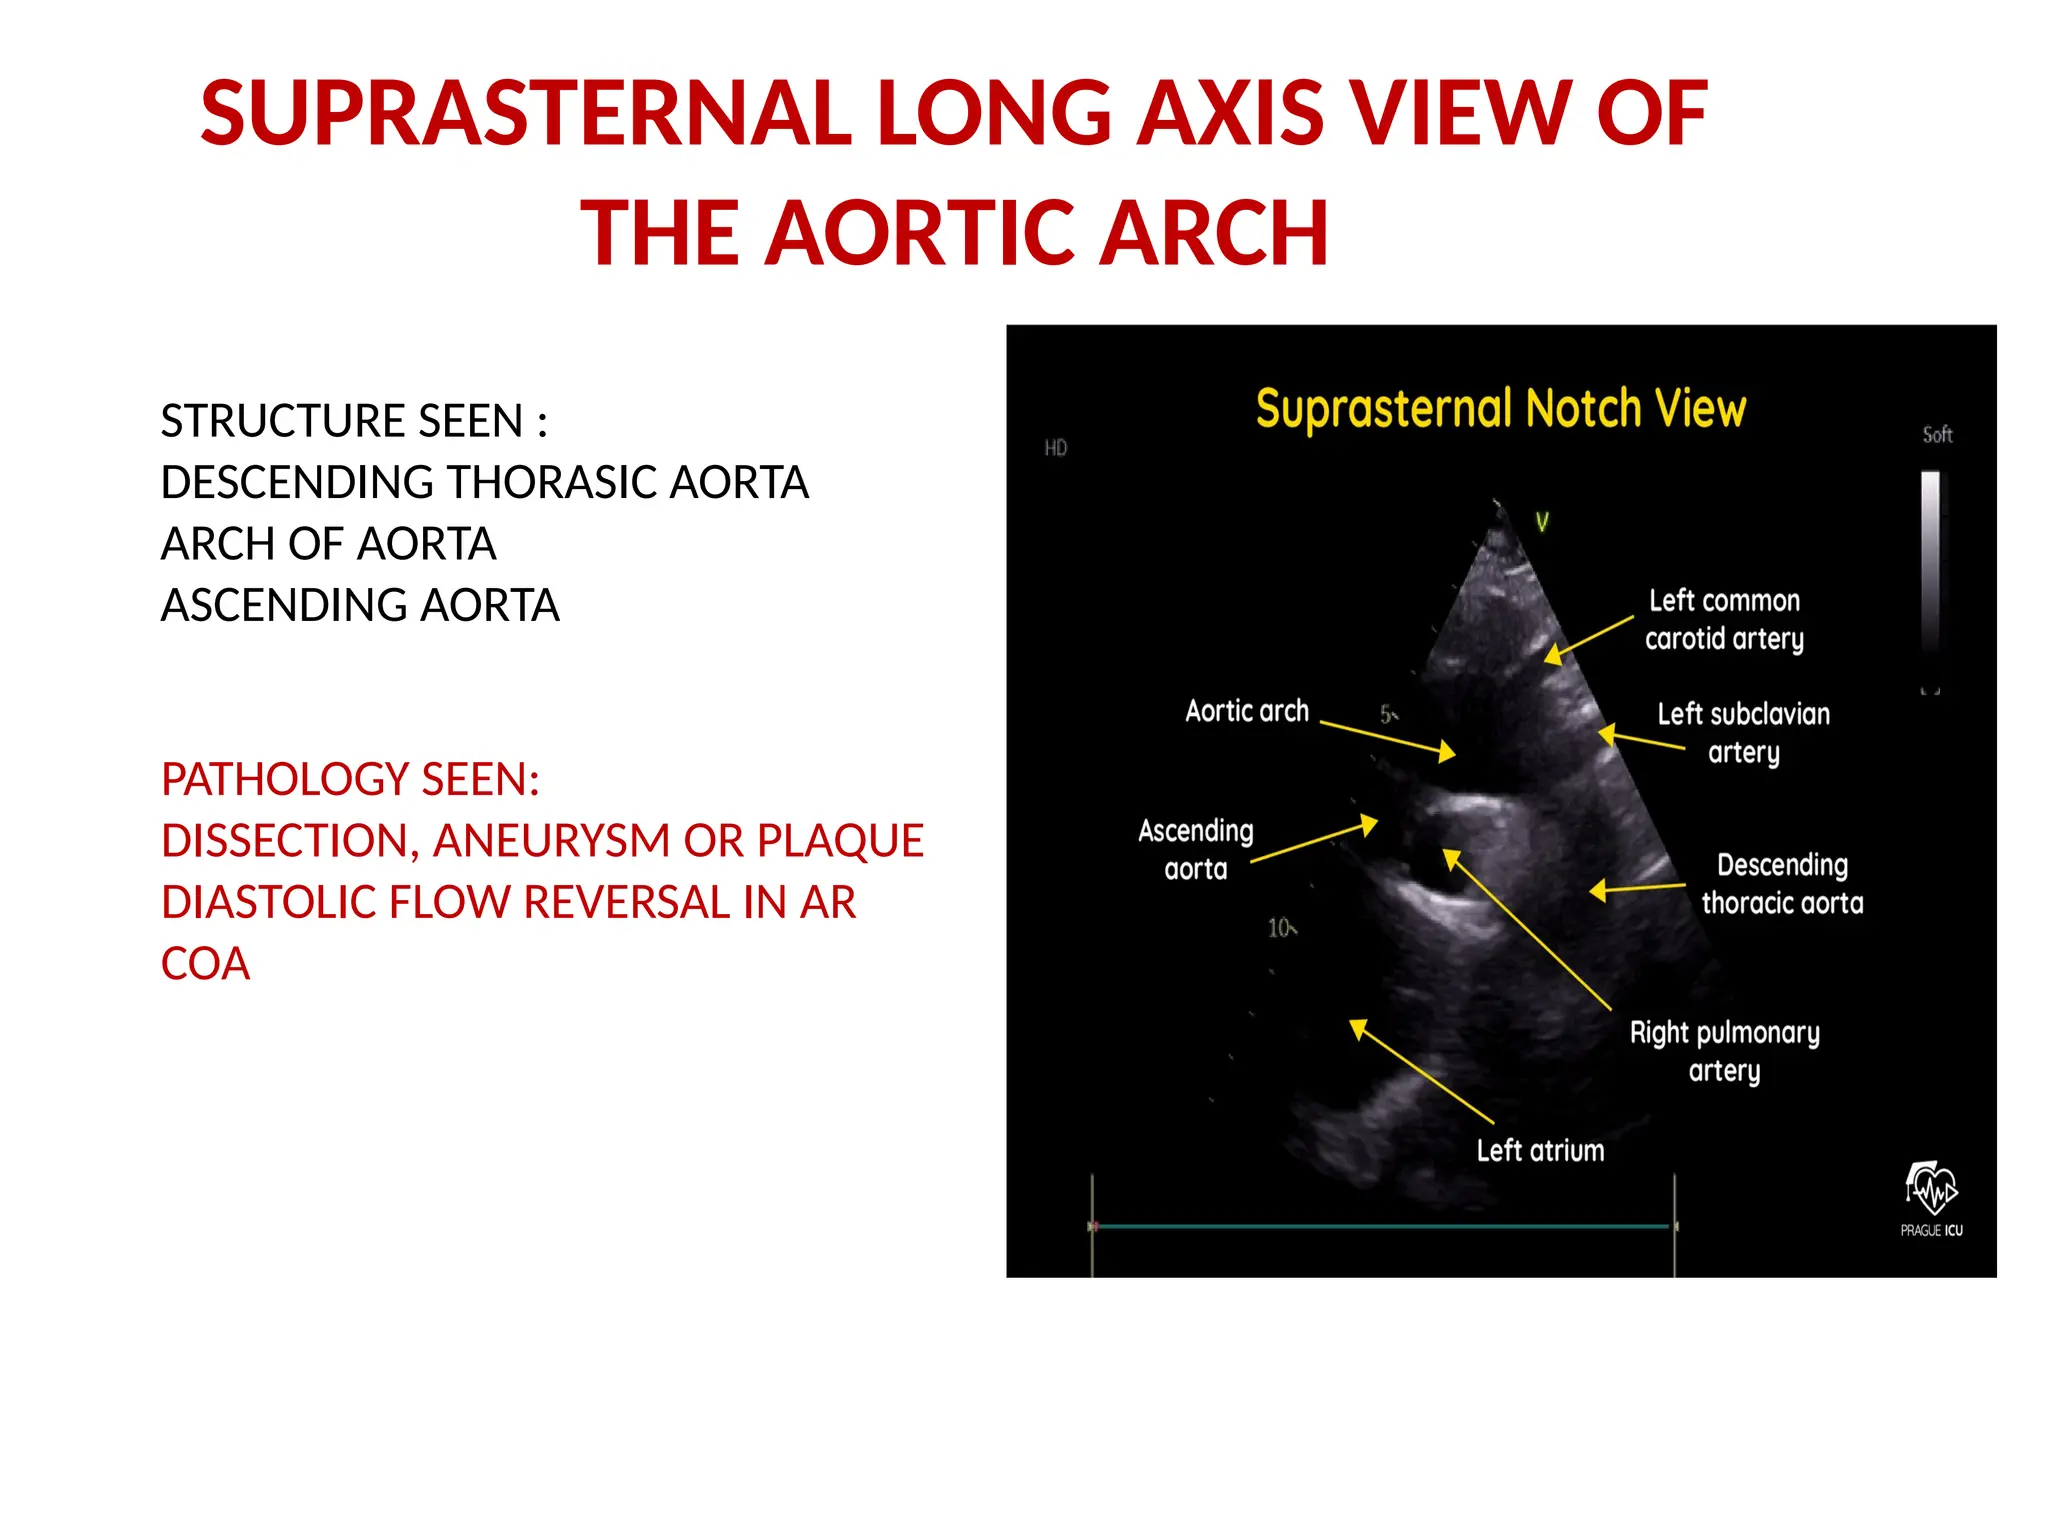
SUPRASTERNAL LONG AXISVIEW OF
THE AORTIC ARCH
STRUCTURE SEEN :
DESCENDING THORASIC AORTA
ARCH OF AORTA
ASCENDING AORTA
PATHOLOGY SEEN:
DISSECTION, ANEURYSM OR PLAQUE
DIASTOLIC FLOW REVERSAL IN AR
COA
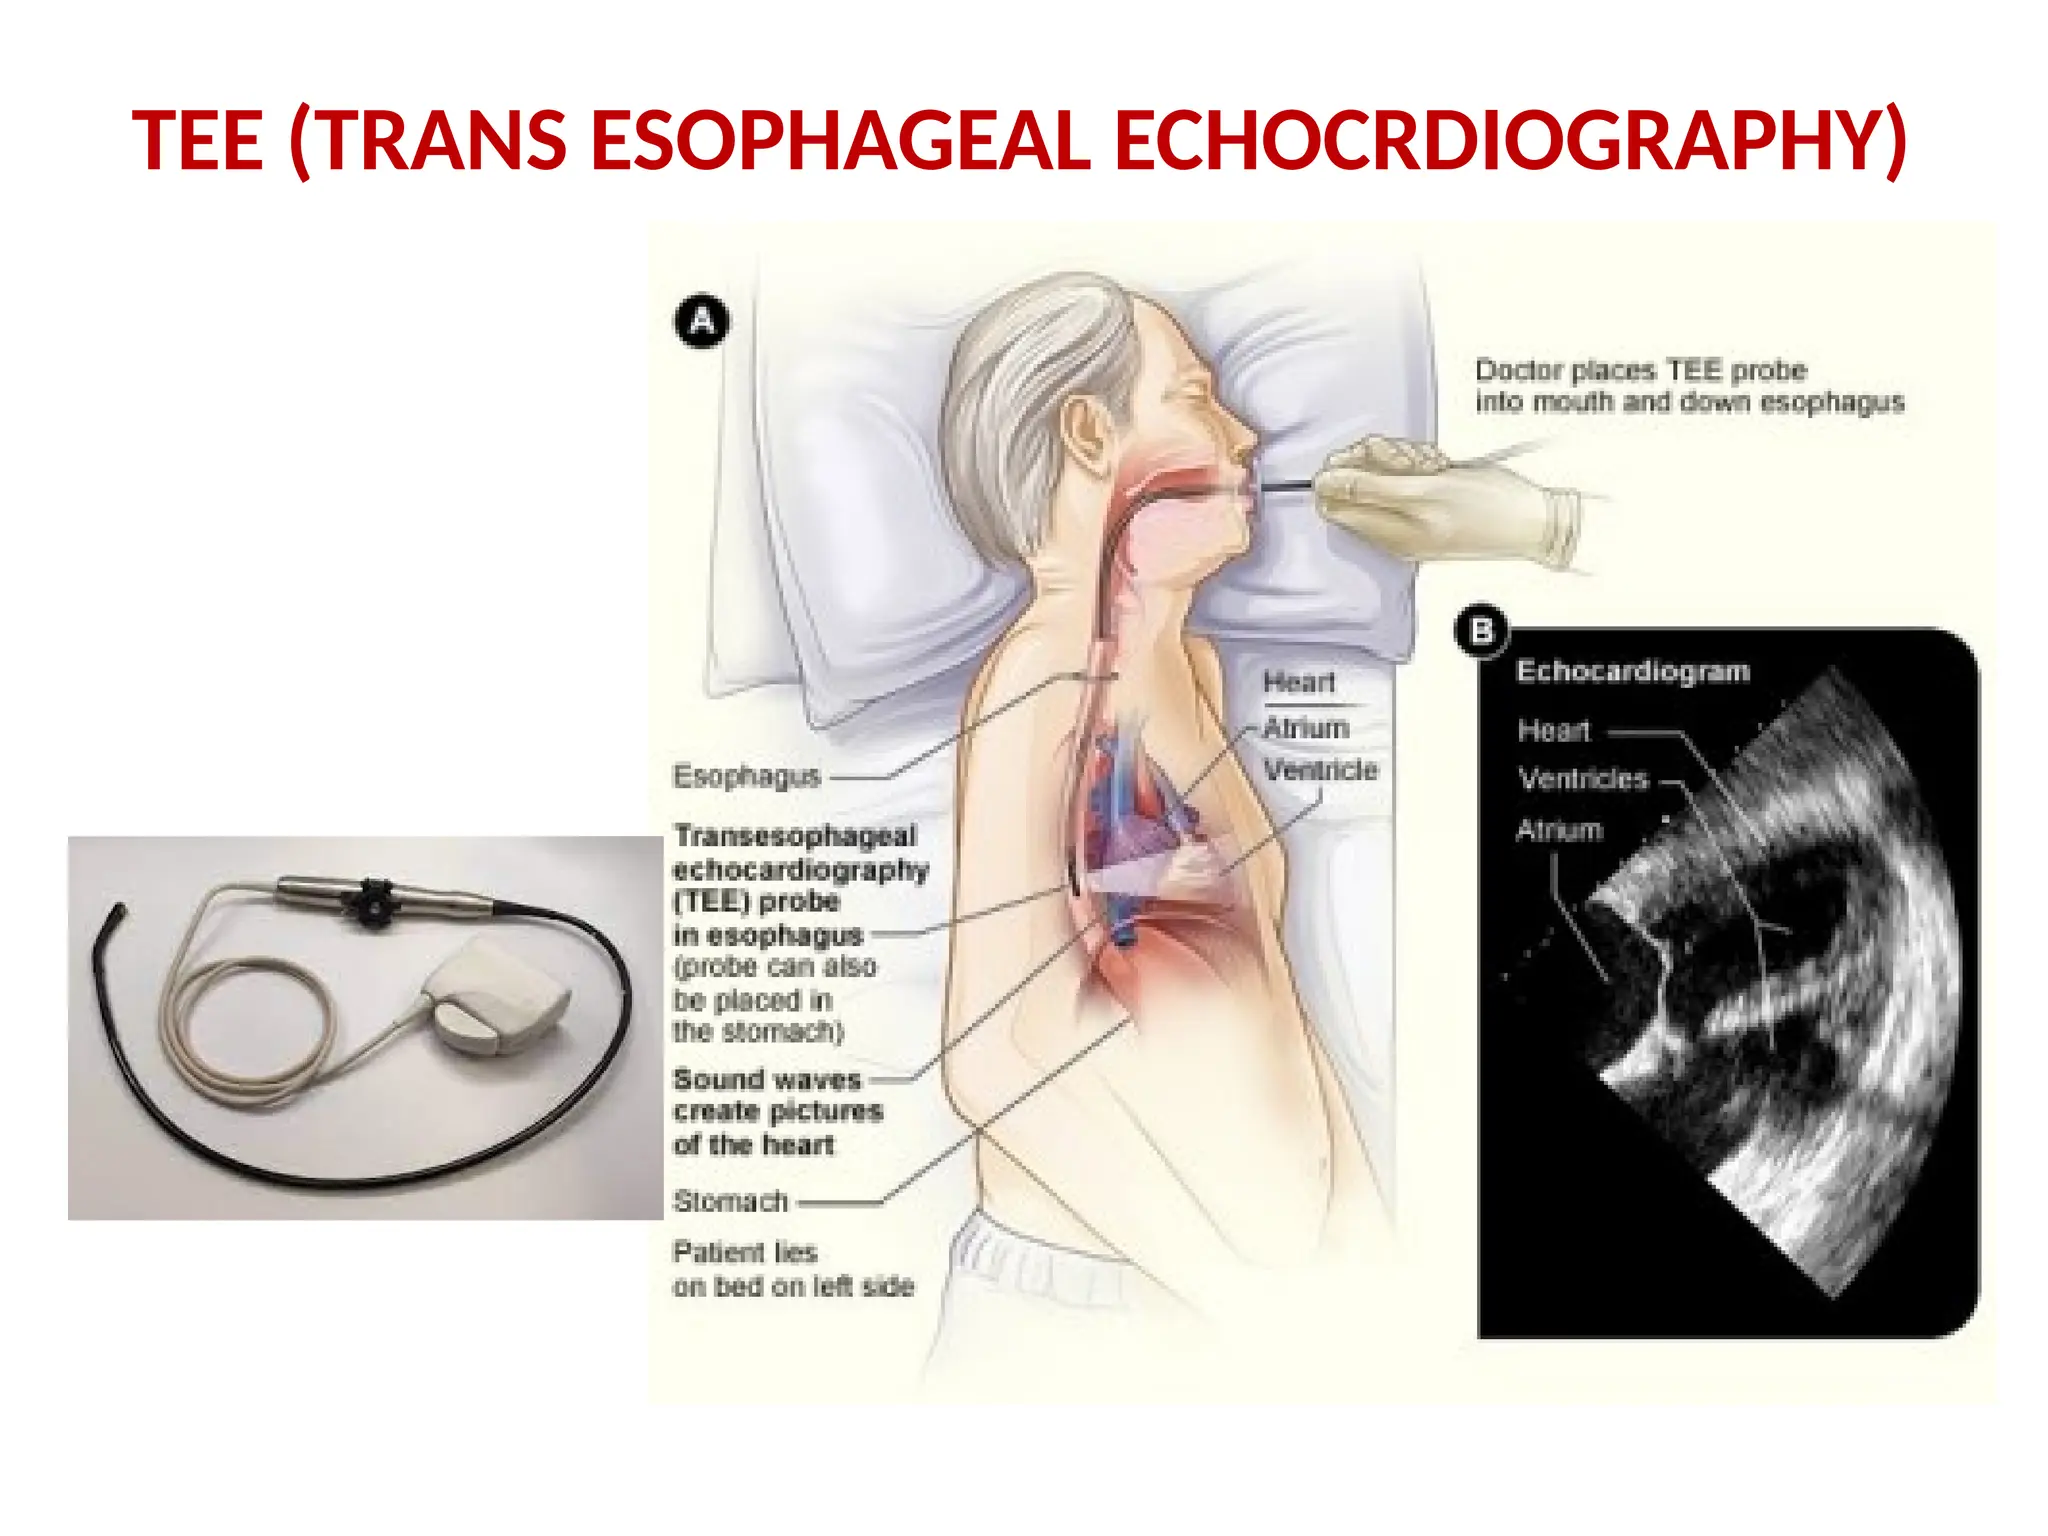
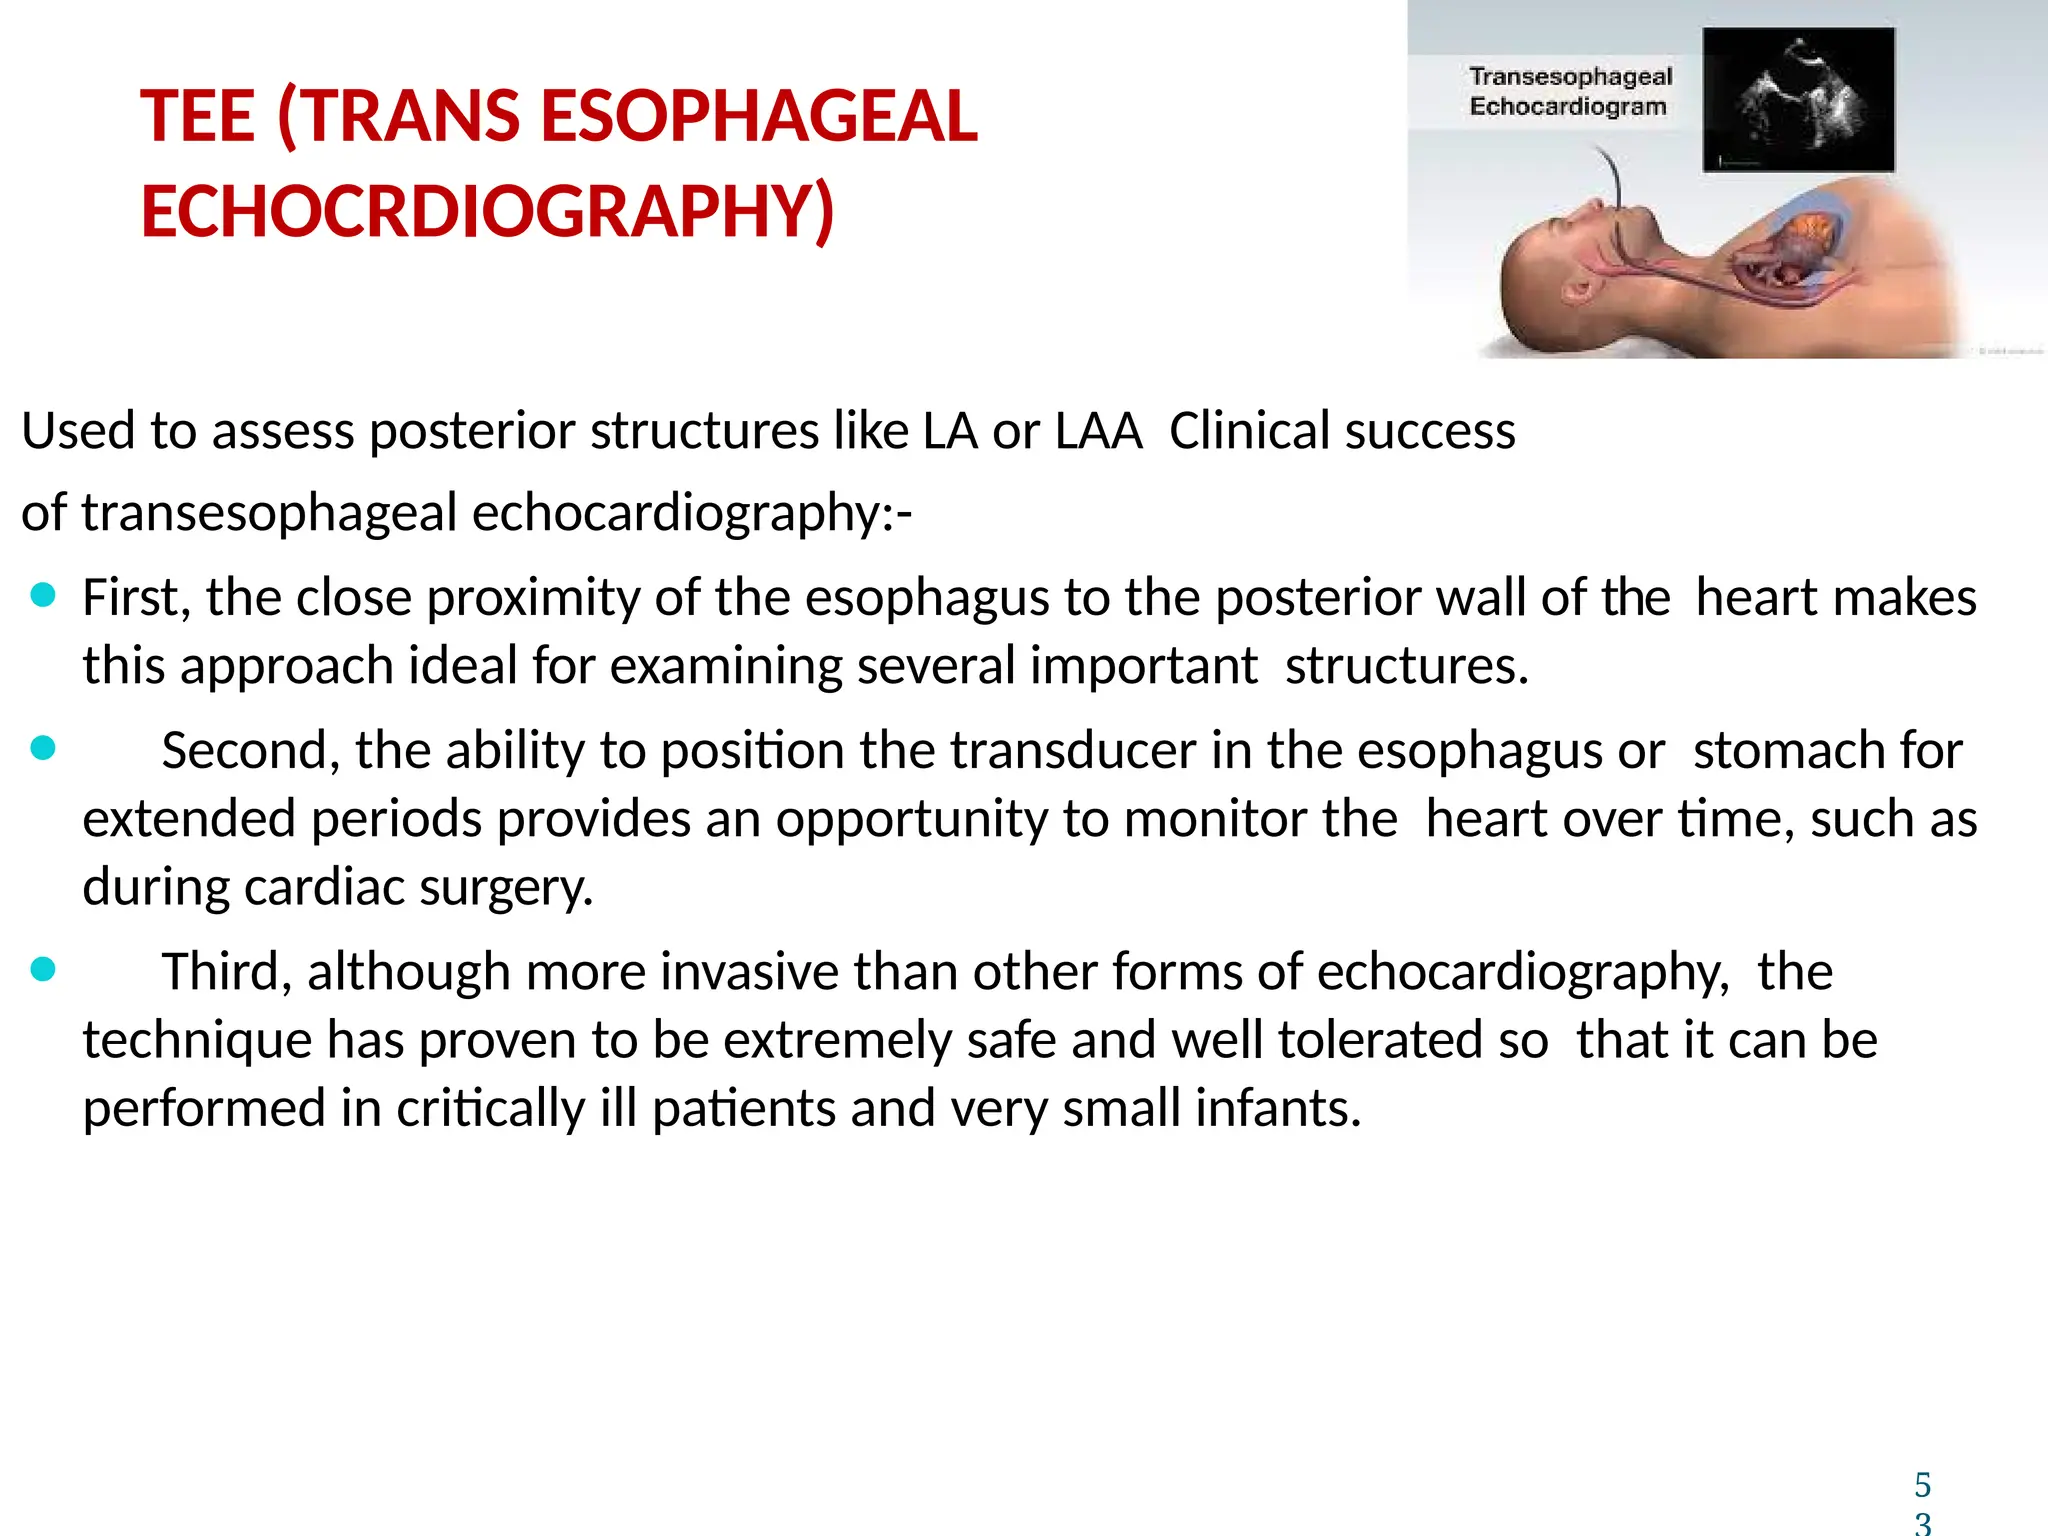
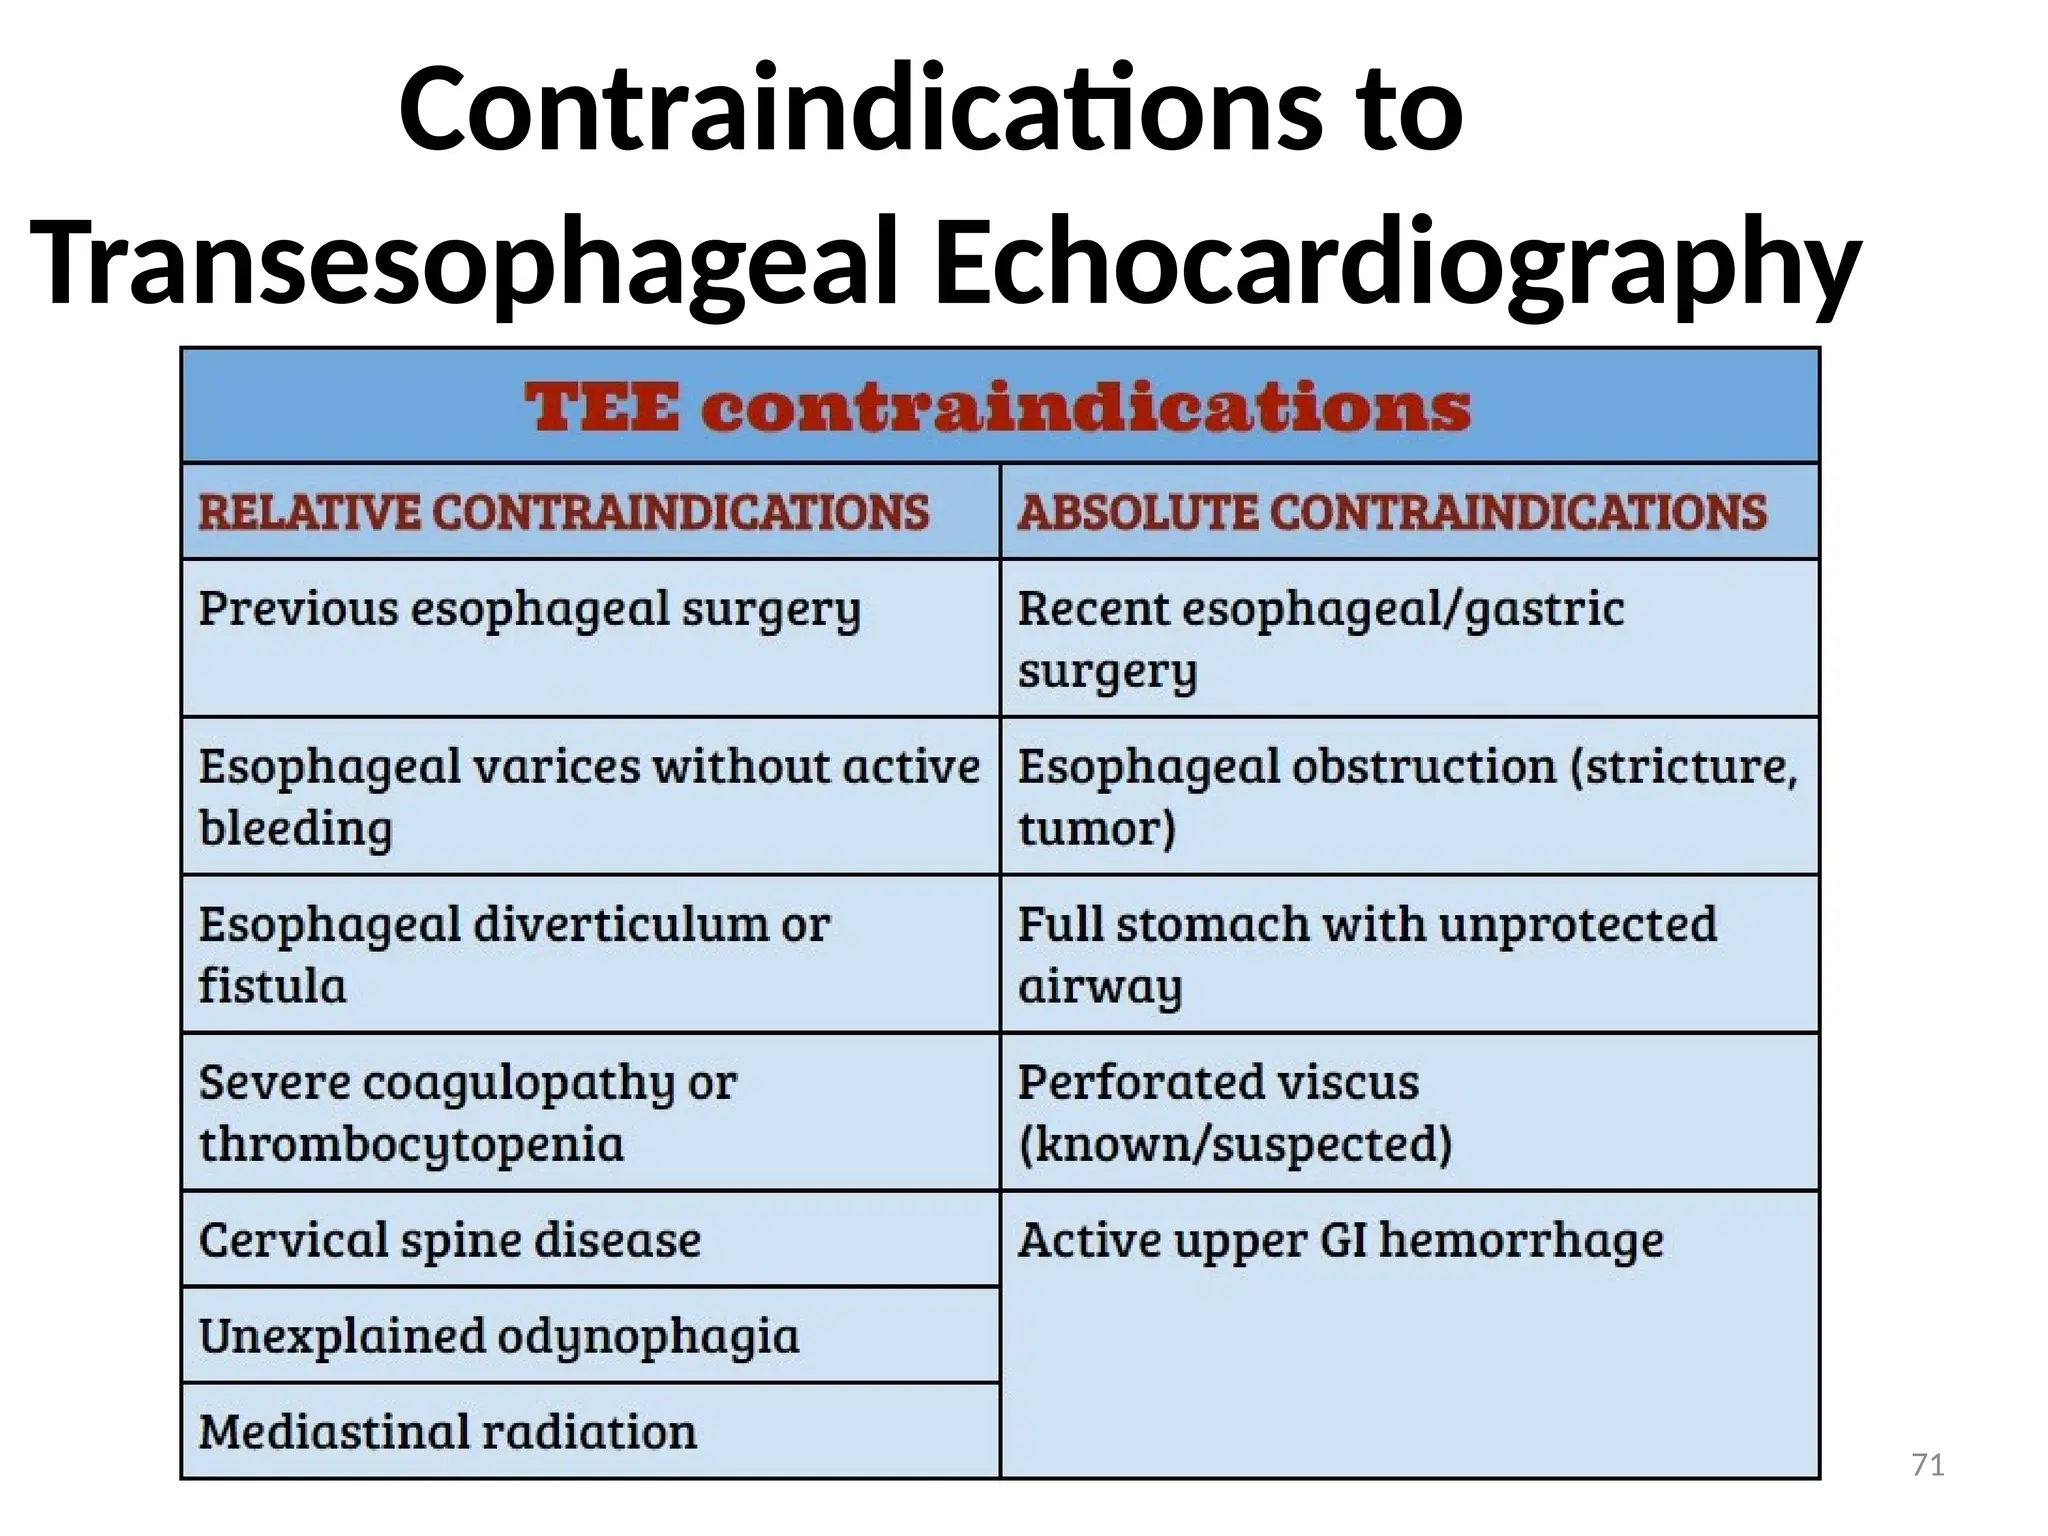
Used to assessposterior structures like LA or LAA Clinical success
of transesophageal echocardiography:-
⚫ First, the close proximity of the esophagus to the posterior wall of the heart makes
this approach ideal for examining several important structures.
⚫ Second, the ability to position the transducer in the esophagus or stomach for
extended periods provides an opportunity to monitor the heart over time, such as
during cardiac surgery.
⚫ Third, although more invasive than other forms of echocardiography, the
technique has proven to be extremely safe and well tolerated so that it can be
performed in critically ill patients and very small infants.
5
TEE (TRANS ESOPHAGEAL
ECHOCRDIOGRAPHY)
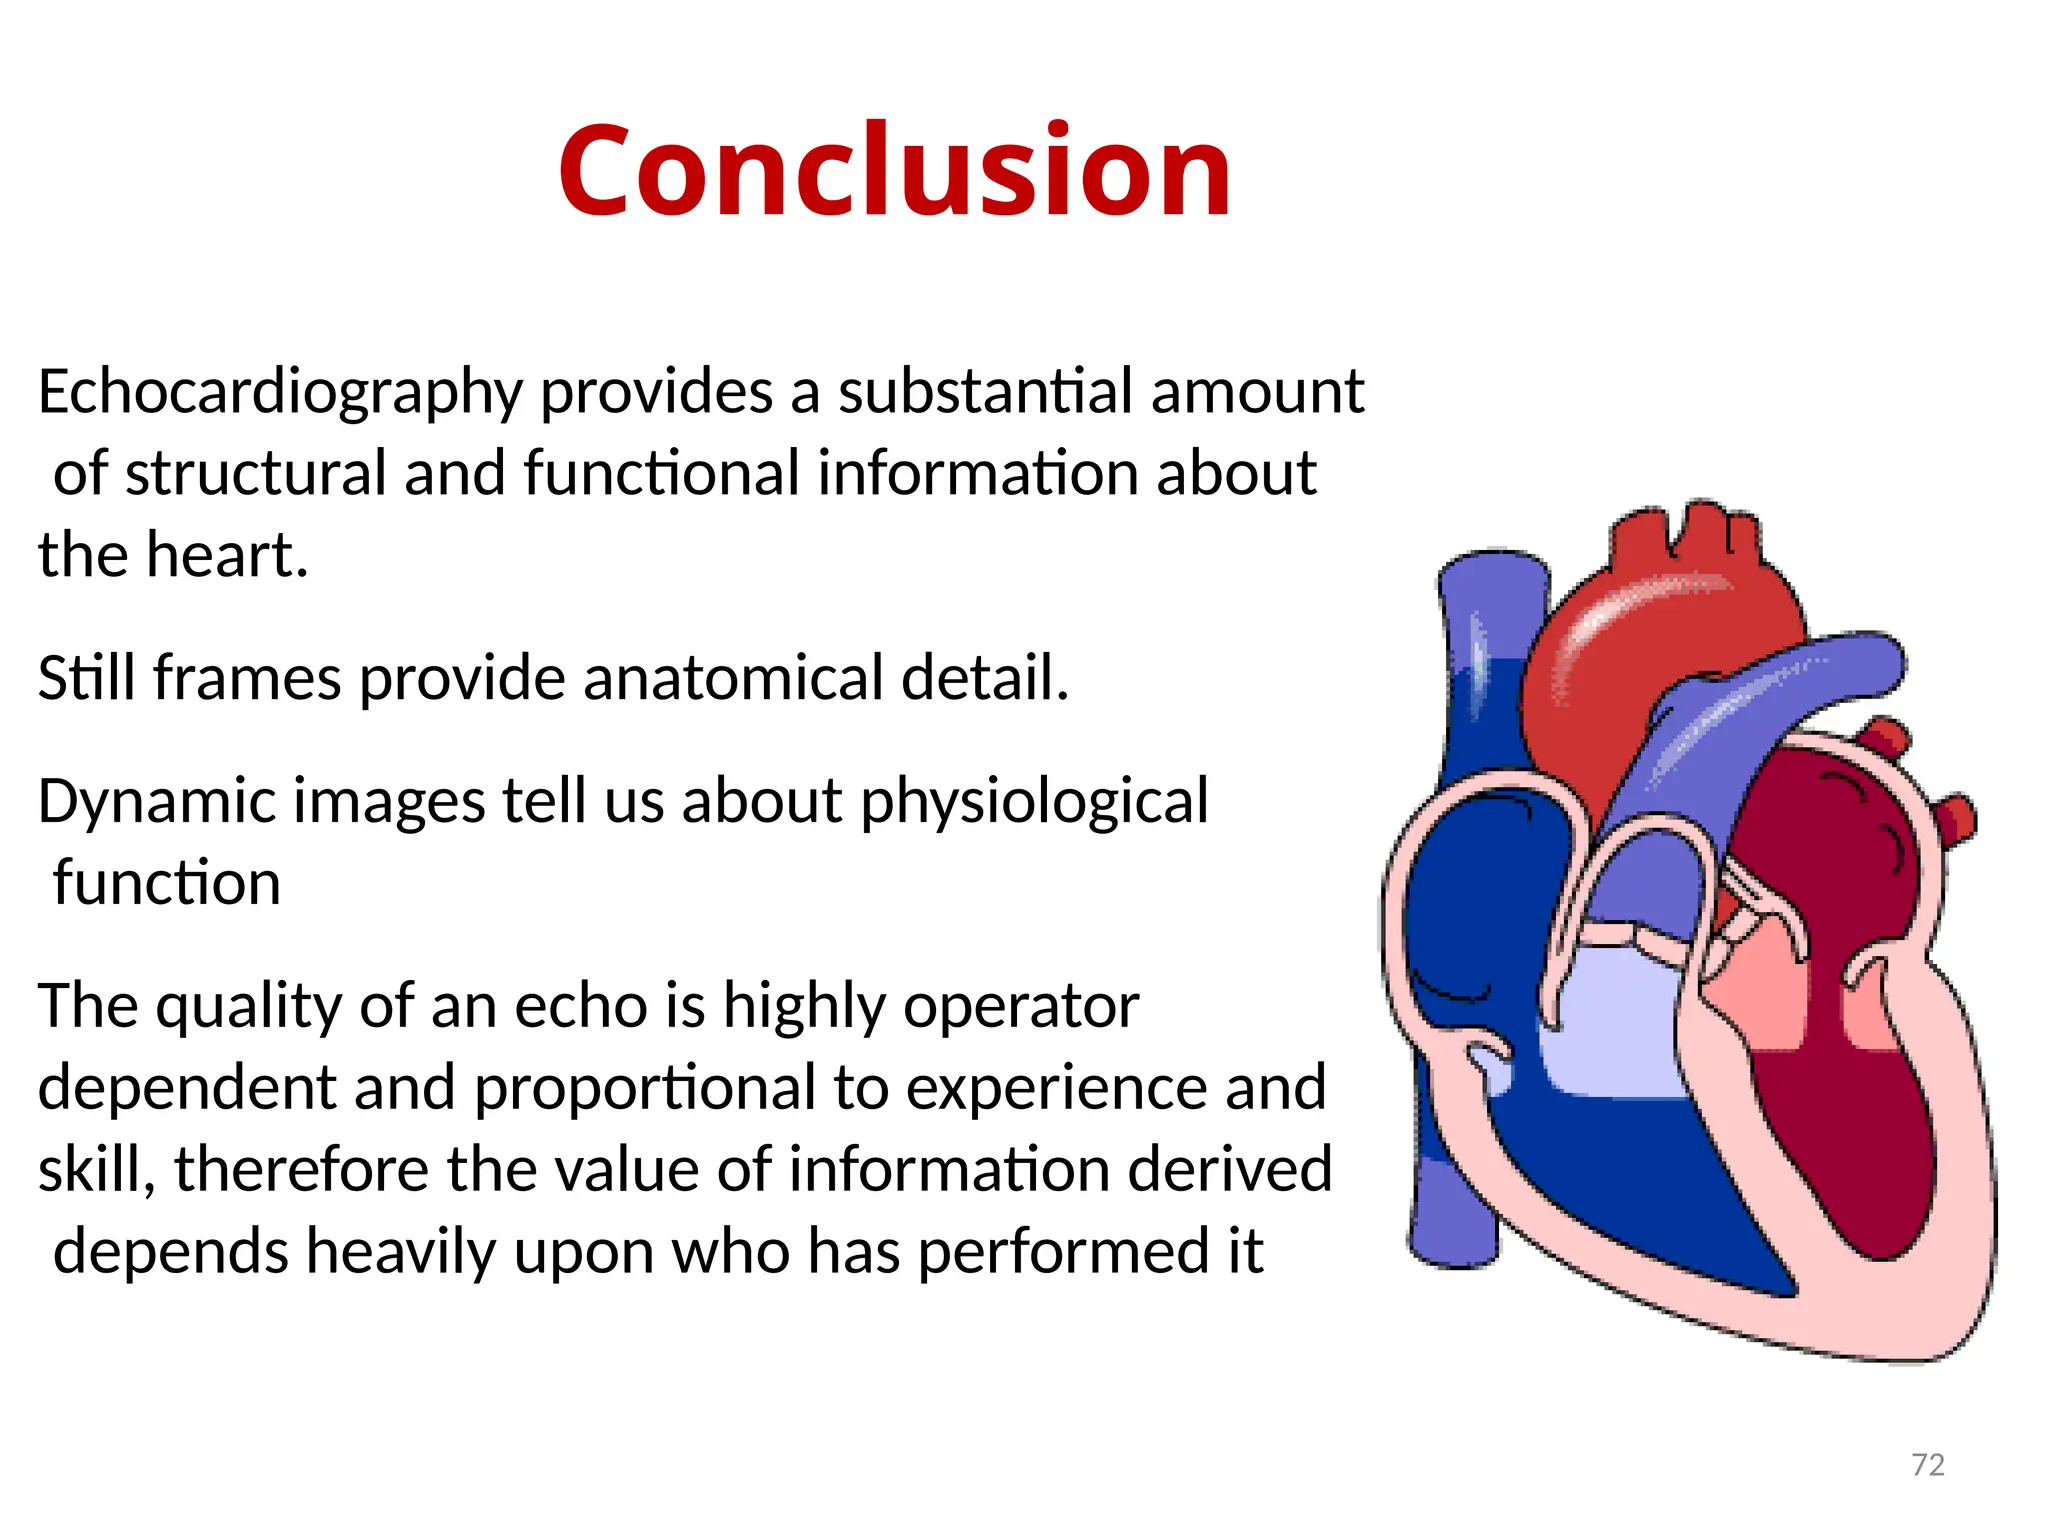
Conclusion
72
Echocardiography provides asubstantial amount
of structural and functional information about
the heart.
Still frames provide anatomical detail.
Dynamic images tell us about physiological
function
The quality of an echo is highly operator
dependent and proportional to experience and
skill, therefore the value of information derived
depends heavily upon who has performed it
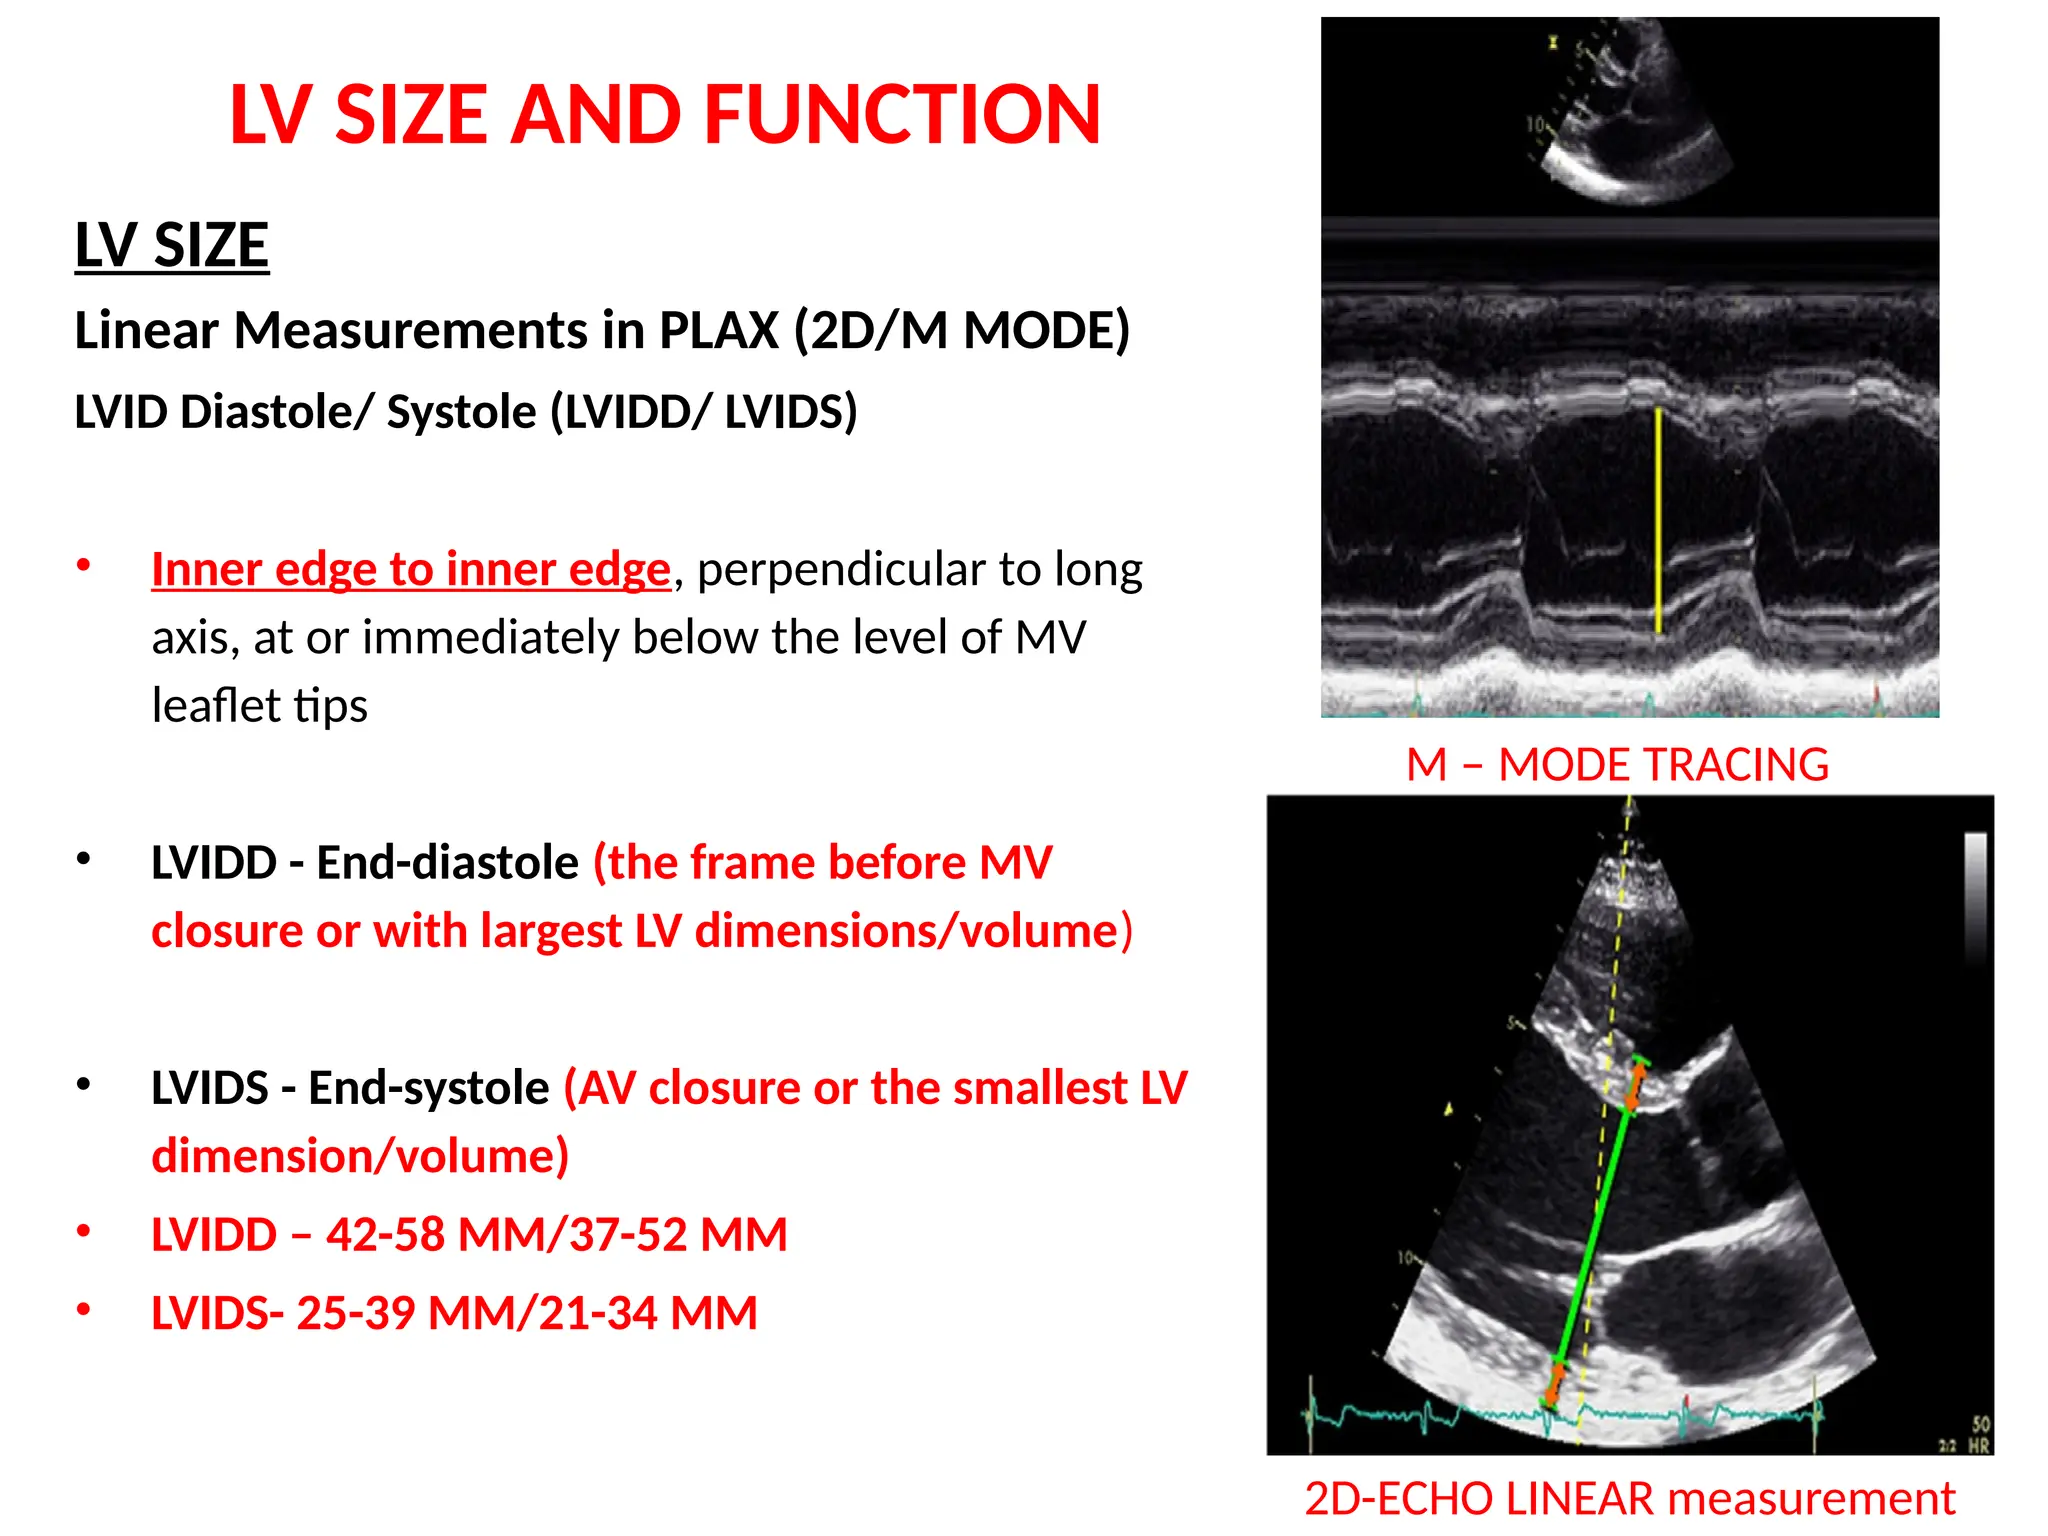
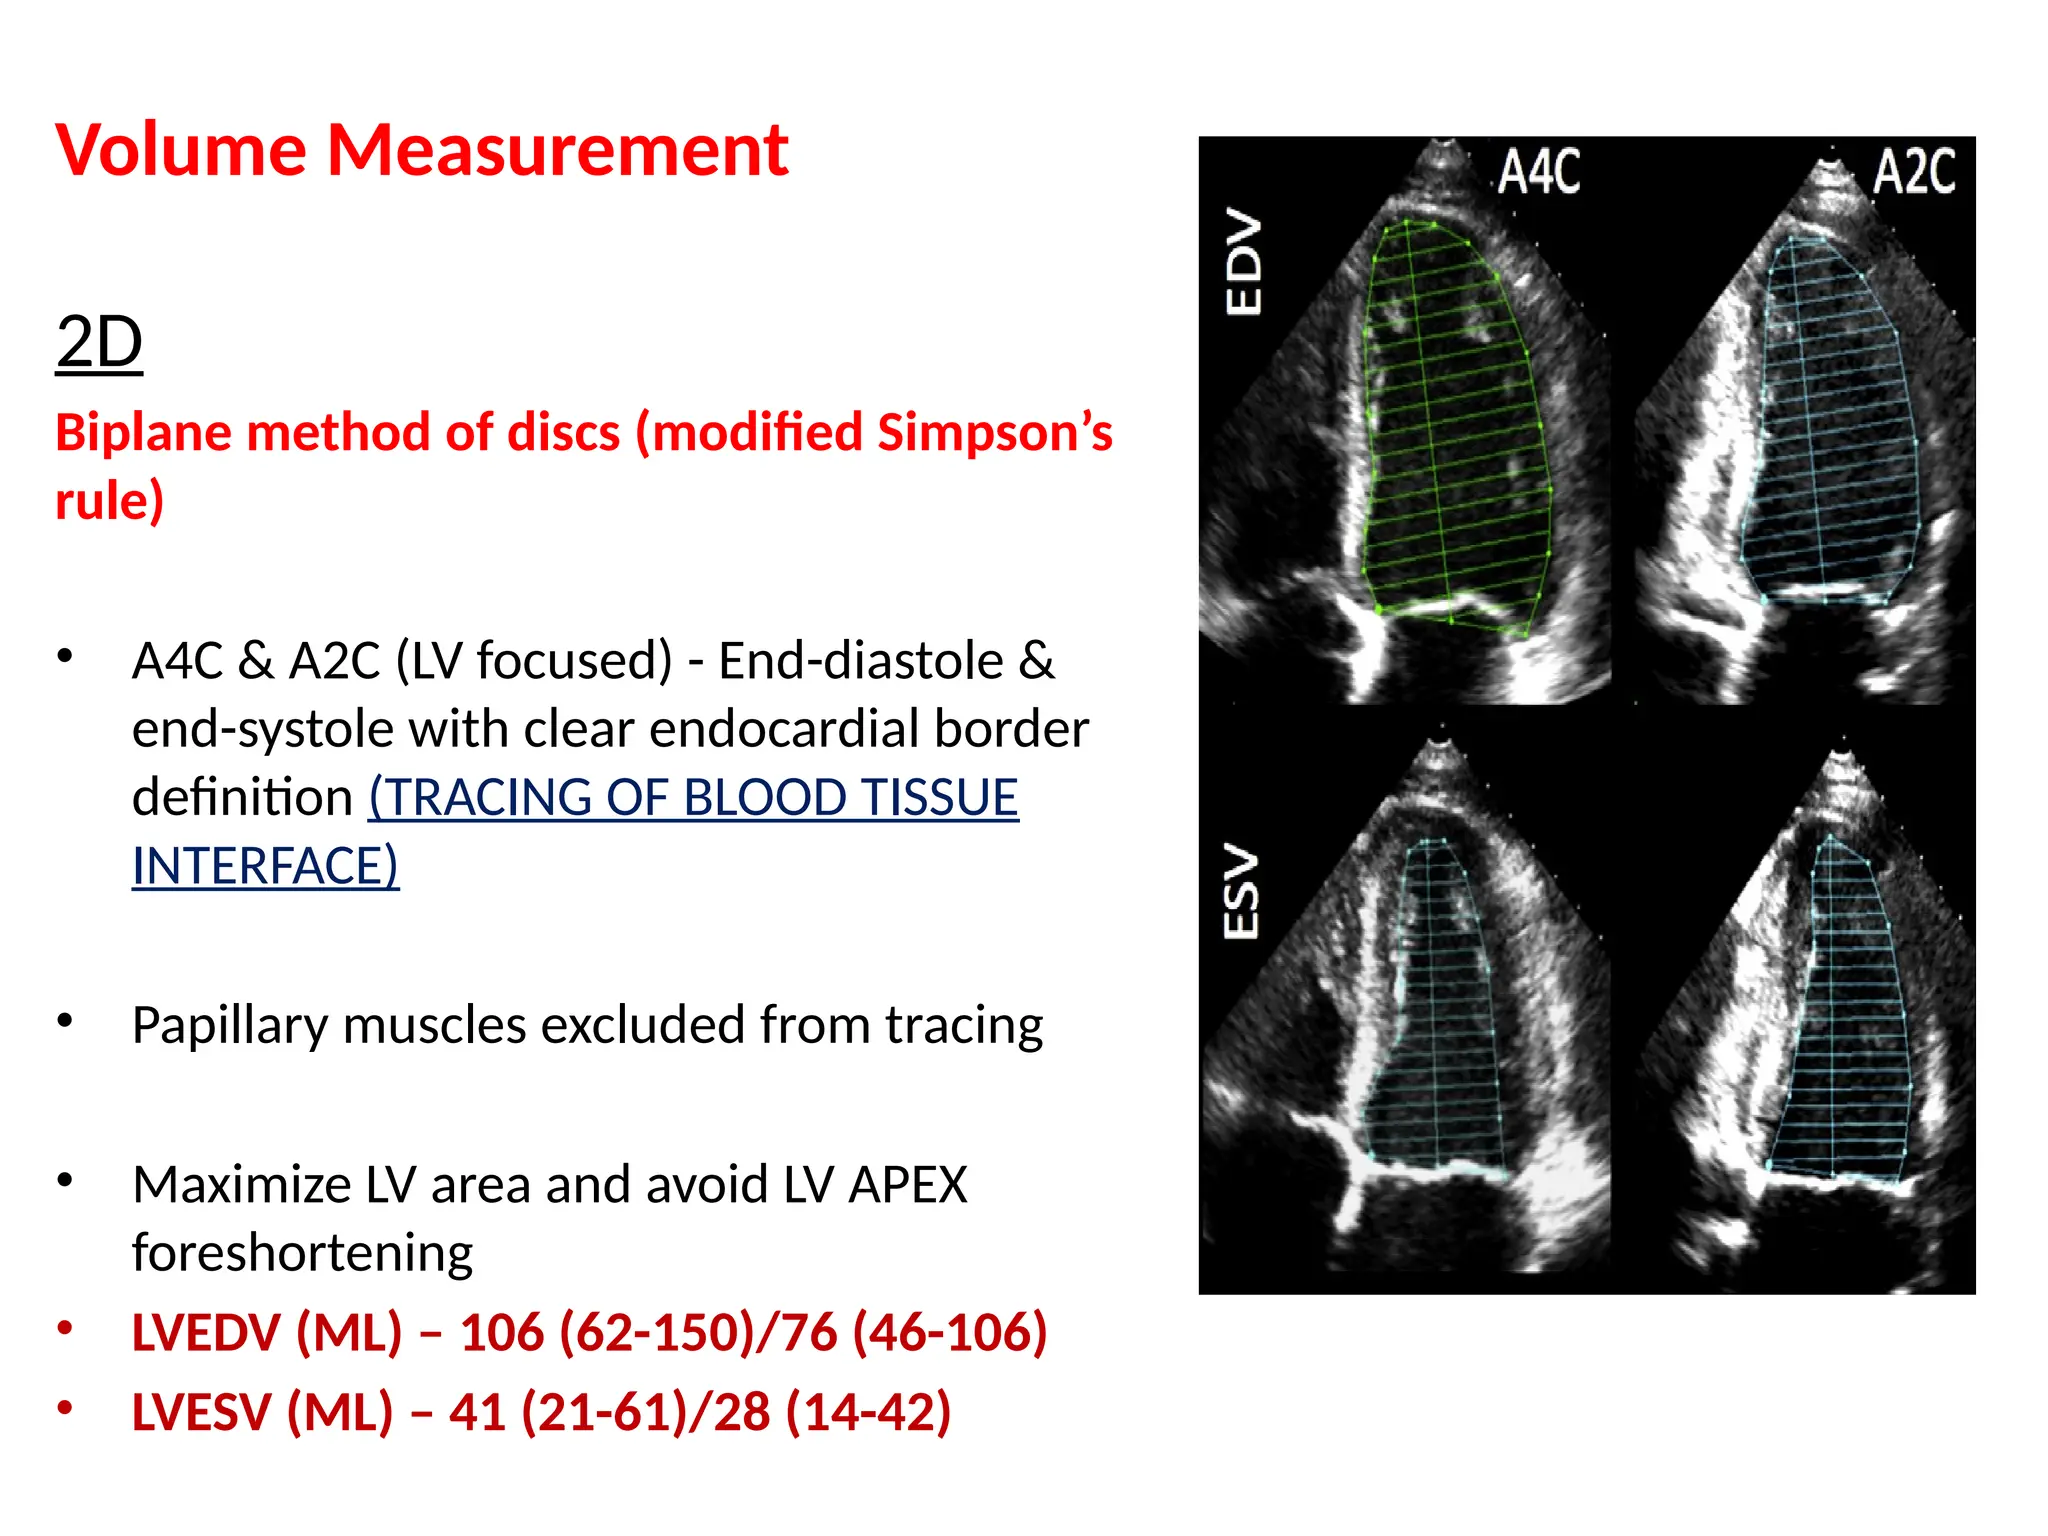
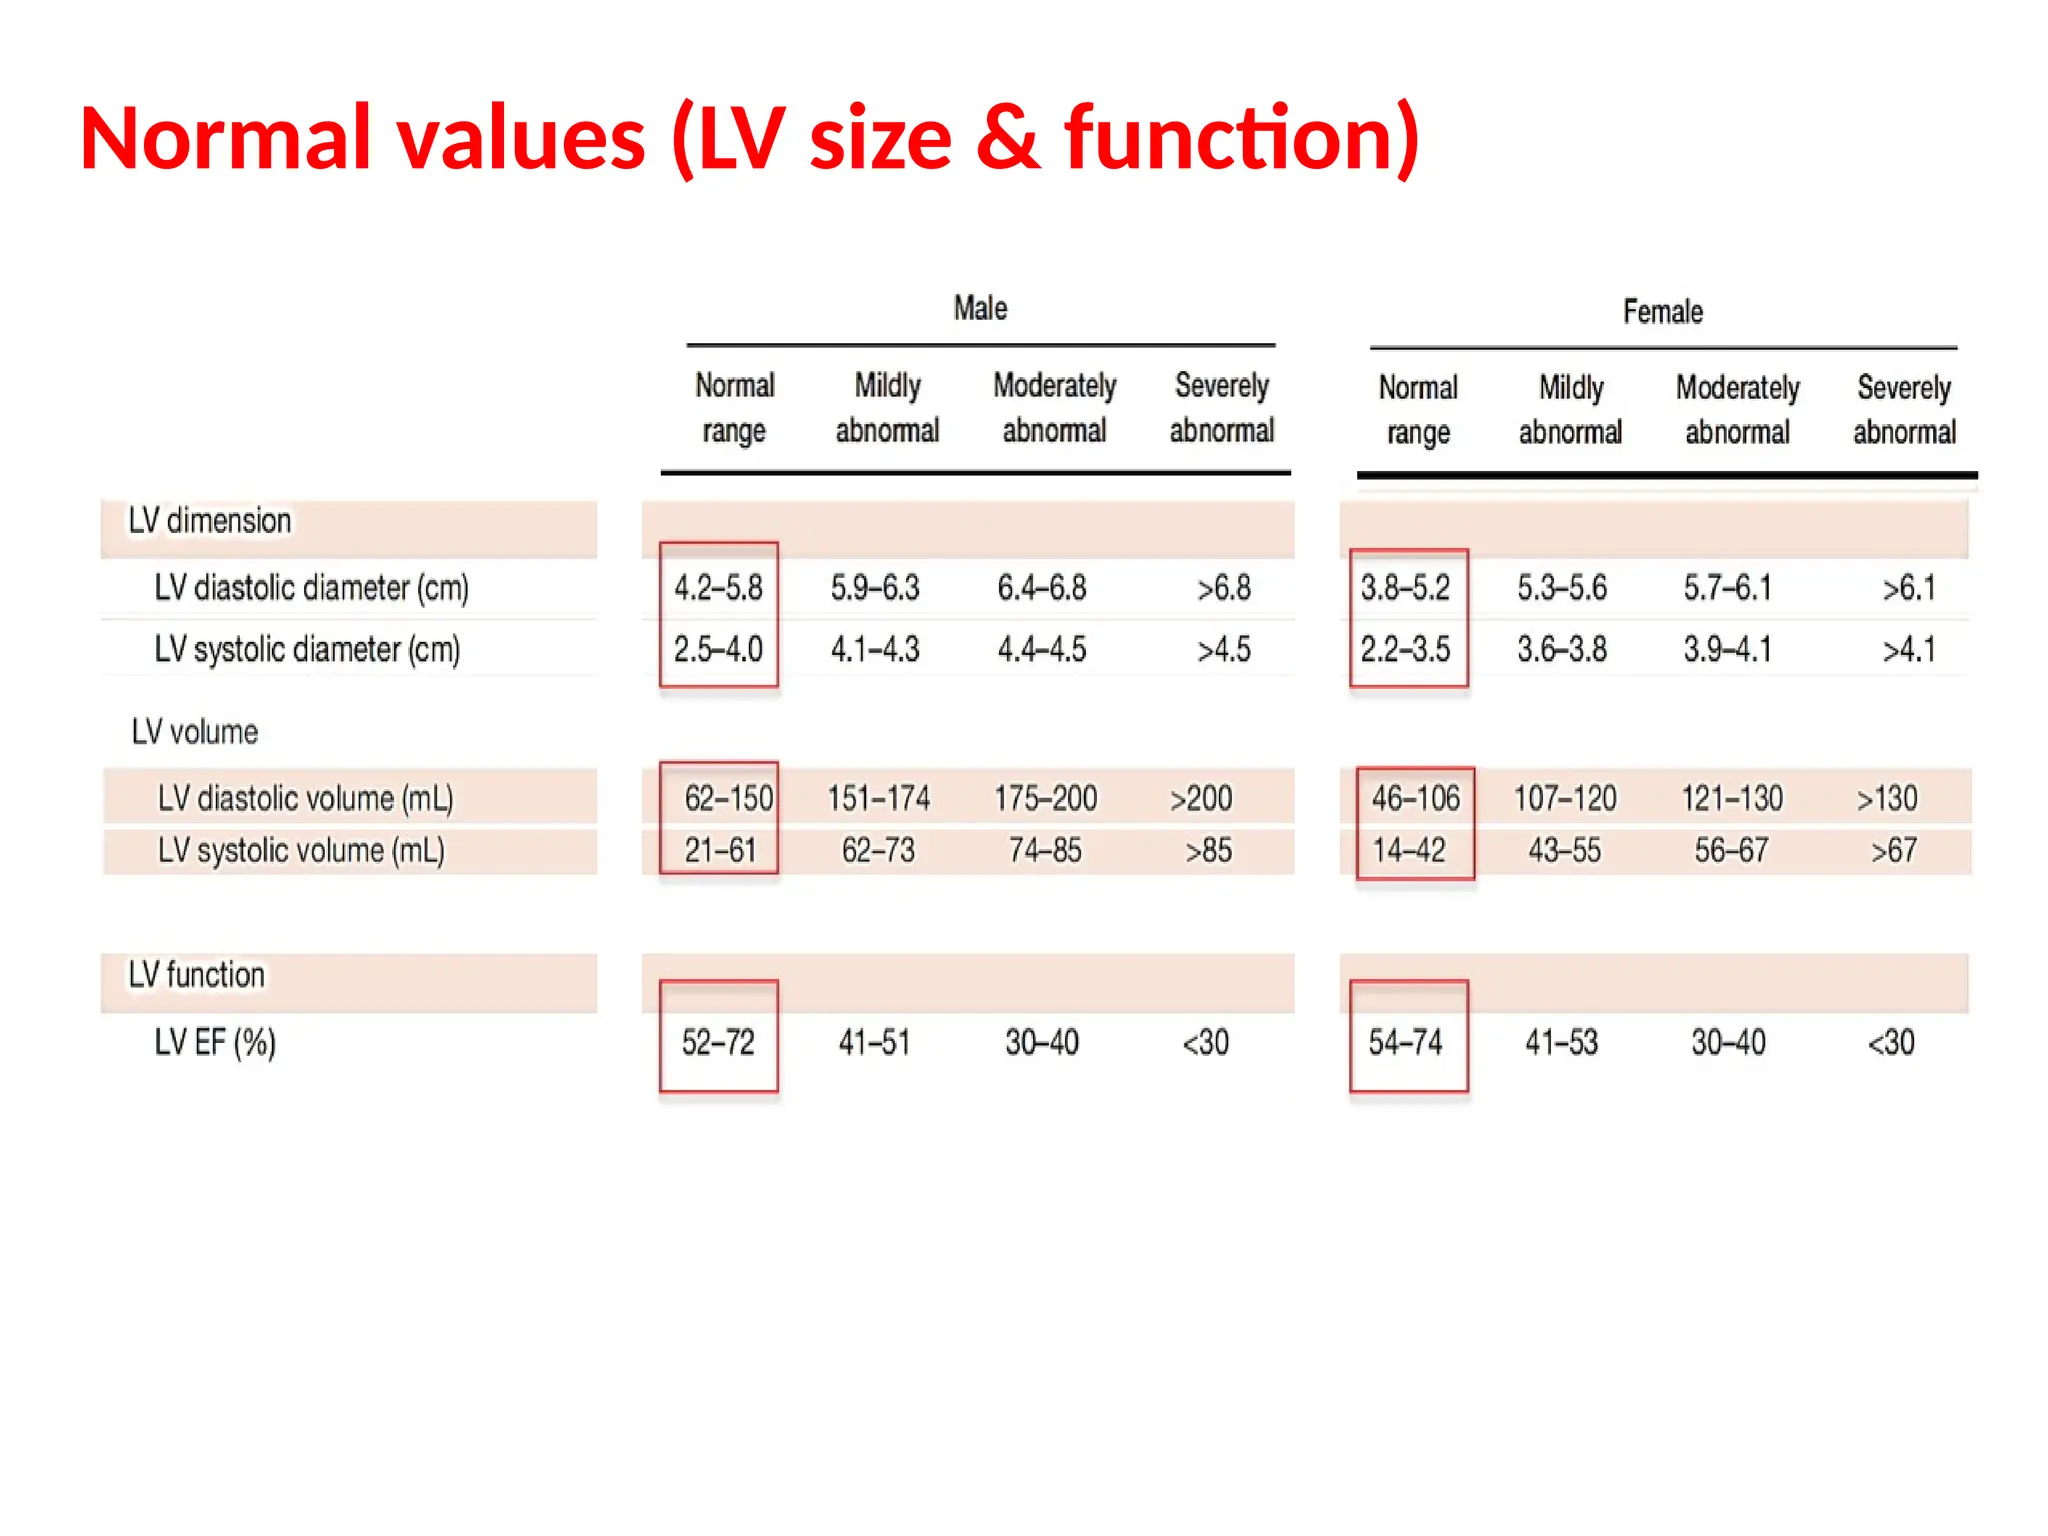
LV SIZE ANDFUNCTION
LV SIZE
Linear Measurements in PLAX (2D/M MODE)
LVID Diastole/ Systole (LVIDD/ LVIDS)
• Inner edge to inner edge, perpendicular to long
axis, at or immediately below the level of MV
leaflet tips
• LVIDD - End-diastole (the frame before MV
closure or with largest LV dimensions/volume)
• LVIDS - End-systole (AV closure or the smallest LV
dimension/volume)
• LVIDD – 42-58 MM/37-52 MM
• LVIDS- 25-39 MM/21-34 MM
M – MODE TRACING
2D-ECHO LINEAR measurement
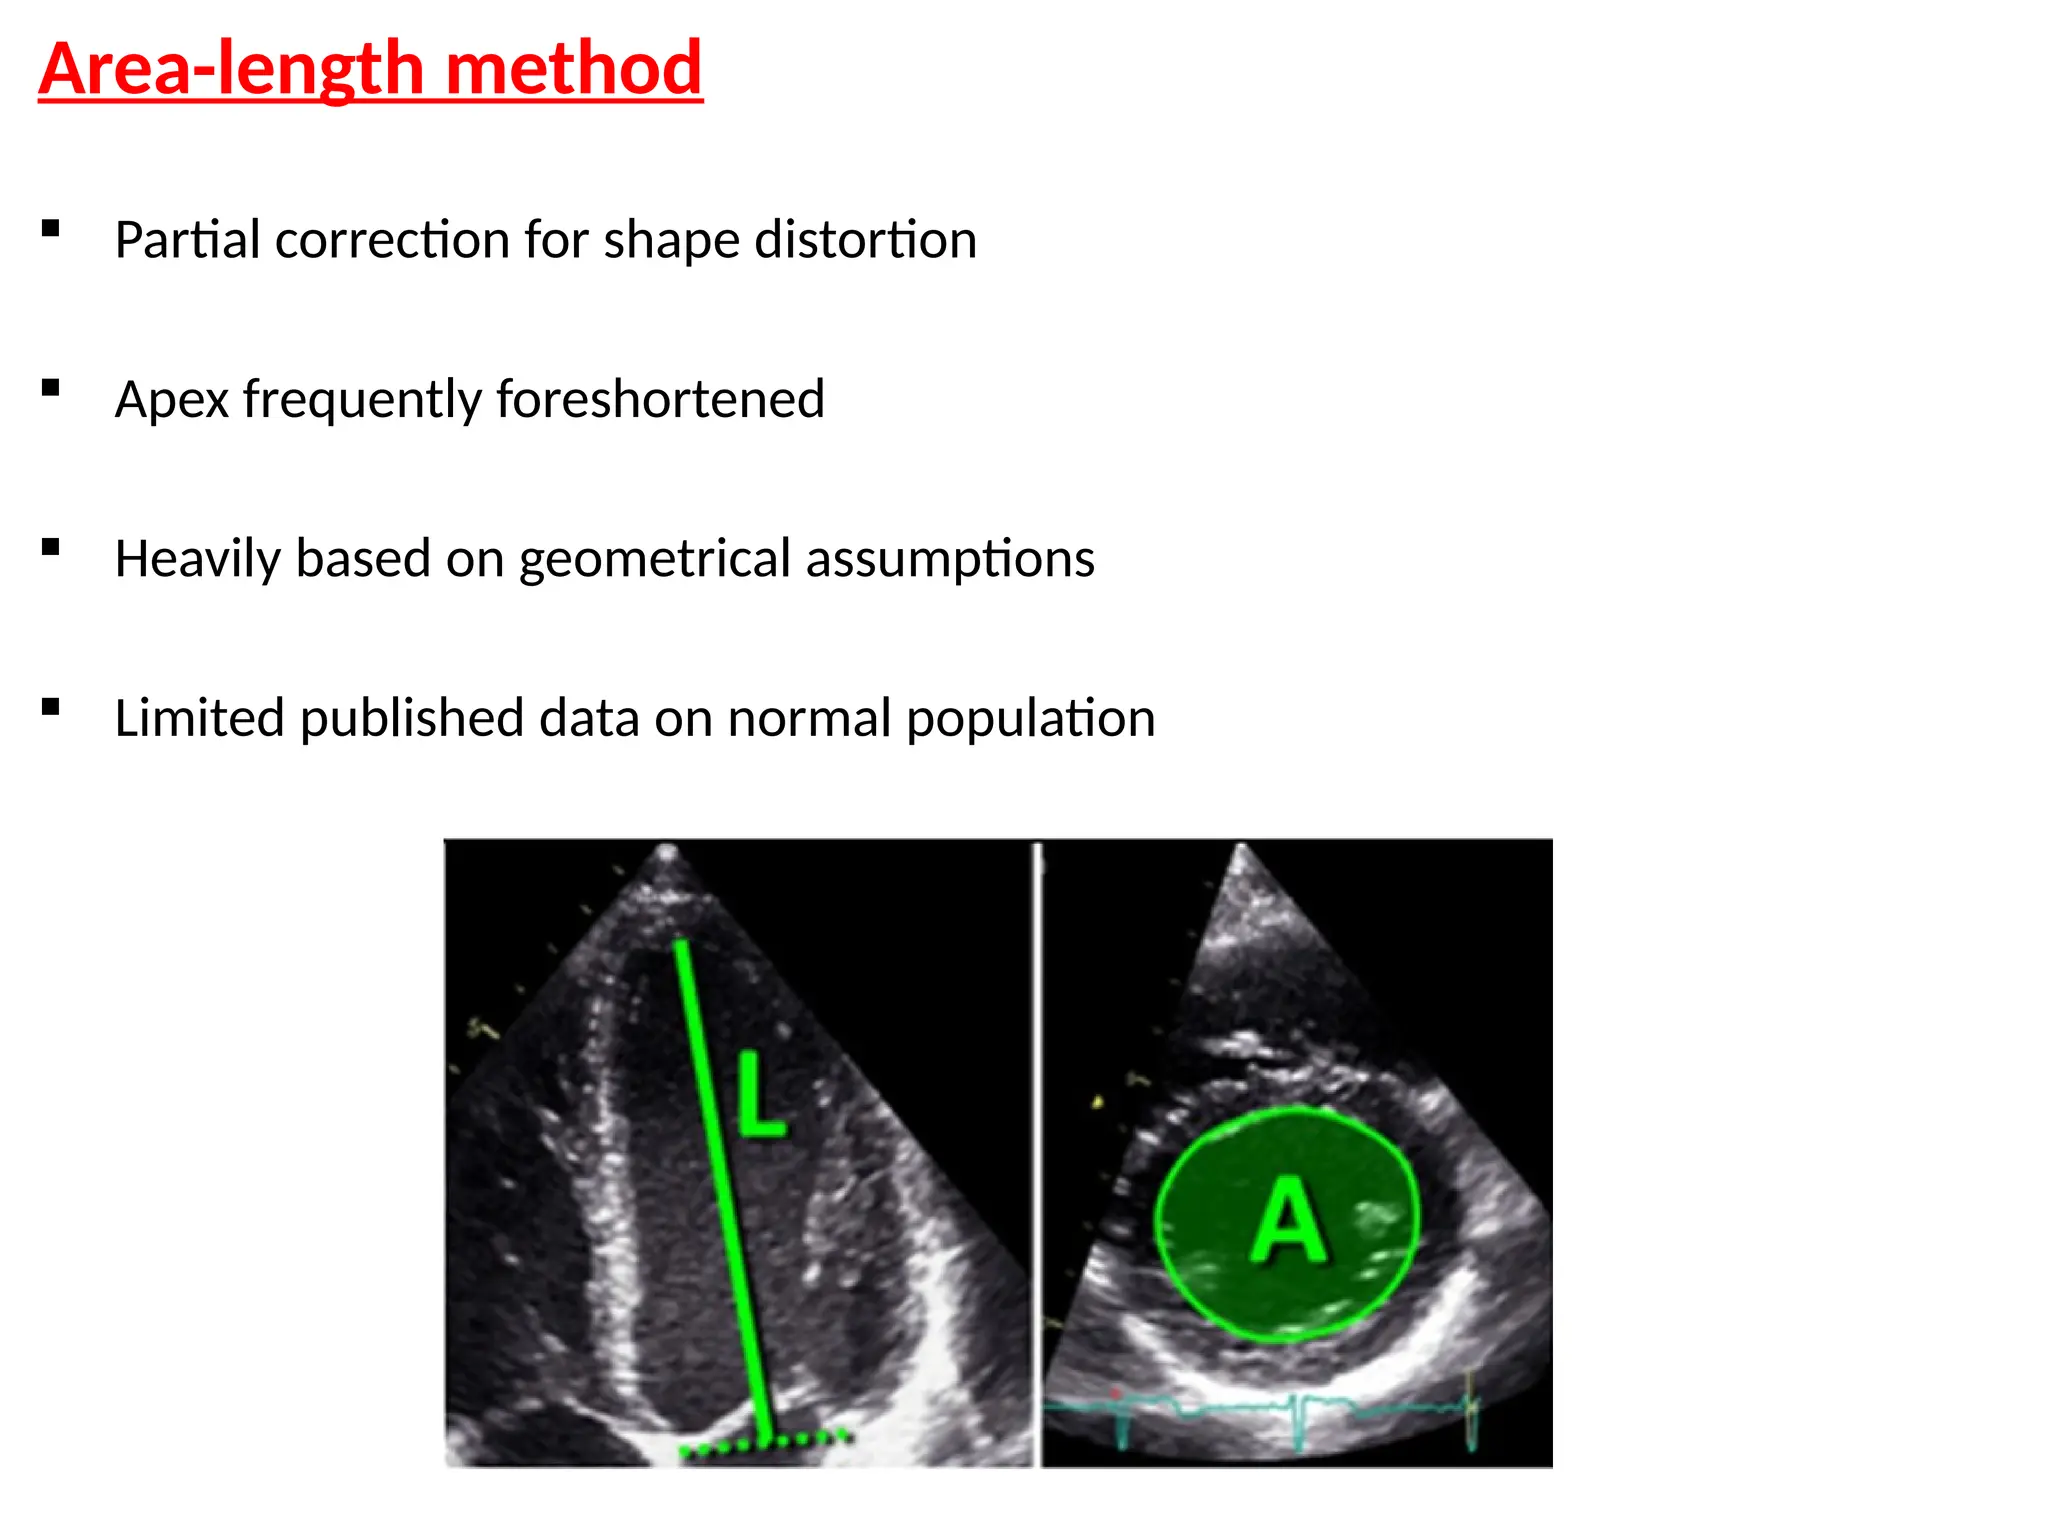
Area-length method
Partialcorrection for shape distortion
Apex frequently foreshortened
Heavily based on geometrical assumptions
Limited published data on normal population
79.
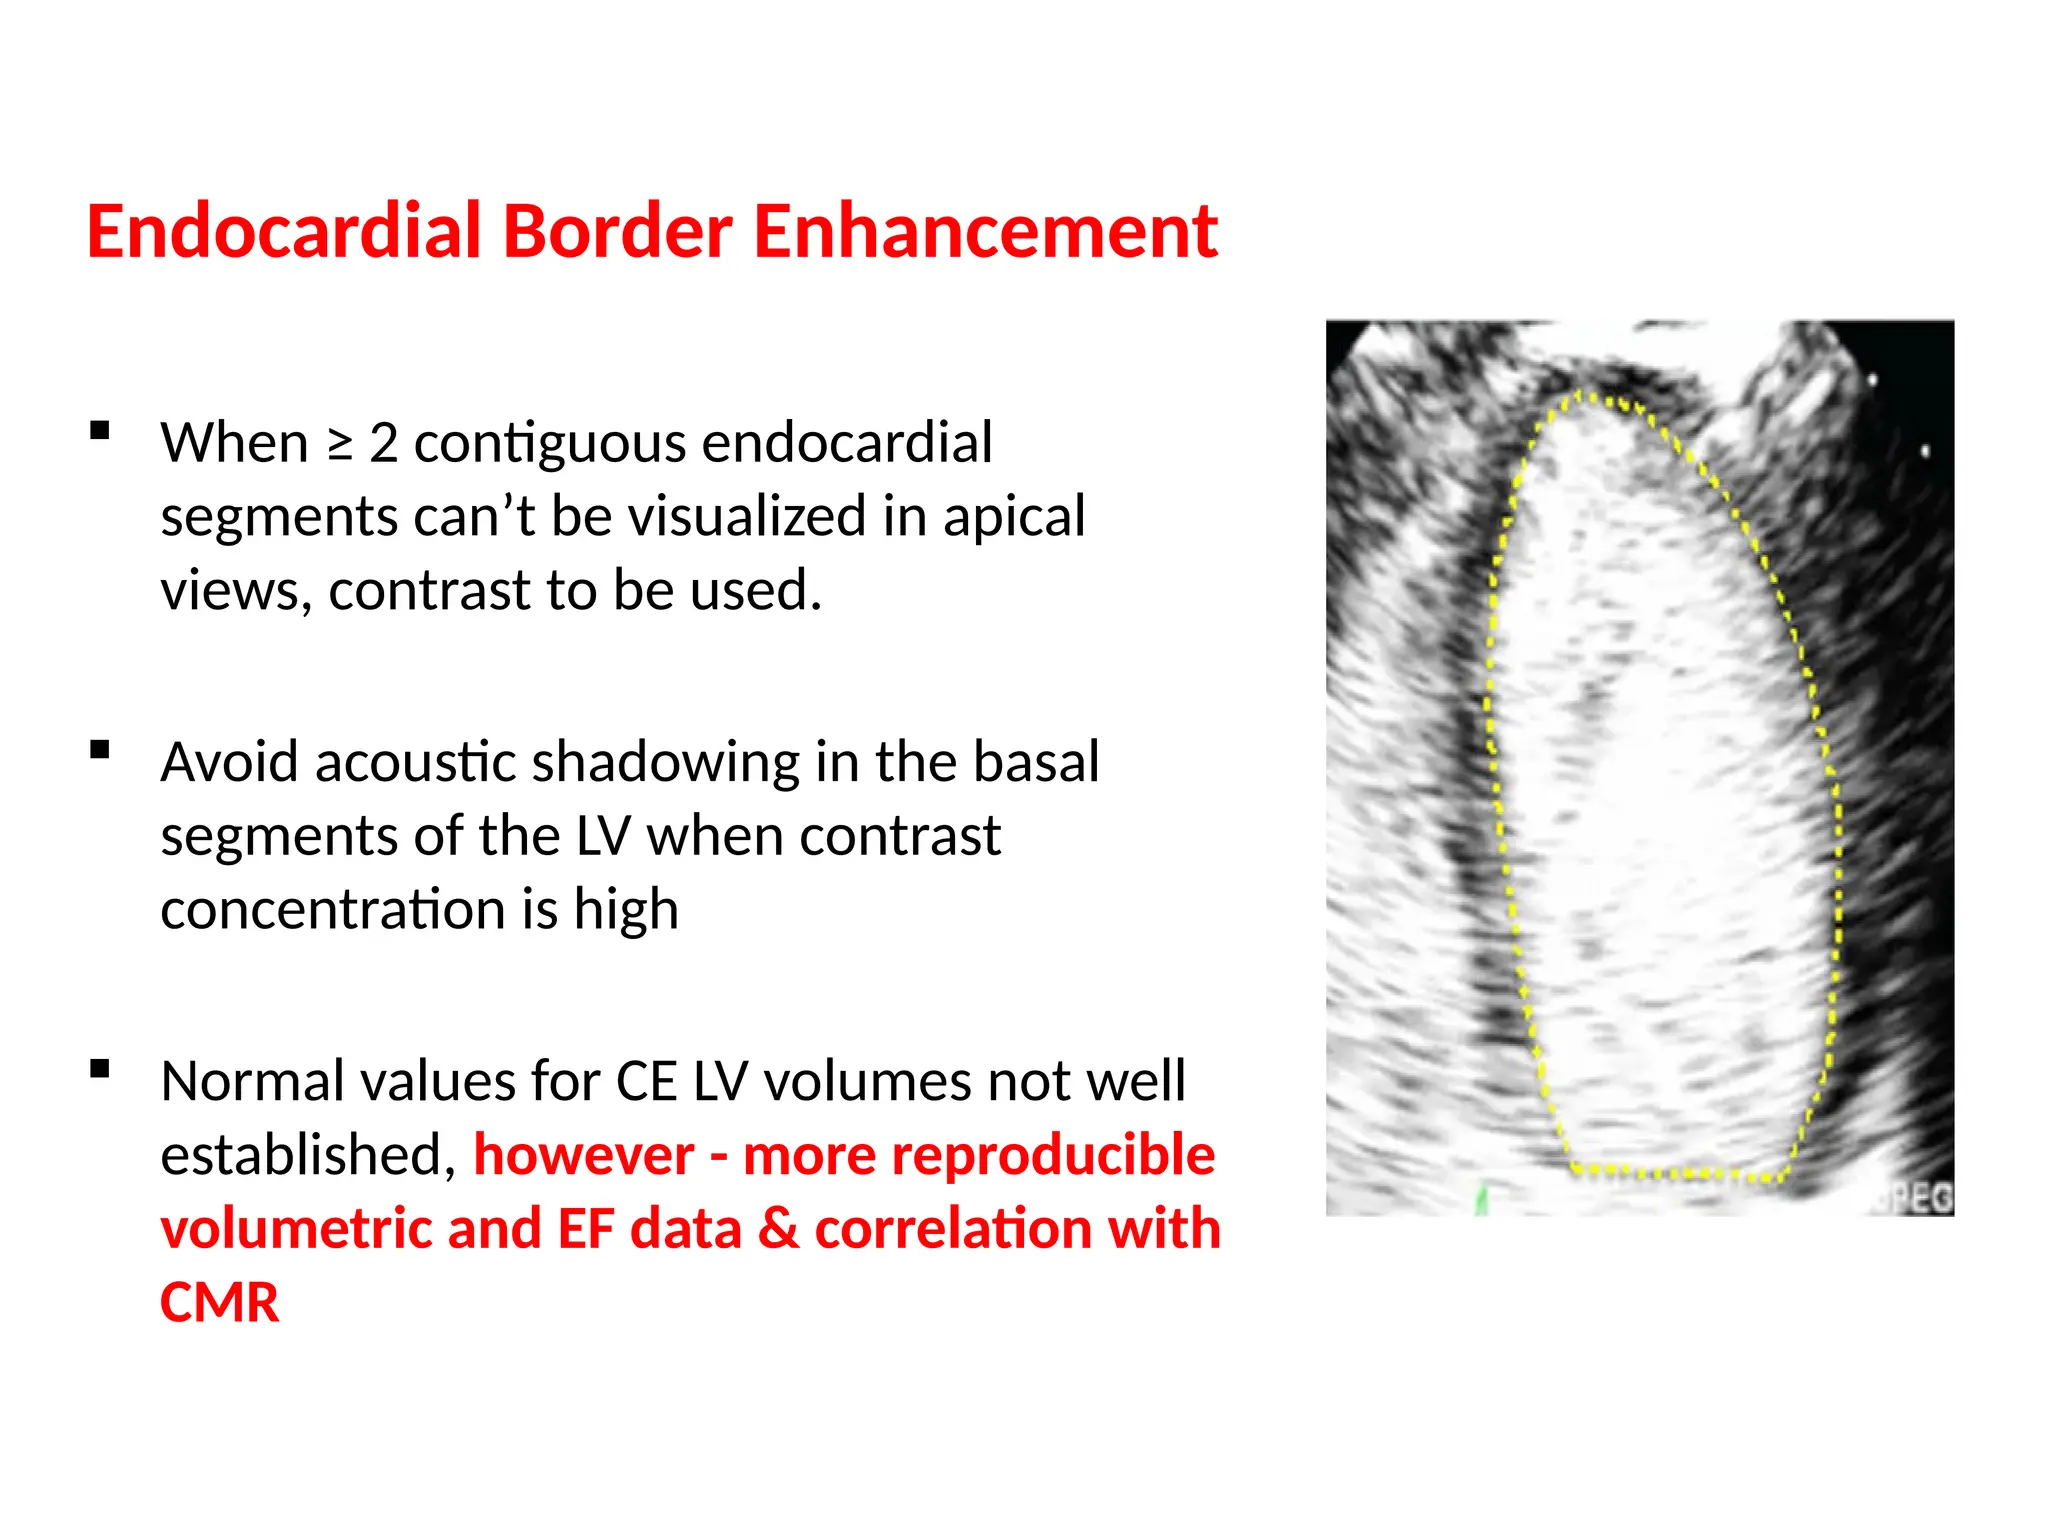
Endocardial Border Enhancement
When ≥ 2 contiguous endocardial
segments can’t be visualized in apical
views, contrast to be used.
Avoid acoustic shadowing in the basal
segments of the LV when contrast
concentration is high
Normal values for CE LV volumes not well
established, however - more reproducible
volumetric and EF data & correlation with
CMR
80.
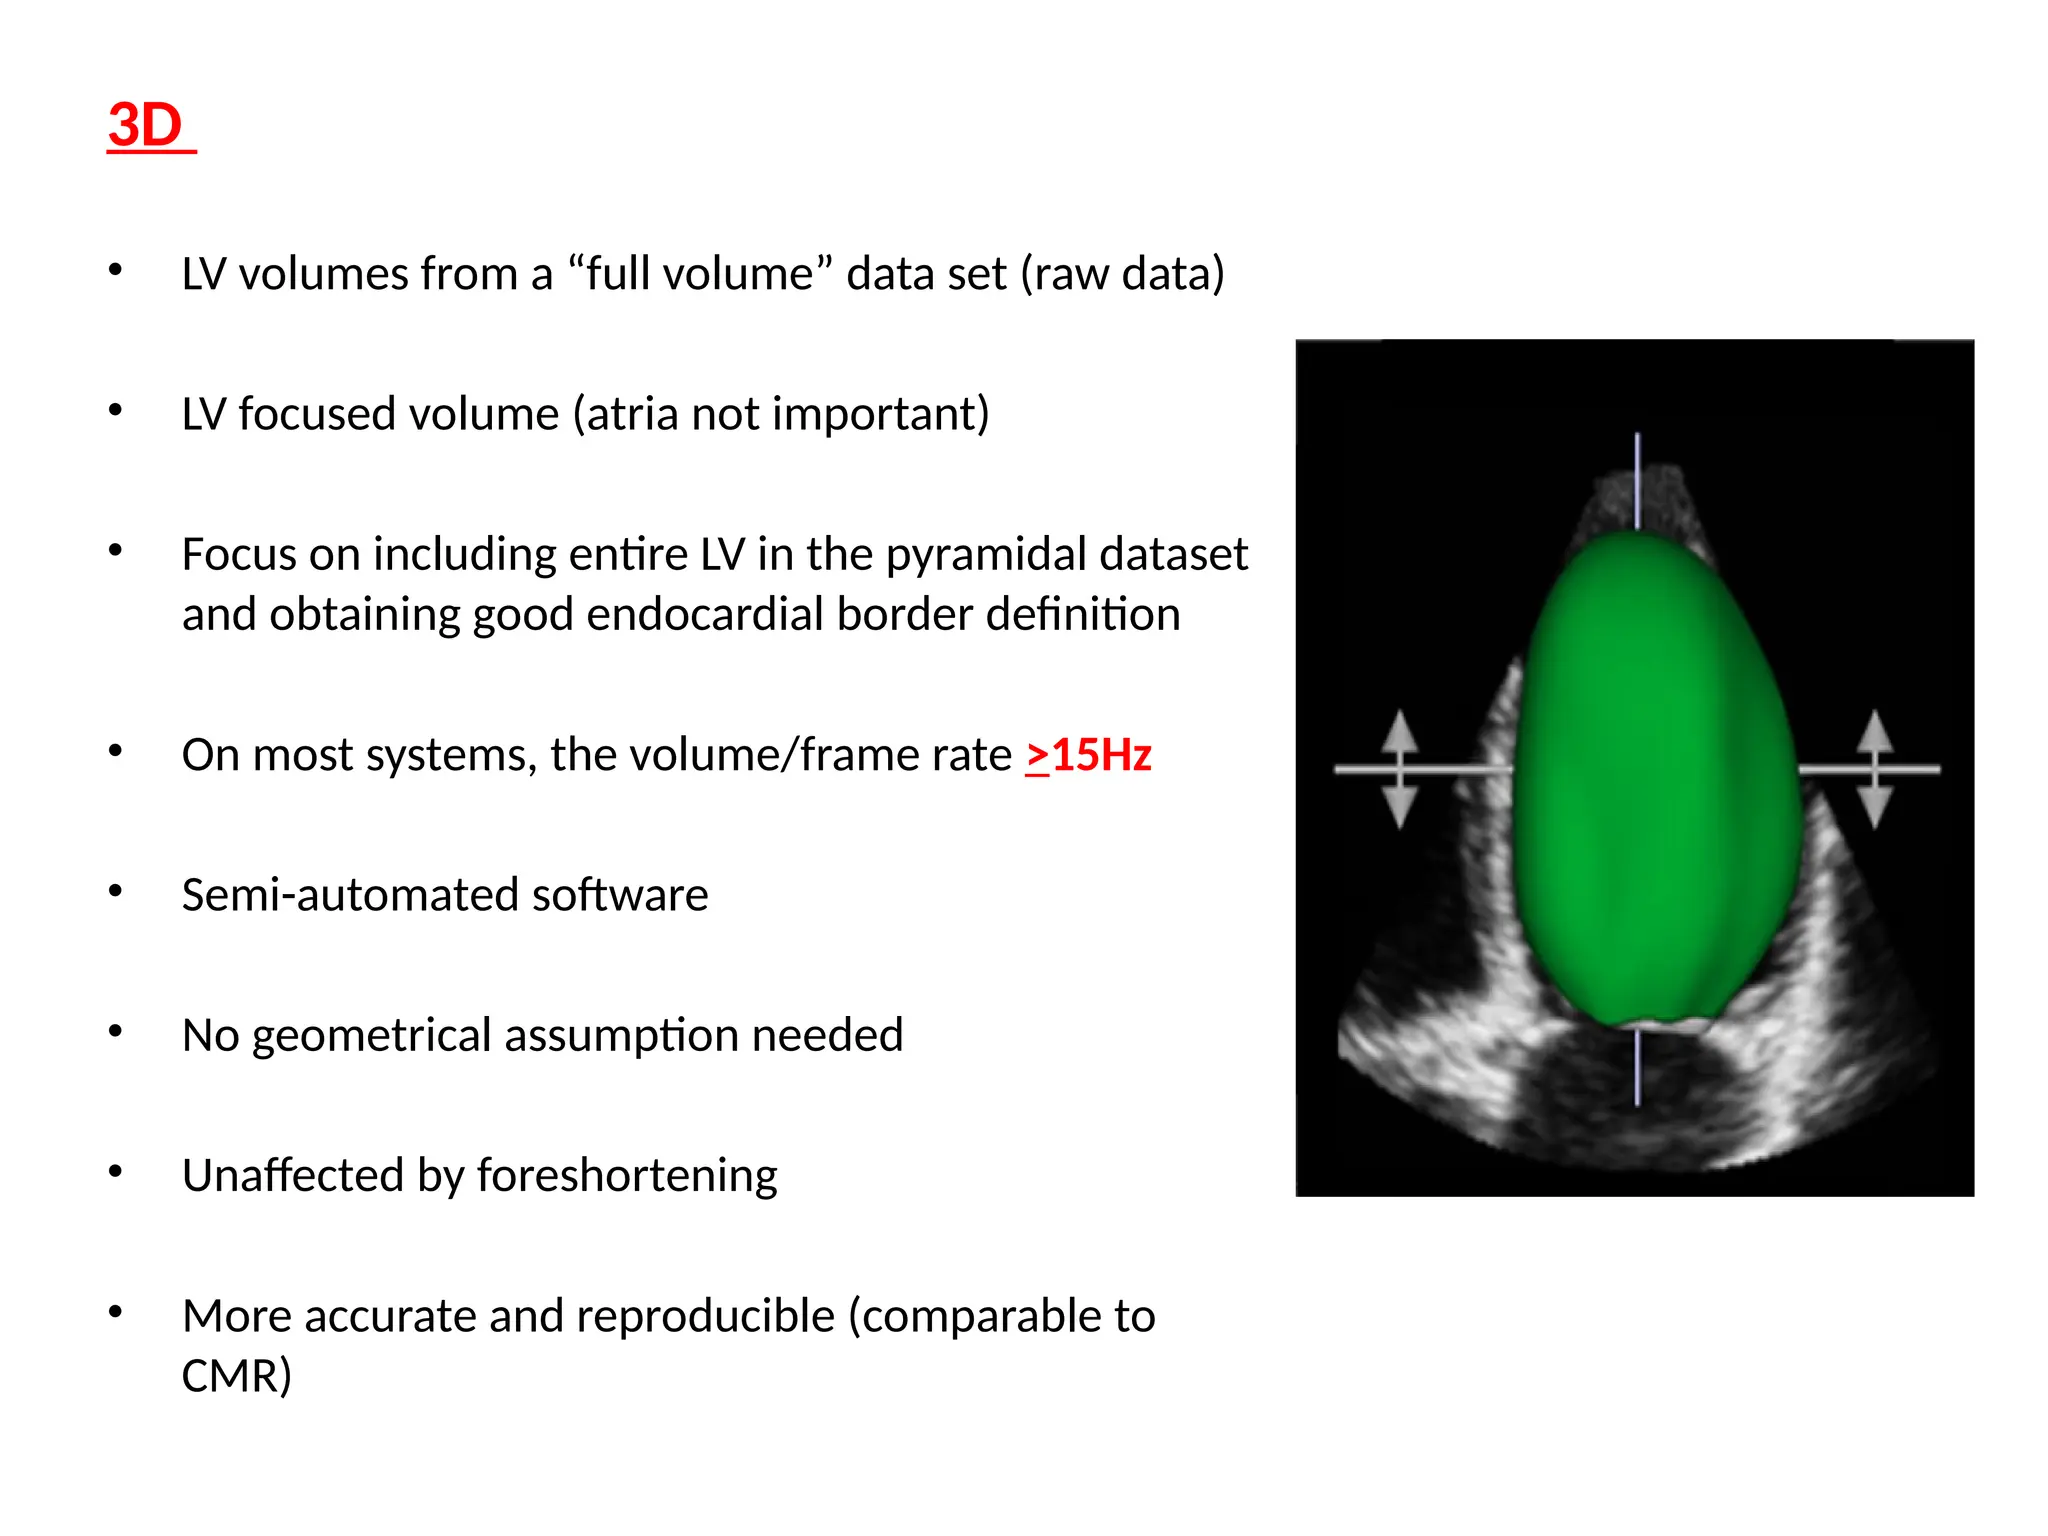
3D
• LV volumesfrom a “full volume” data set (raw data)
• LV focused volume (atria not important)
• Focus on including entire LV in the pyramidal dataset
and obtaining good endocardial border definition
• On most systems, the volume/frame rate >15Hz
• Semi-automated software
• No geometrical assumption needed
• Unaffected by foreshortening
• More accurate and reproducible (comparable to
CMR)
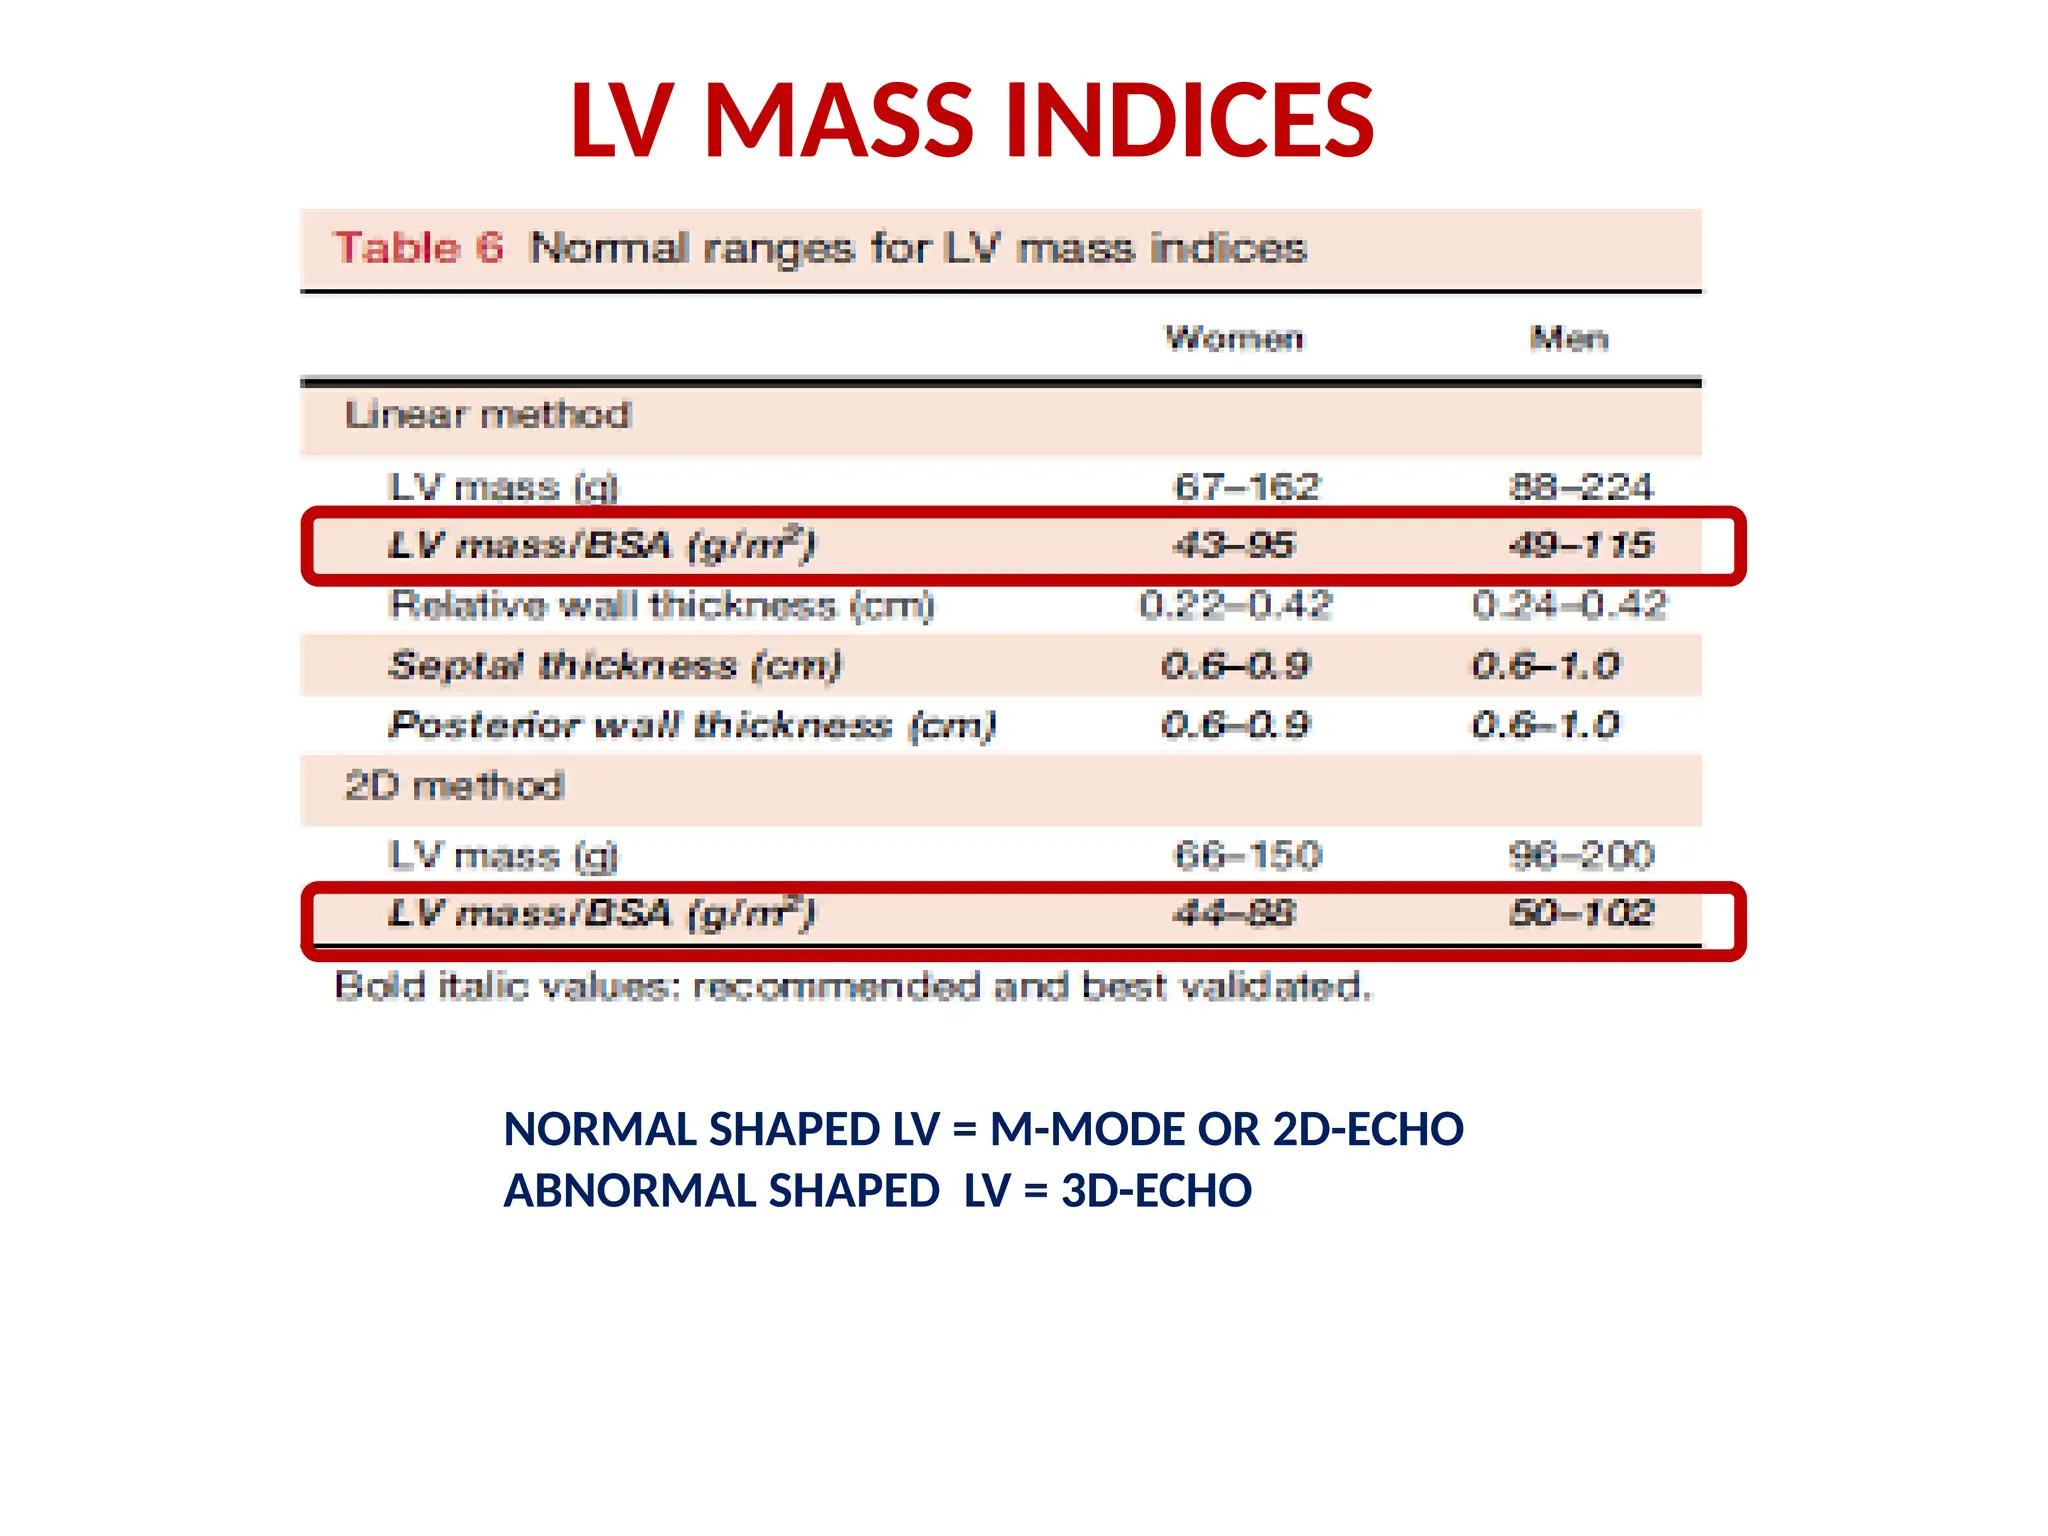
LV Mass
Linear Method(Cubed formula) – M MODE
Prolate ellipsoid assumption of LV, with long axis to short axis ratio 2:1
LVID, IVS, PW at end-Diastole,
LV mass = 0.8 x (1.04 x [ (IVS+LVID+PWT)3
- LVID3
] + 0.6 g
Fast and widely used
Wealth of published data
Demonstrated prognostic value
Fairly accurate in normally shaped ventricles
(i.e., systemic hypertension, aortic stenosis)
Simple for screening large populations
Over estimate LV mass
Inaccurate in asymmetric hypertrophy, DCM or disease with regional
variation in wall thickness
83.
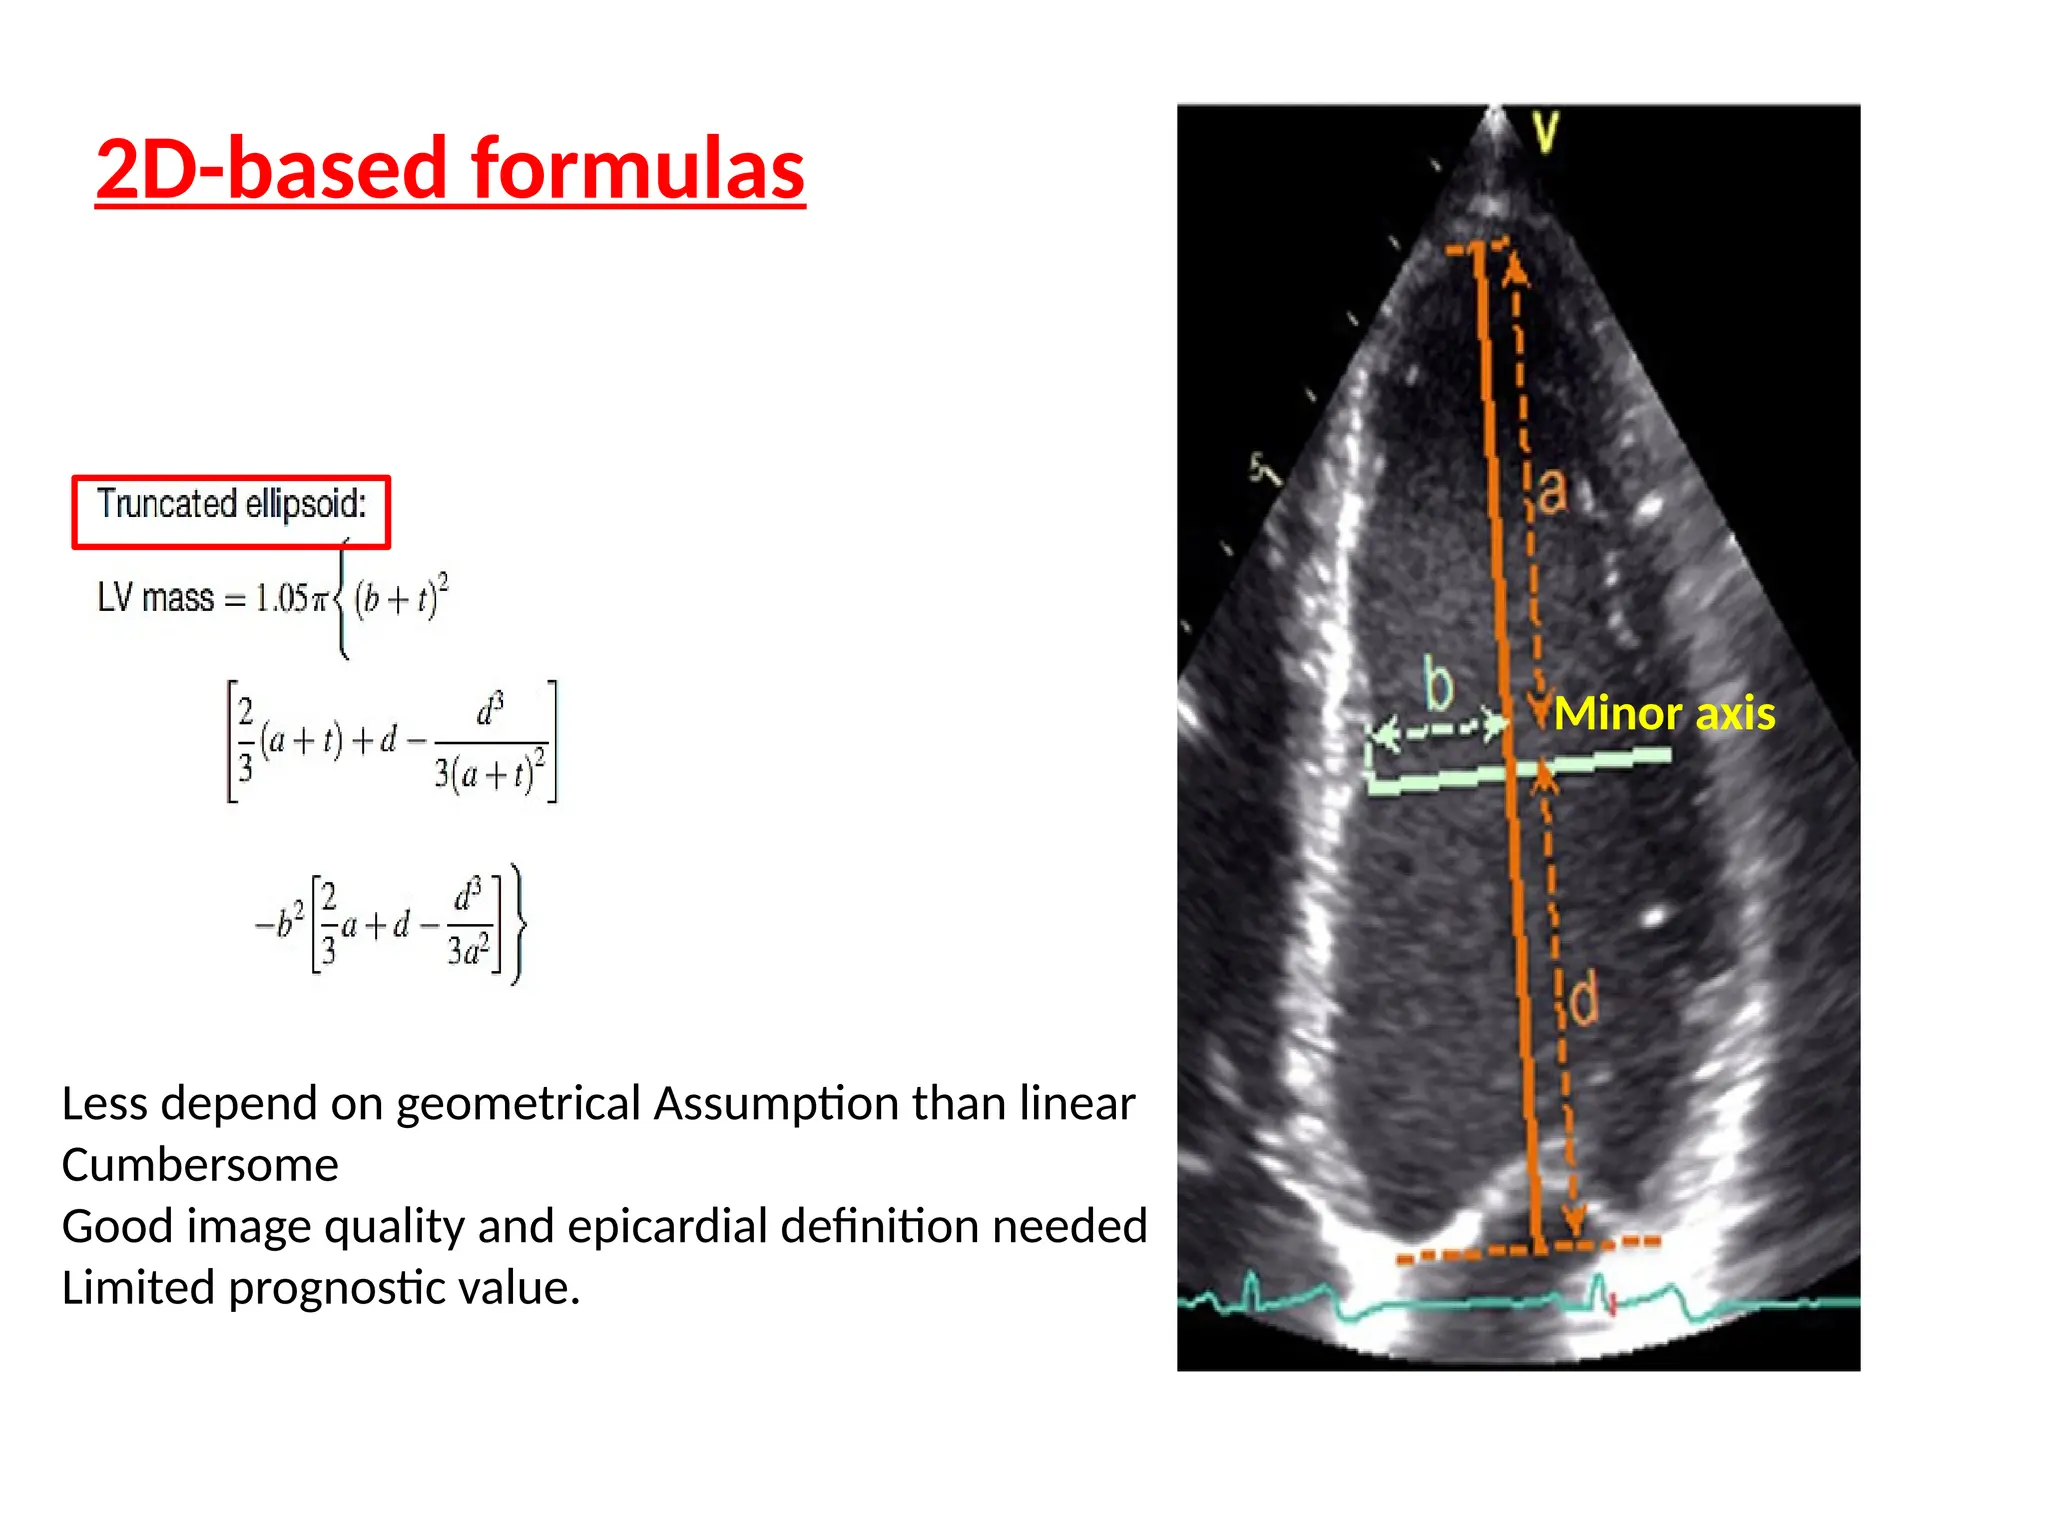
2D-based formulas
Less dependon geometrical Assumption than linear
Cumbersome
Good image quality and epicardial definition needed
Limited prognostic value.
Minor axis
84.
LV MASS (AREA-LENGTHMETHOD)
Am = A1-A2
(mean wall thickness from epicardial &
Endocardial cross section area) in PSAX at PM level
LV MASS = LV VOLUME X MYOCARDIAL DENSITY (1.05 gm/mL)
LV MASS = (LV EPICARDIAL VOLUME – LV ENDOCARDIAL
VOLUME)X1.05 = LV MYOCARDIAL VOLUMEX1.05
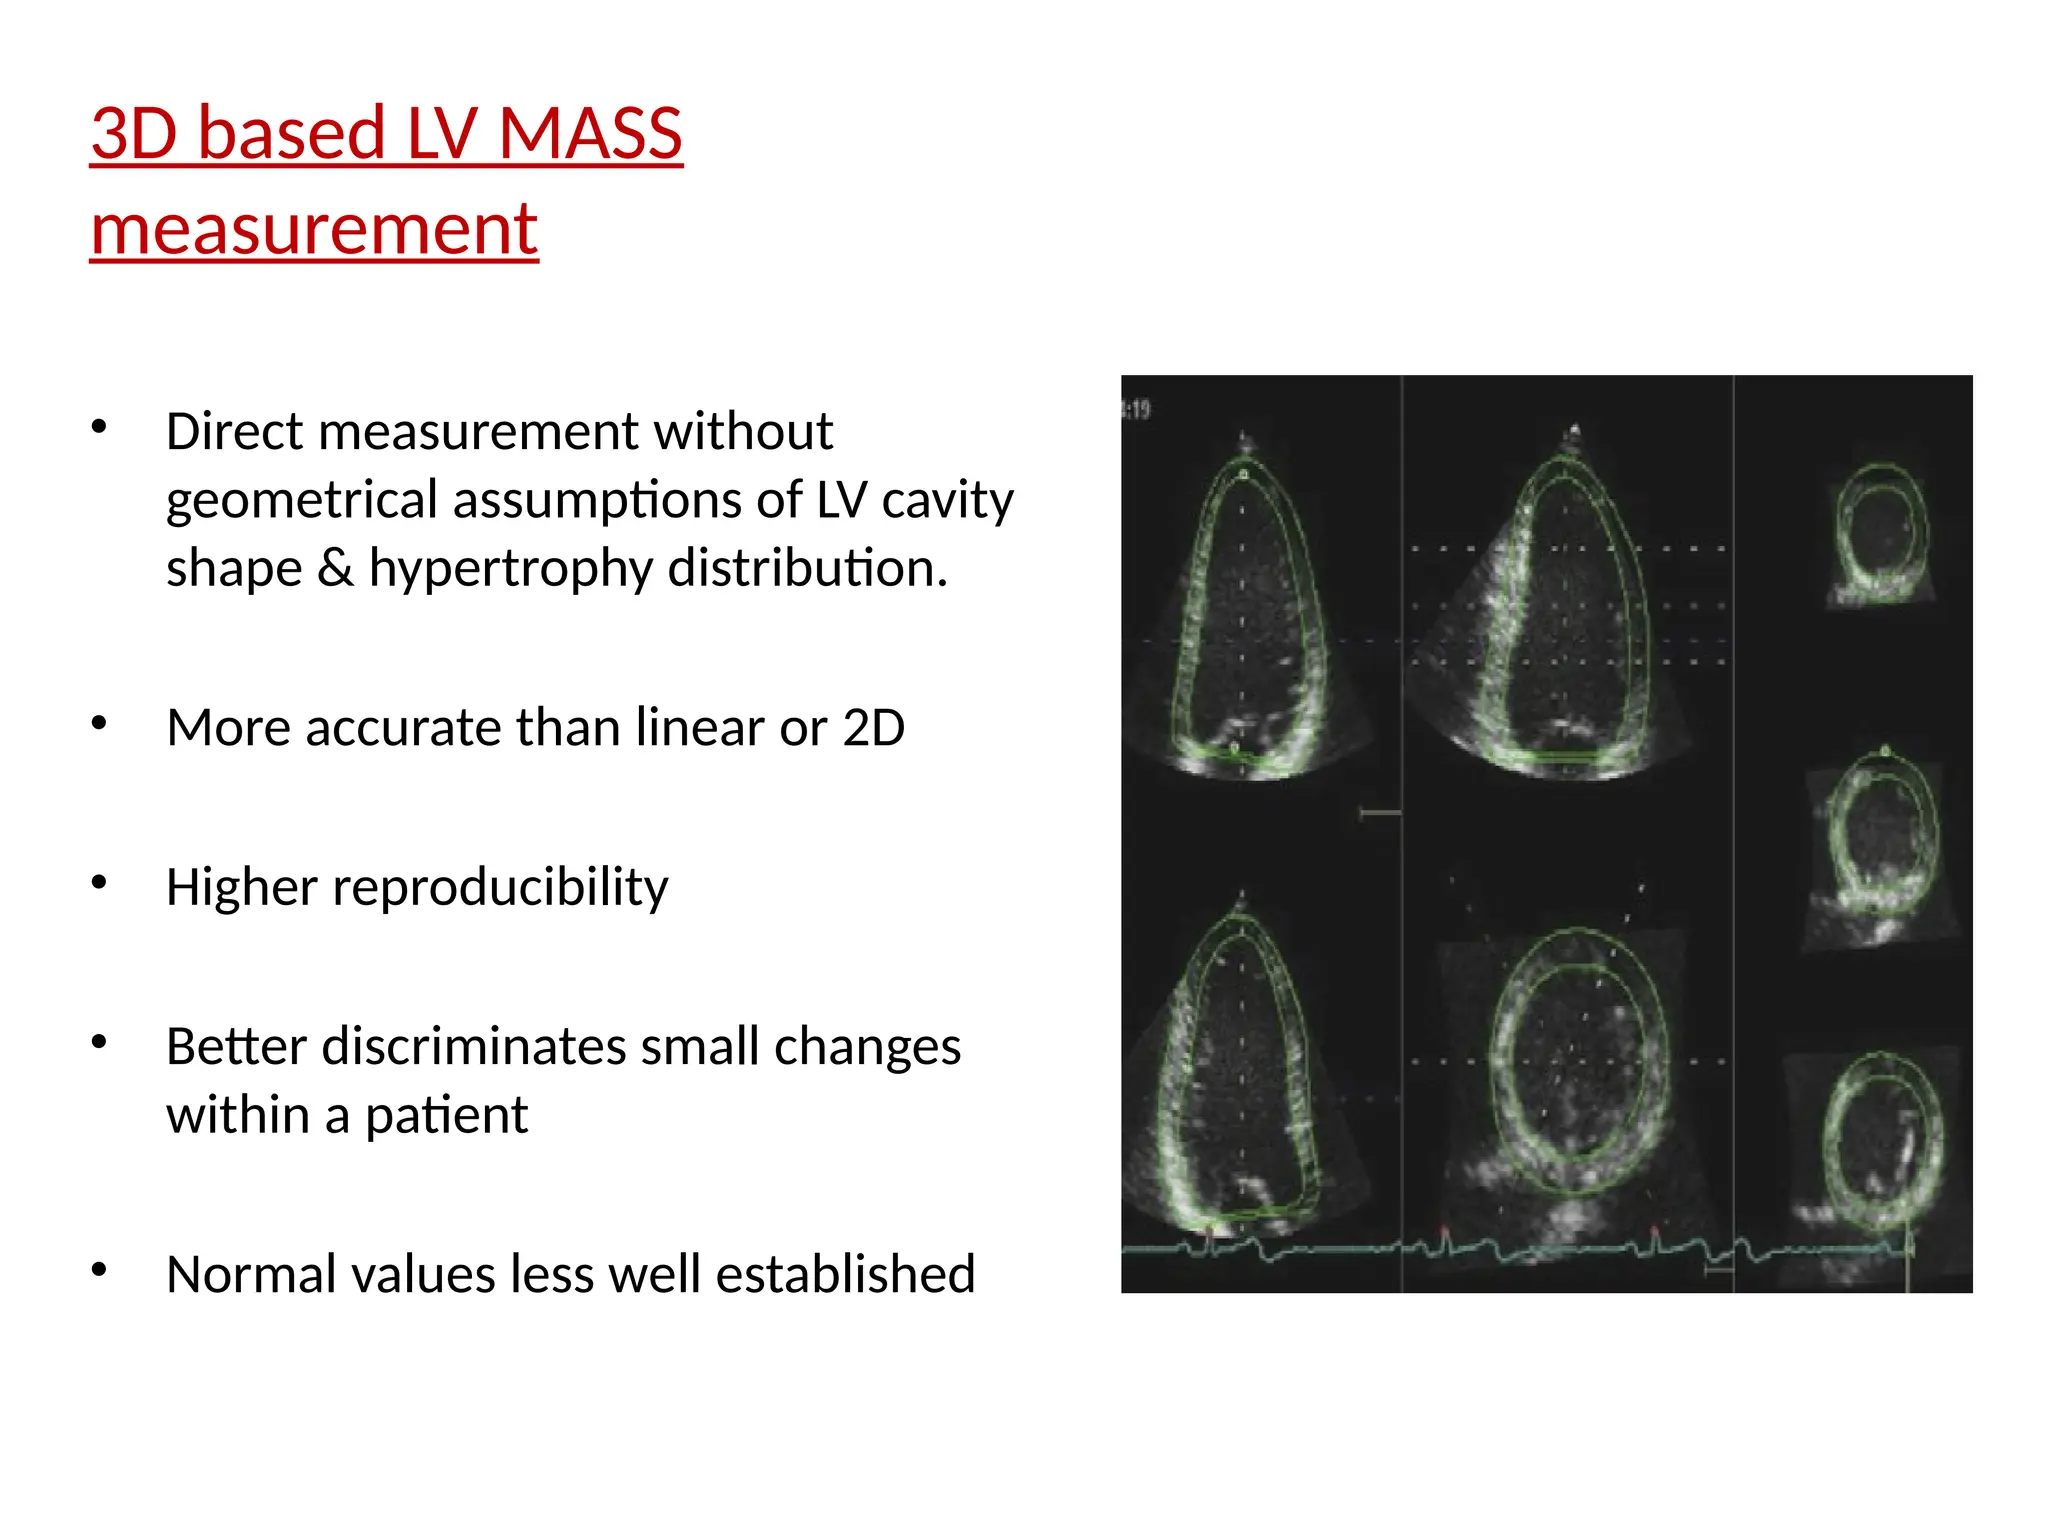
3D based LVMASS
measurement
• Direct measurement without
geometrical assumptions of LV cavity
shape & hypertrophy distribution.
• More accurate than linear or 2D
• Higher reproducibility
• Better discriminates small changes
within a patient
• Normal values less well established
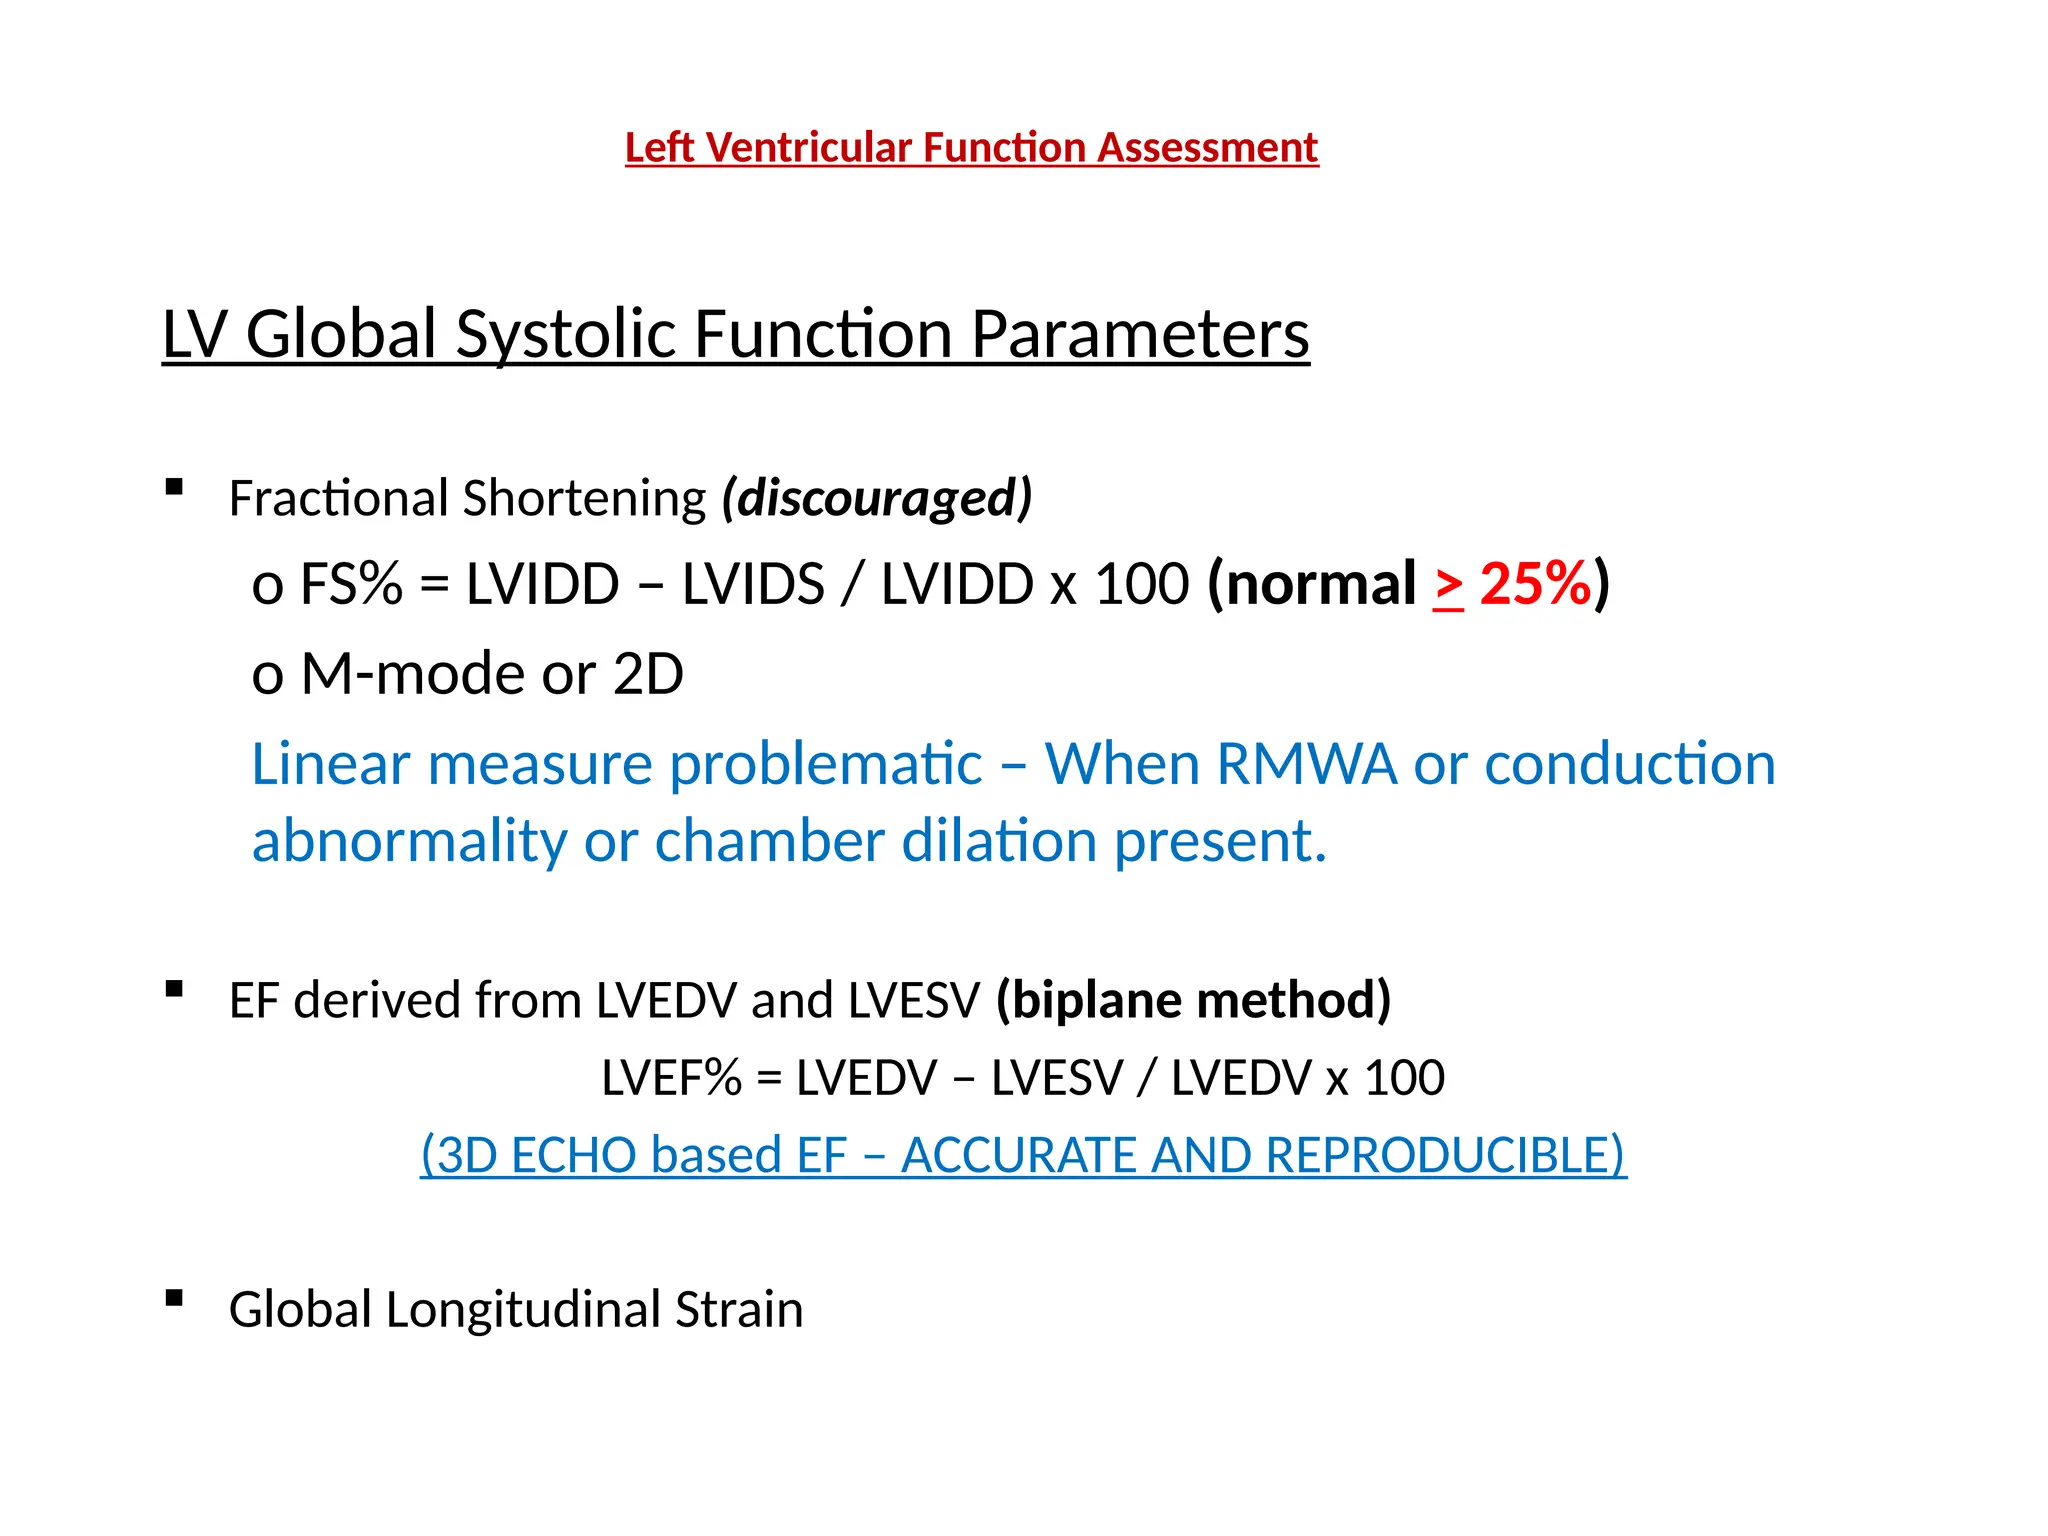
Left Ventricular FunctionAssessment
LV Global Systolic Function Parameters
Fractional Shortening (discouraged)
o FS% = LVIDD – LVIDS / LVIDD x 100 (normal > 25%)
o M-mode or 2D
Linear measure problematic – When RMWA or conduction
abnormality or chamber dilation present.
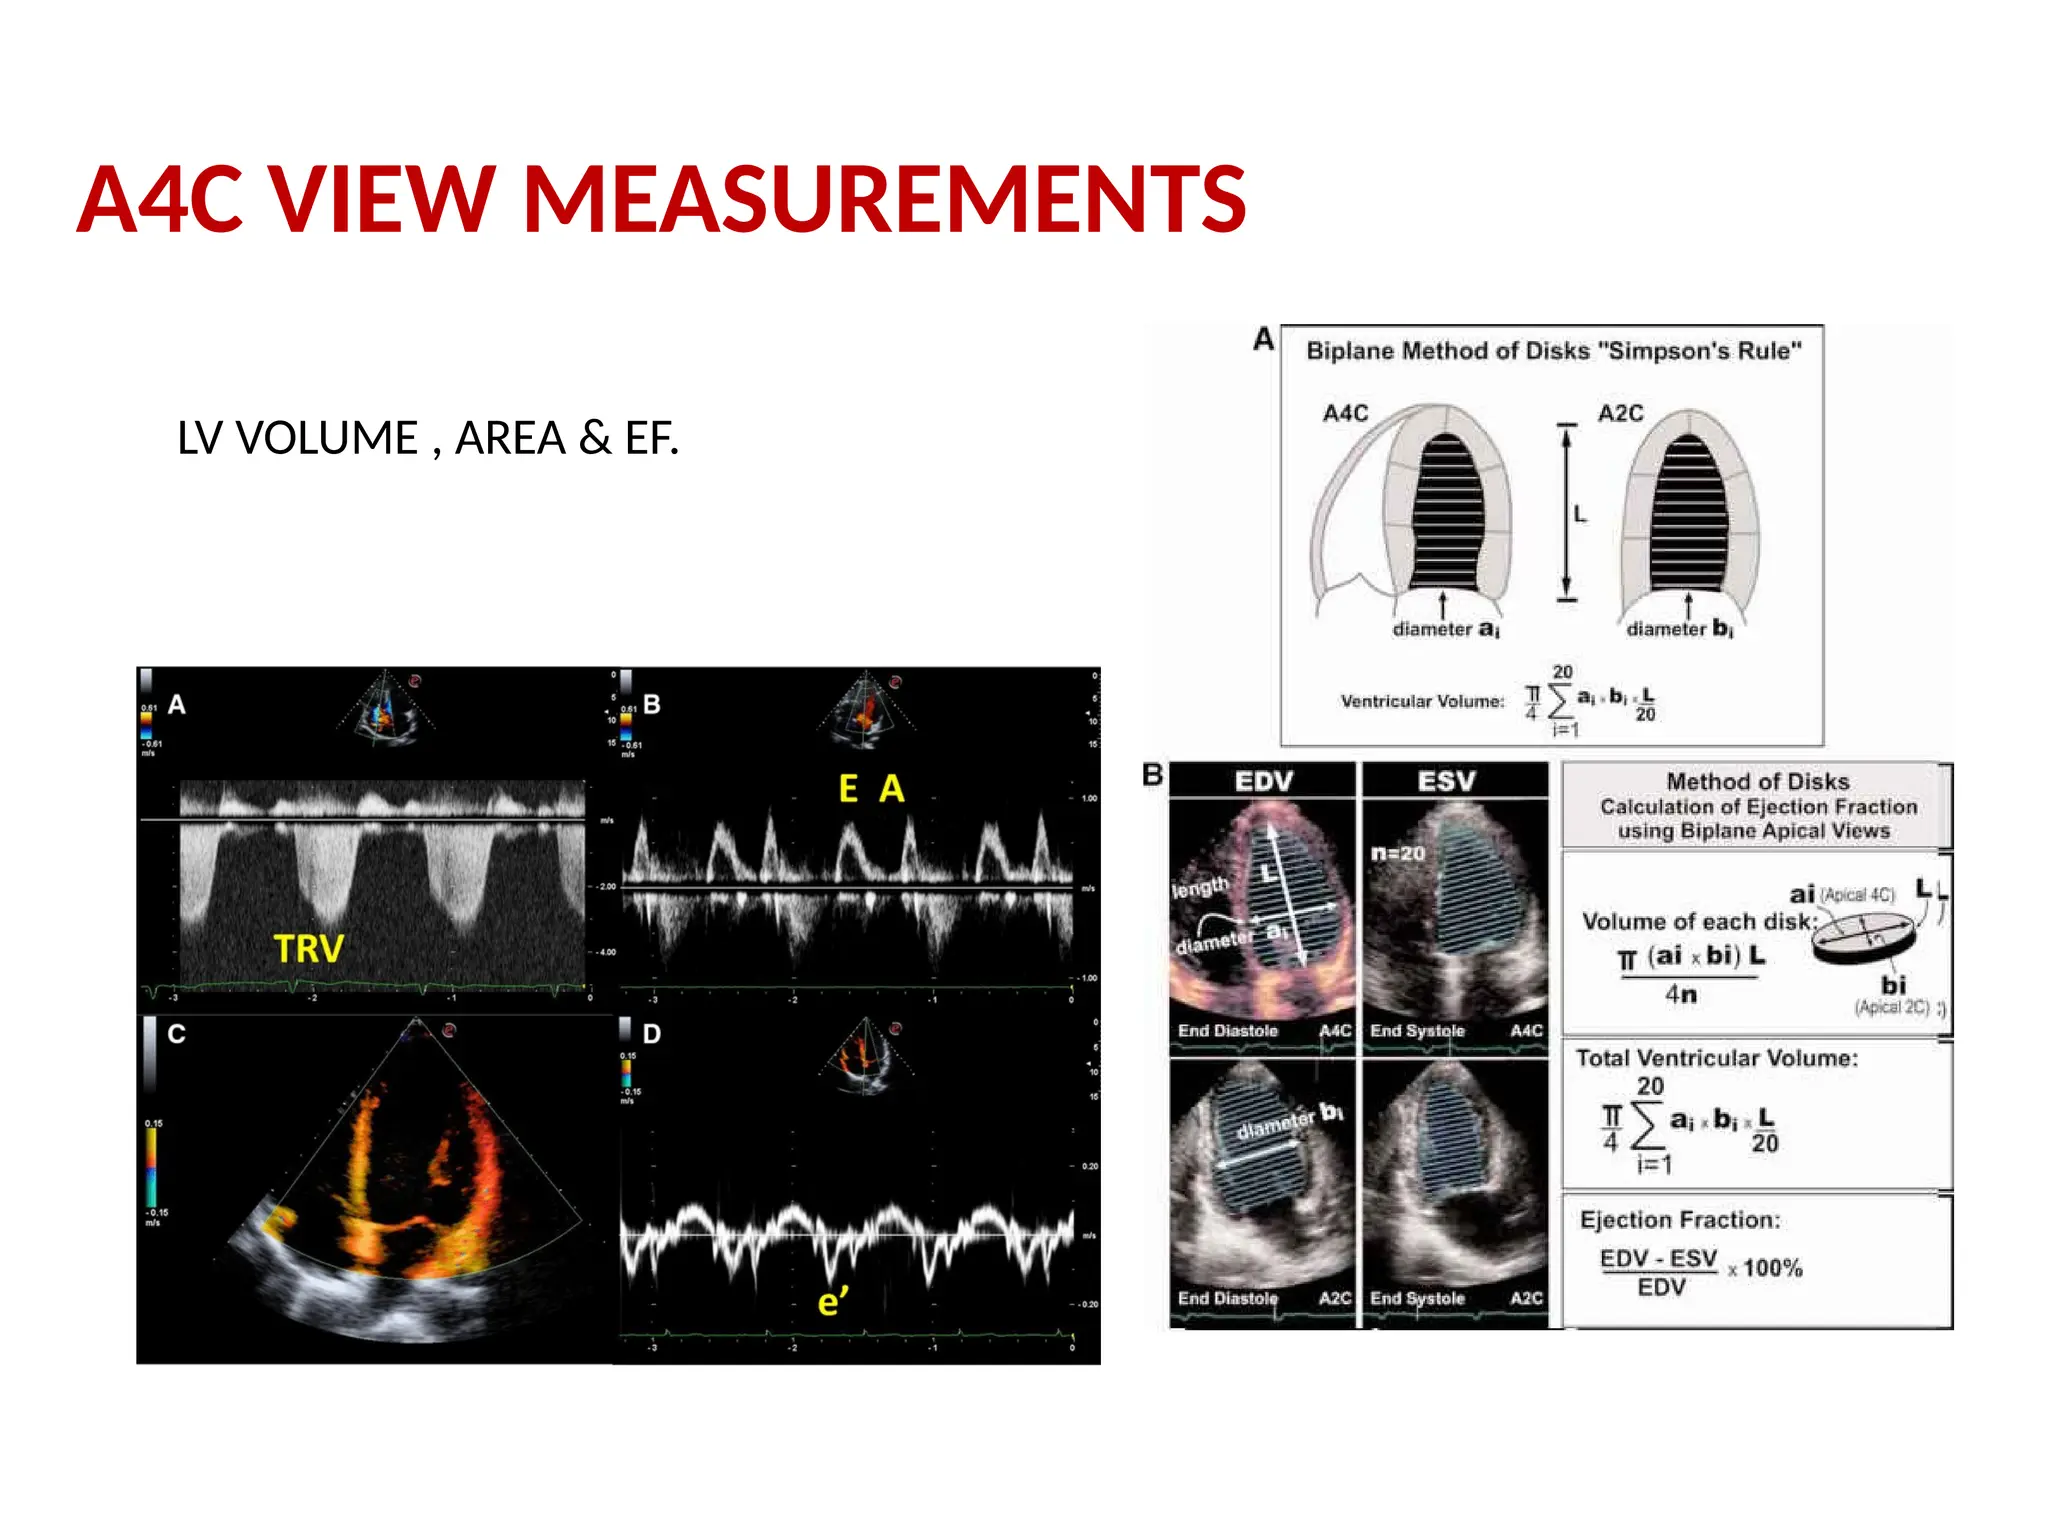
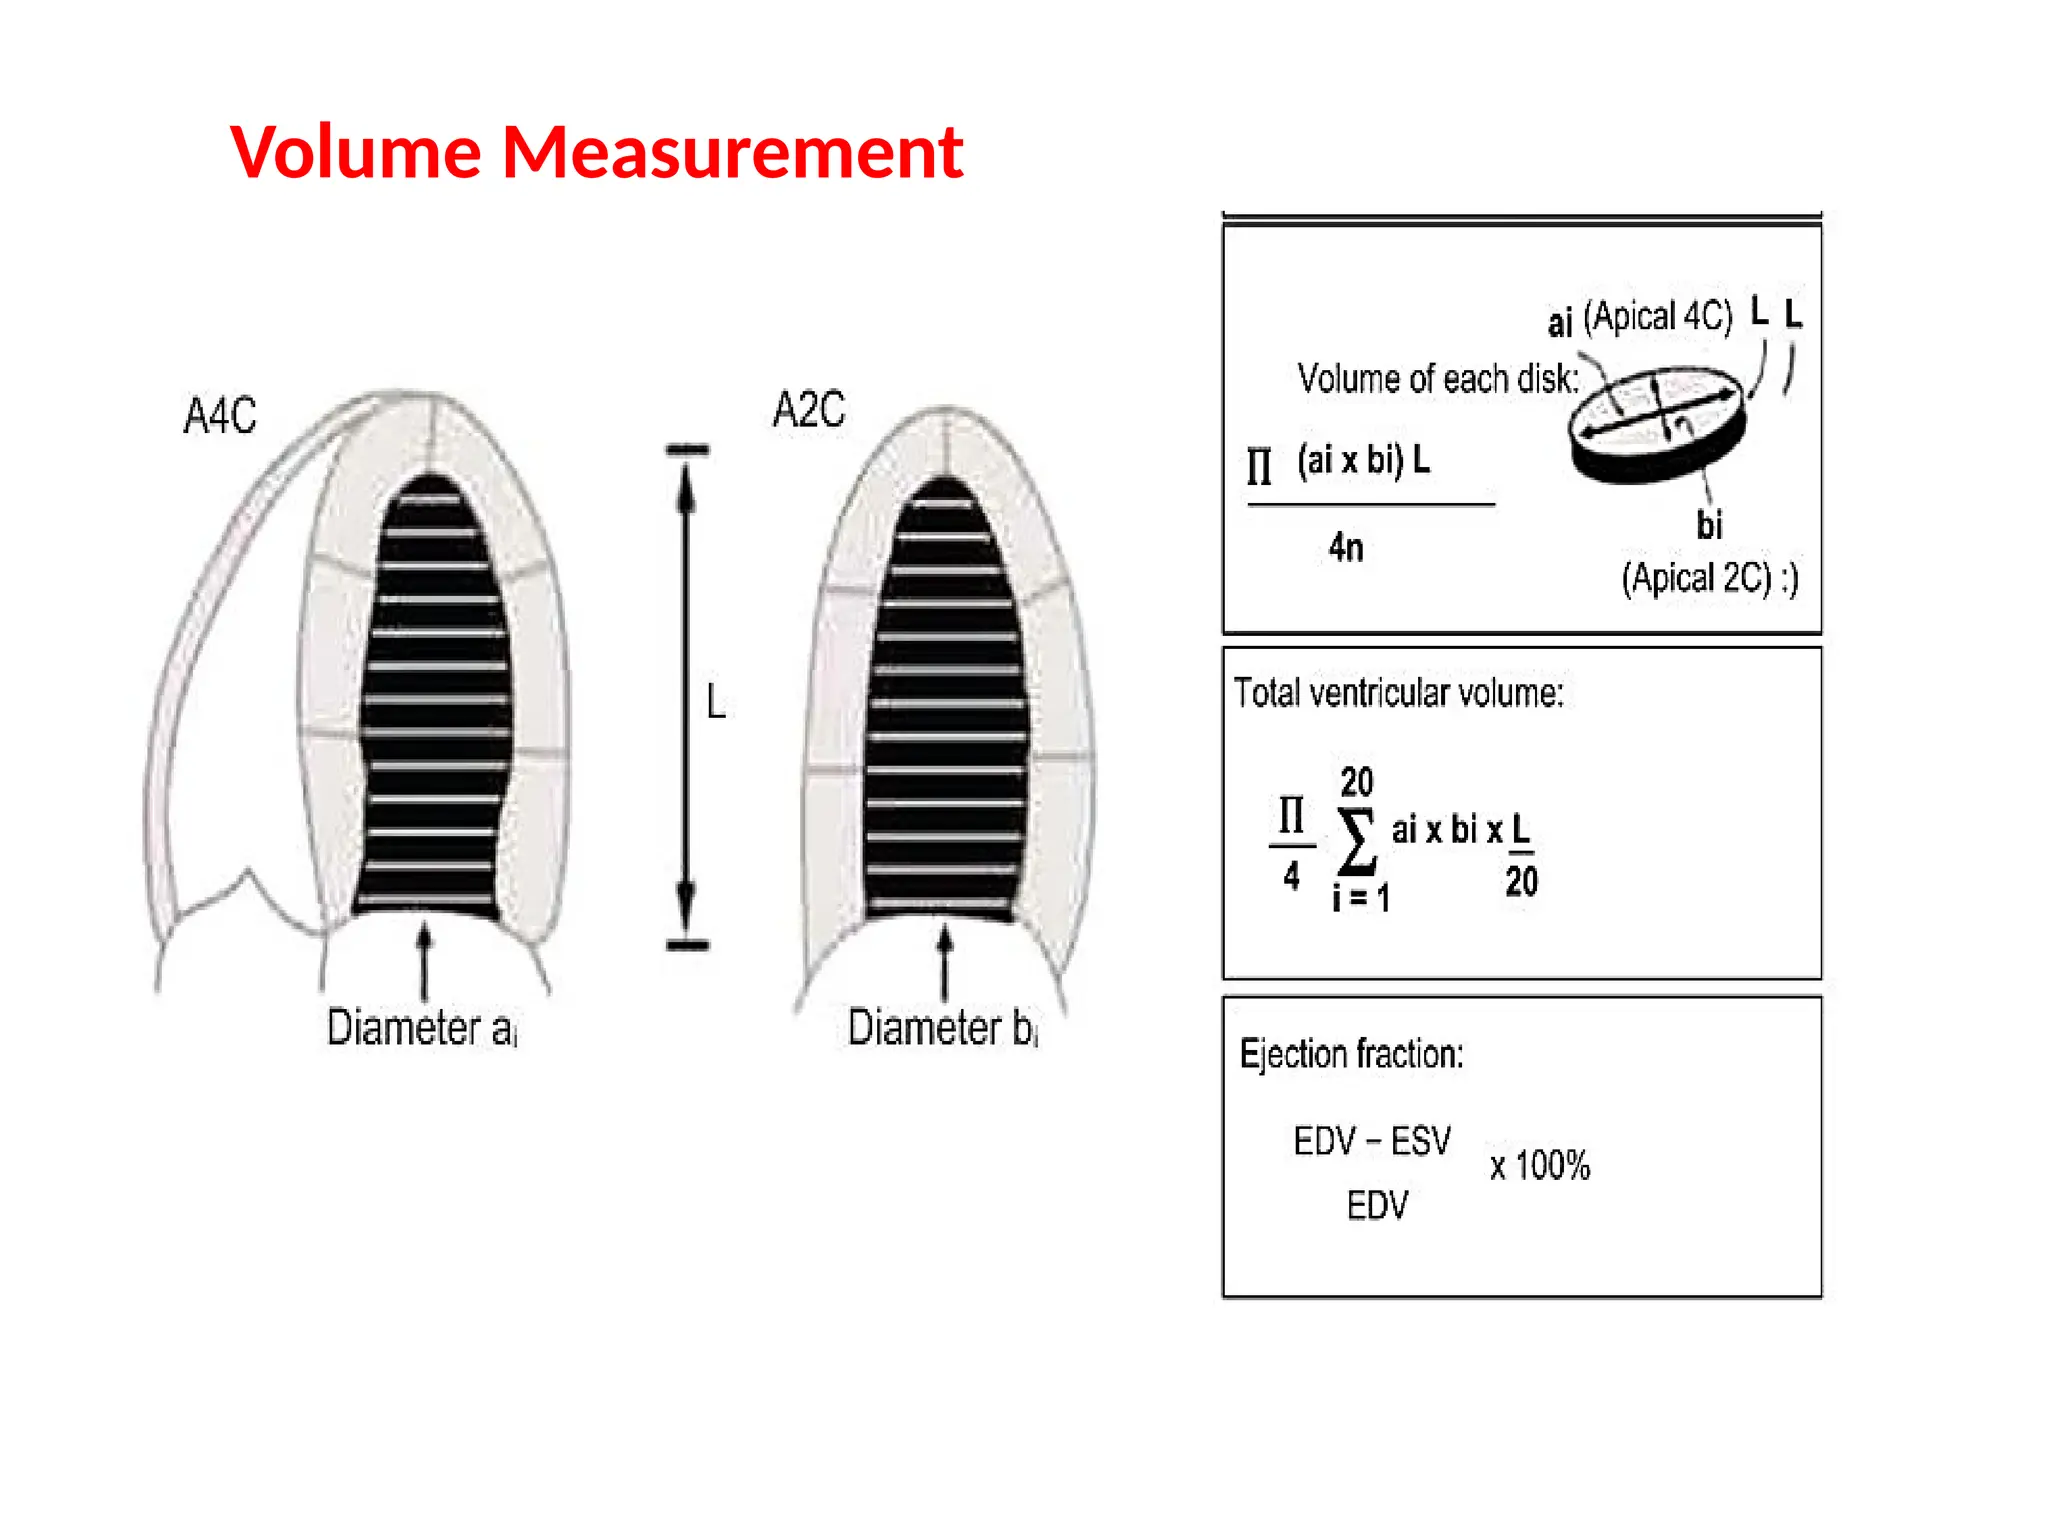
EF derived from LVEDV and LVESV (biplane method)
LVEF% = LVEDV – LVESV / LVEDV x 100
(3D ECHO based EF – ACCURATE AND REPRODUCIBLE)
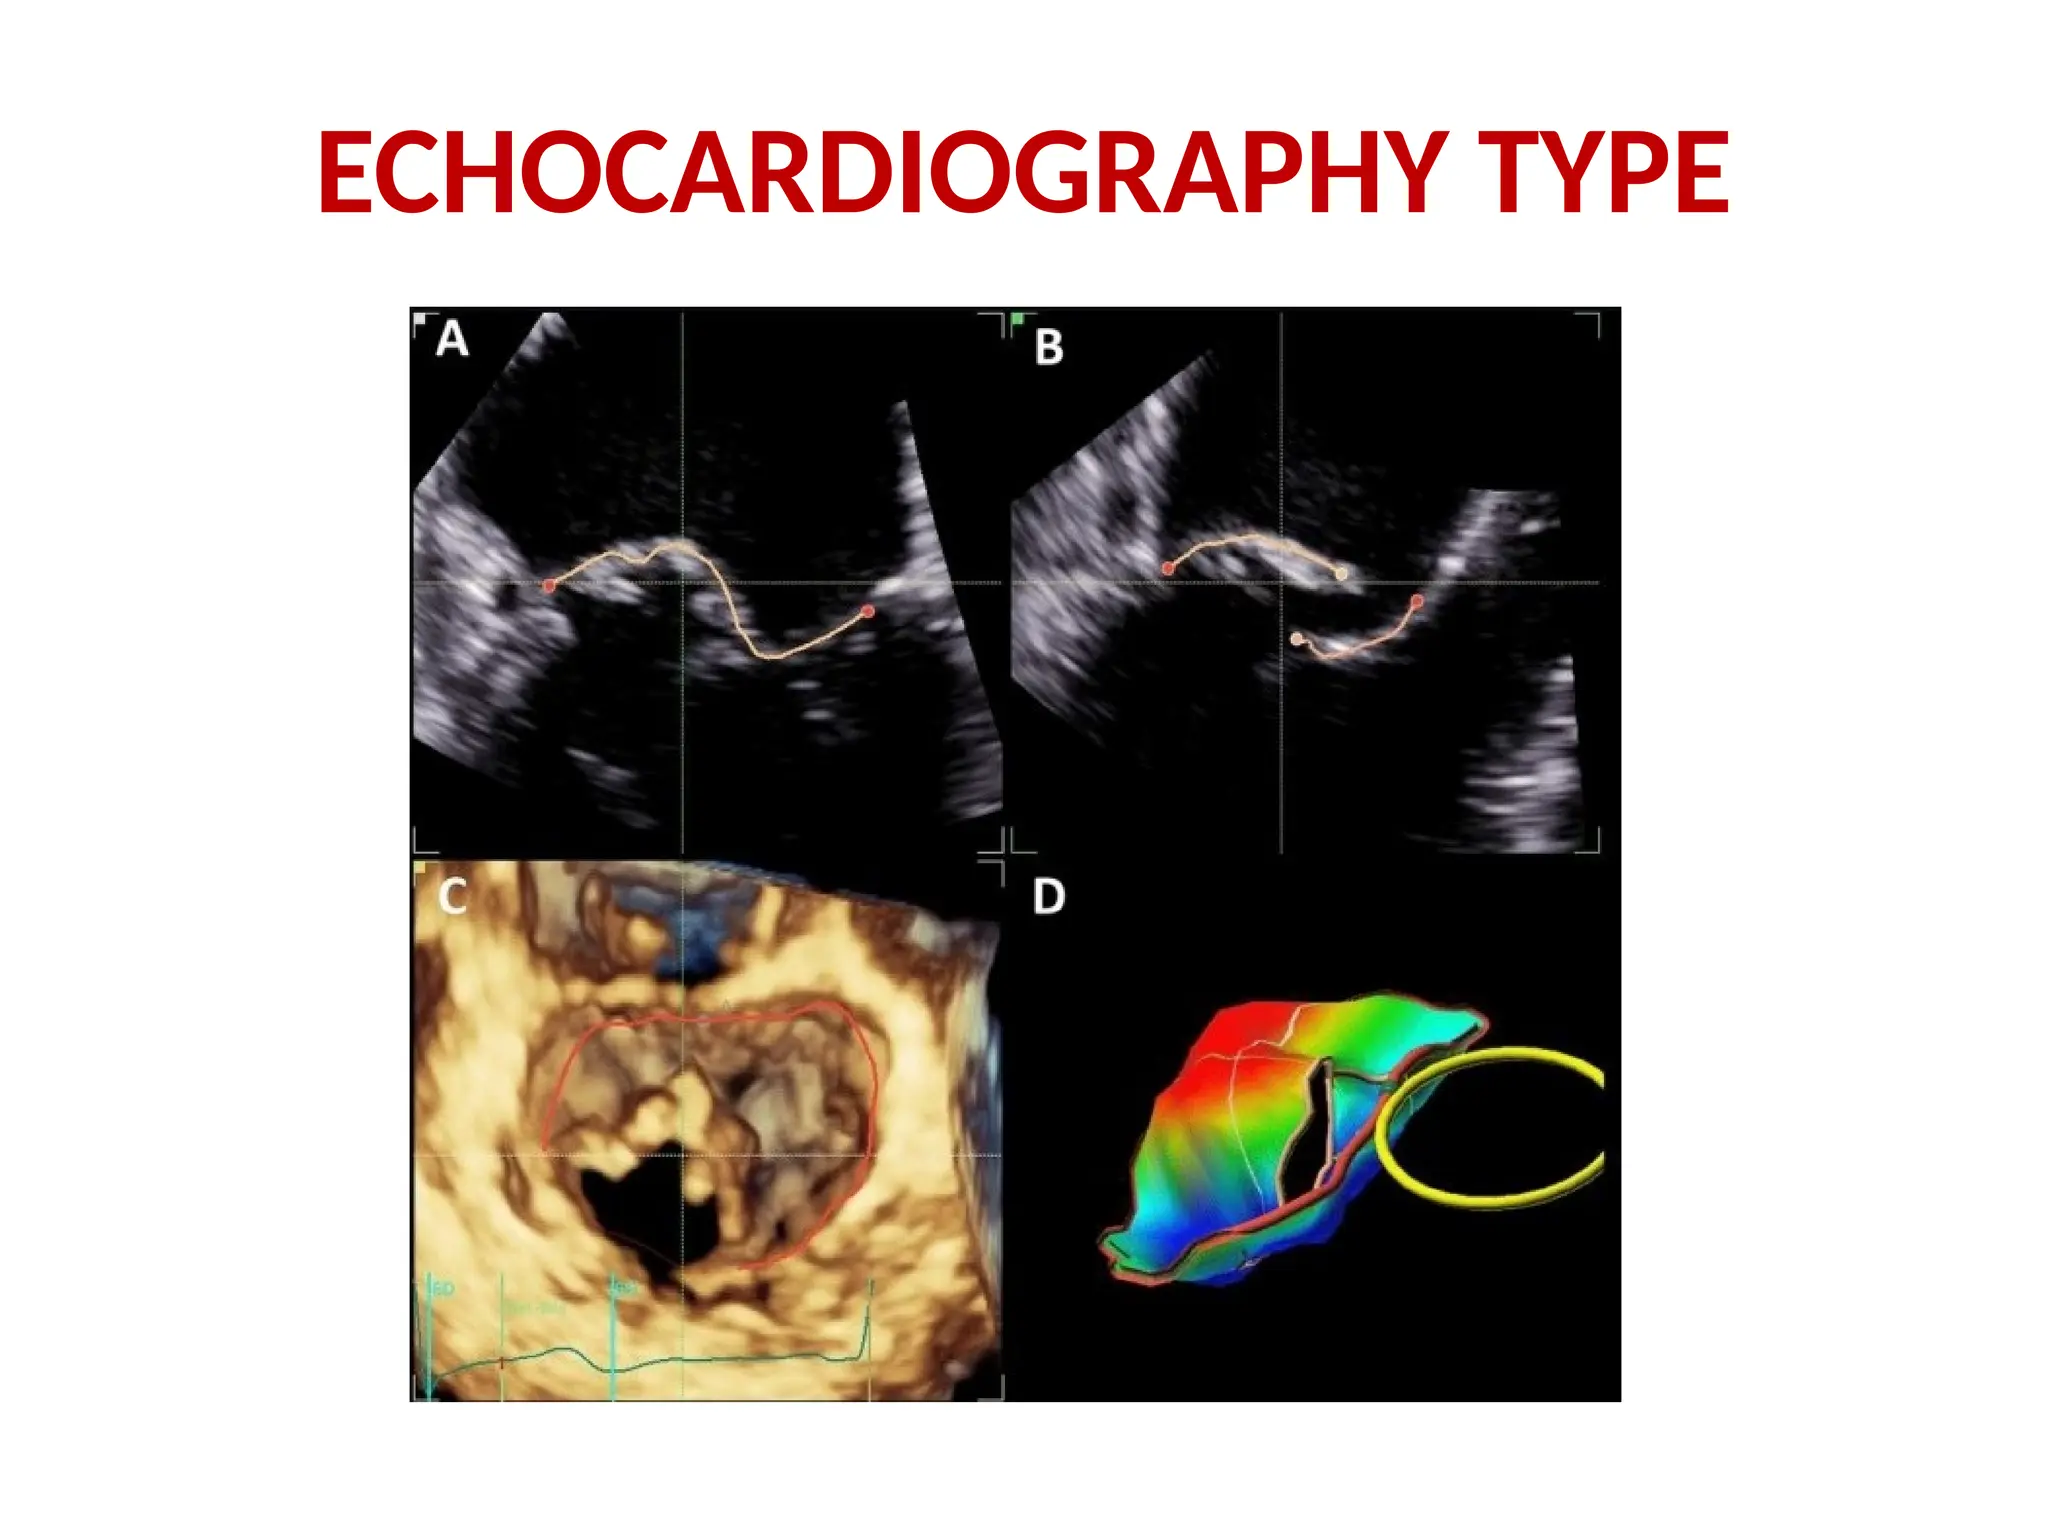
Global Longitudinal Strain
92.
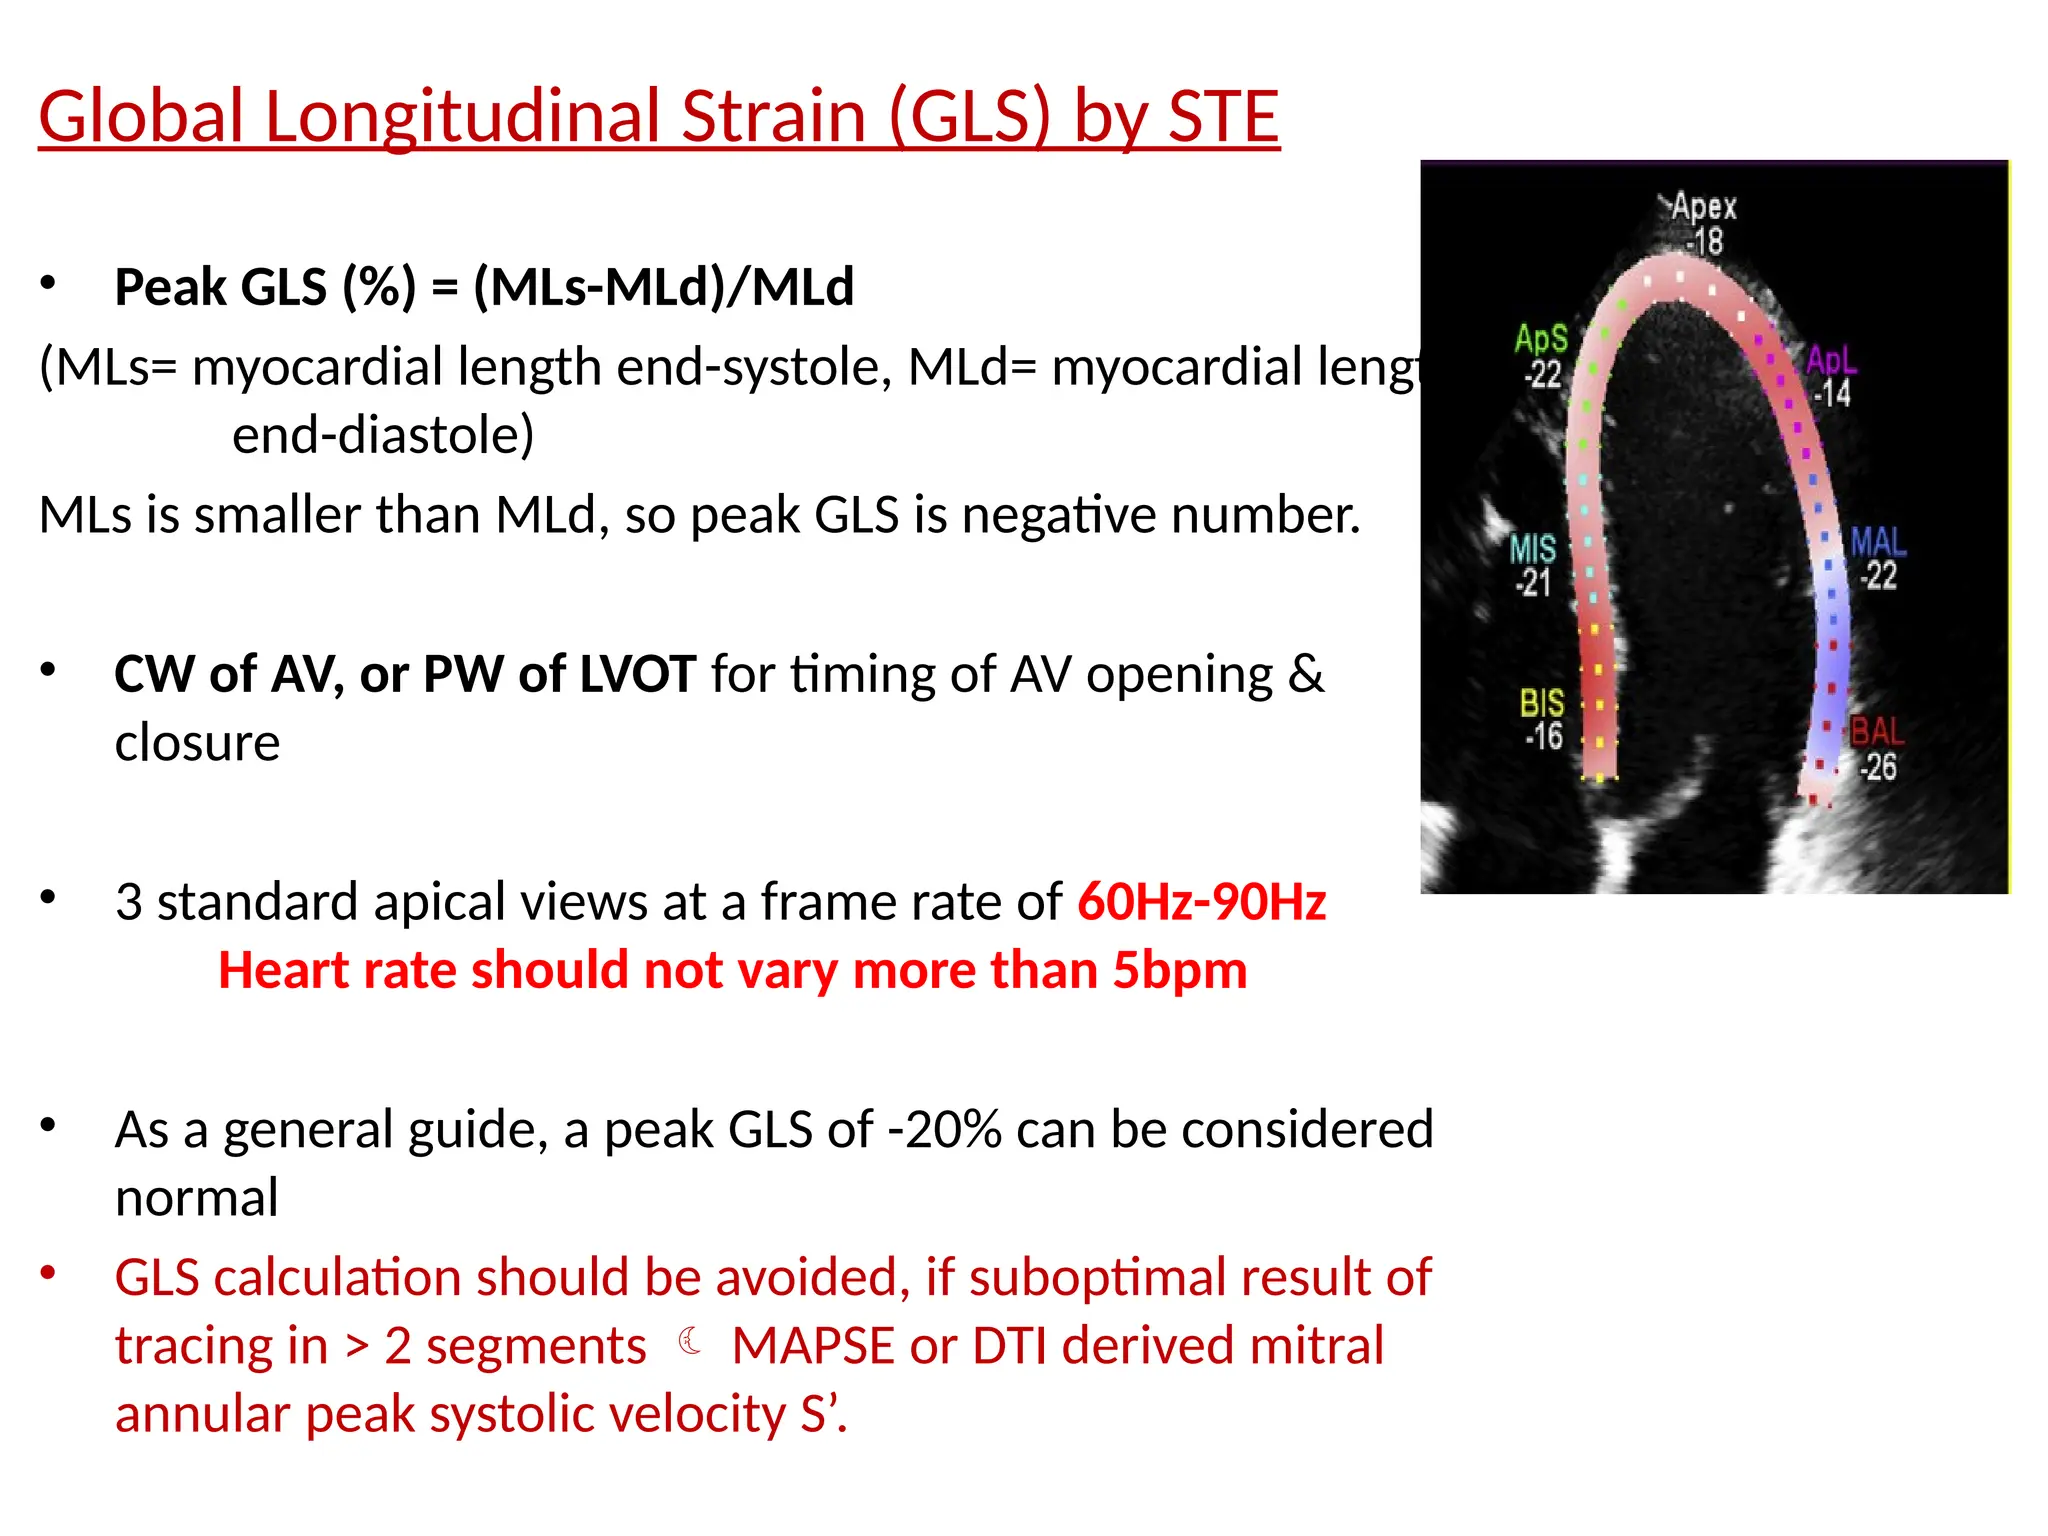
Global Longitudinal Strain(GLS) by STE
• Peak GLS (%) = (MLs-MLd)/MLd
(MLs= myocardial length end-systole, MLd= myocardial length
end-diastole)
MLs is smaller than MLd, so peak GLS is negative number.
• CW of AV, or PW of LVOT for timing of AV opening &
closure
• 3 standard apical views at a frame rate of 60Hz-90Hz
Heart rate should not vary more than 5bpm
• As a general guide, a peak GLS of -20% can be considered
normal
• GLS calculation should be avoided, if suboptimal result of
tracing in > 2 segments MAPSE or DTI derived mitral
annular peak systolic velocity S’.
93.
Normal LV strainvalues - meta-analysis
and individual recent publications
Takigiku K, Takeuchi M, Izumi C, Yuda S, Sakata K, Ohte N, et al. Normal range of left
ventricular 2-dimensional strain: Japanese Ultrasound Speckle Tracking of the Left
Ventricle (JUSTICE) study. Circ J 2012;76:2623-32.
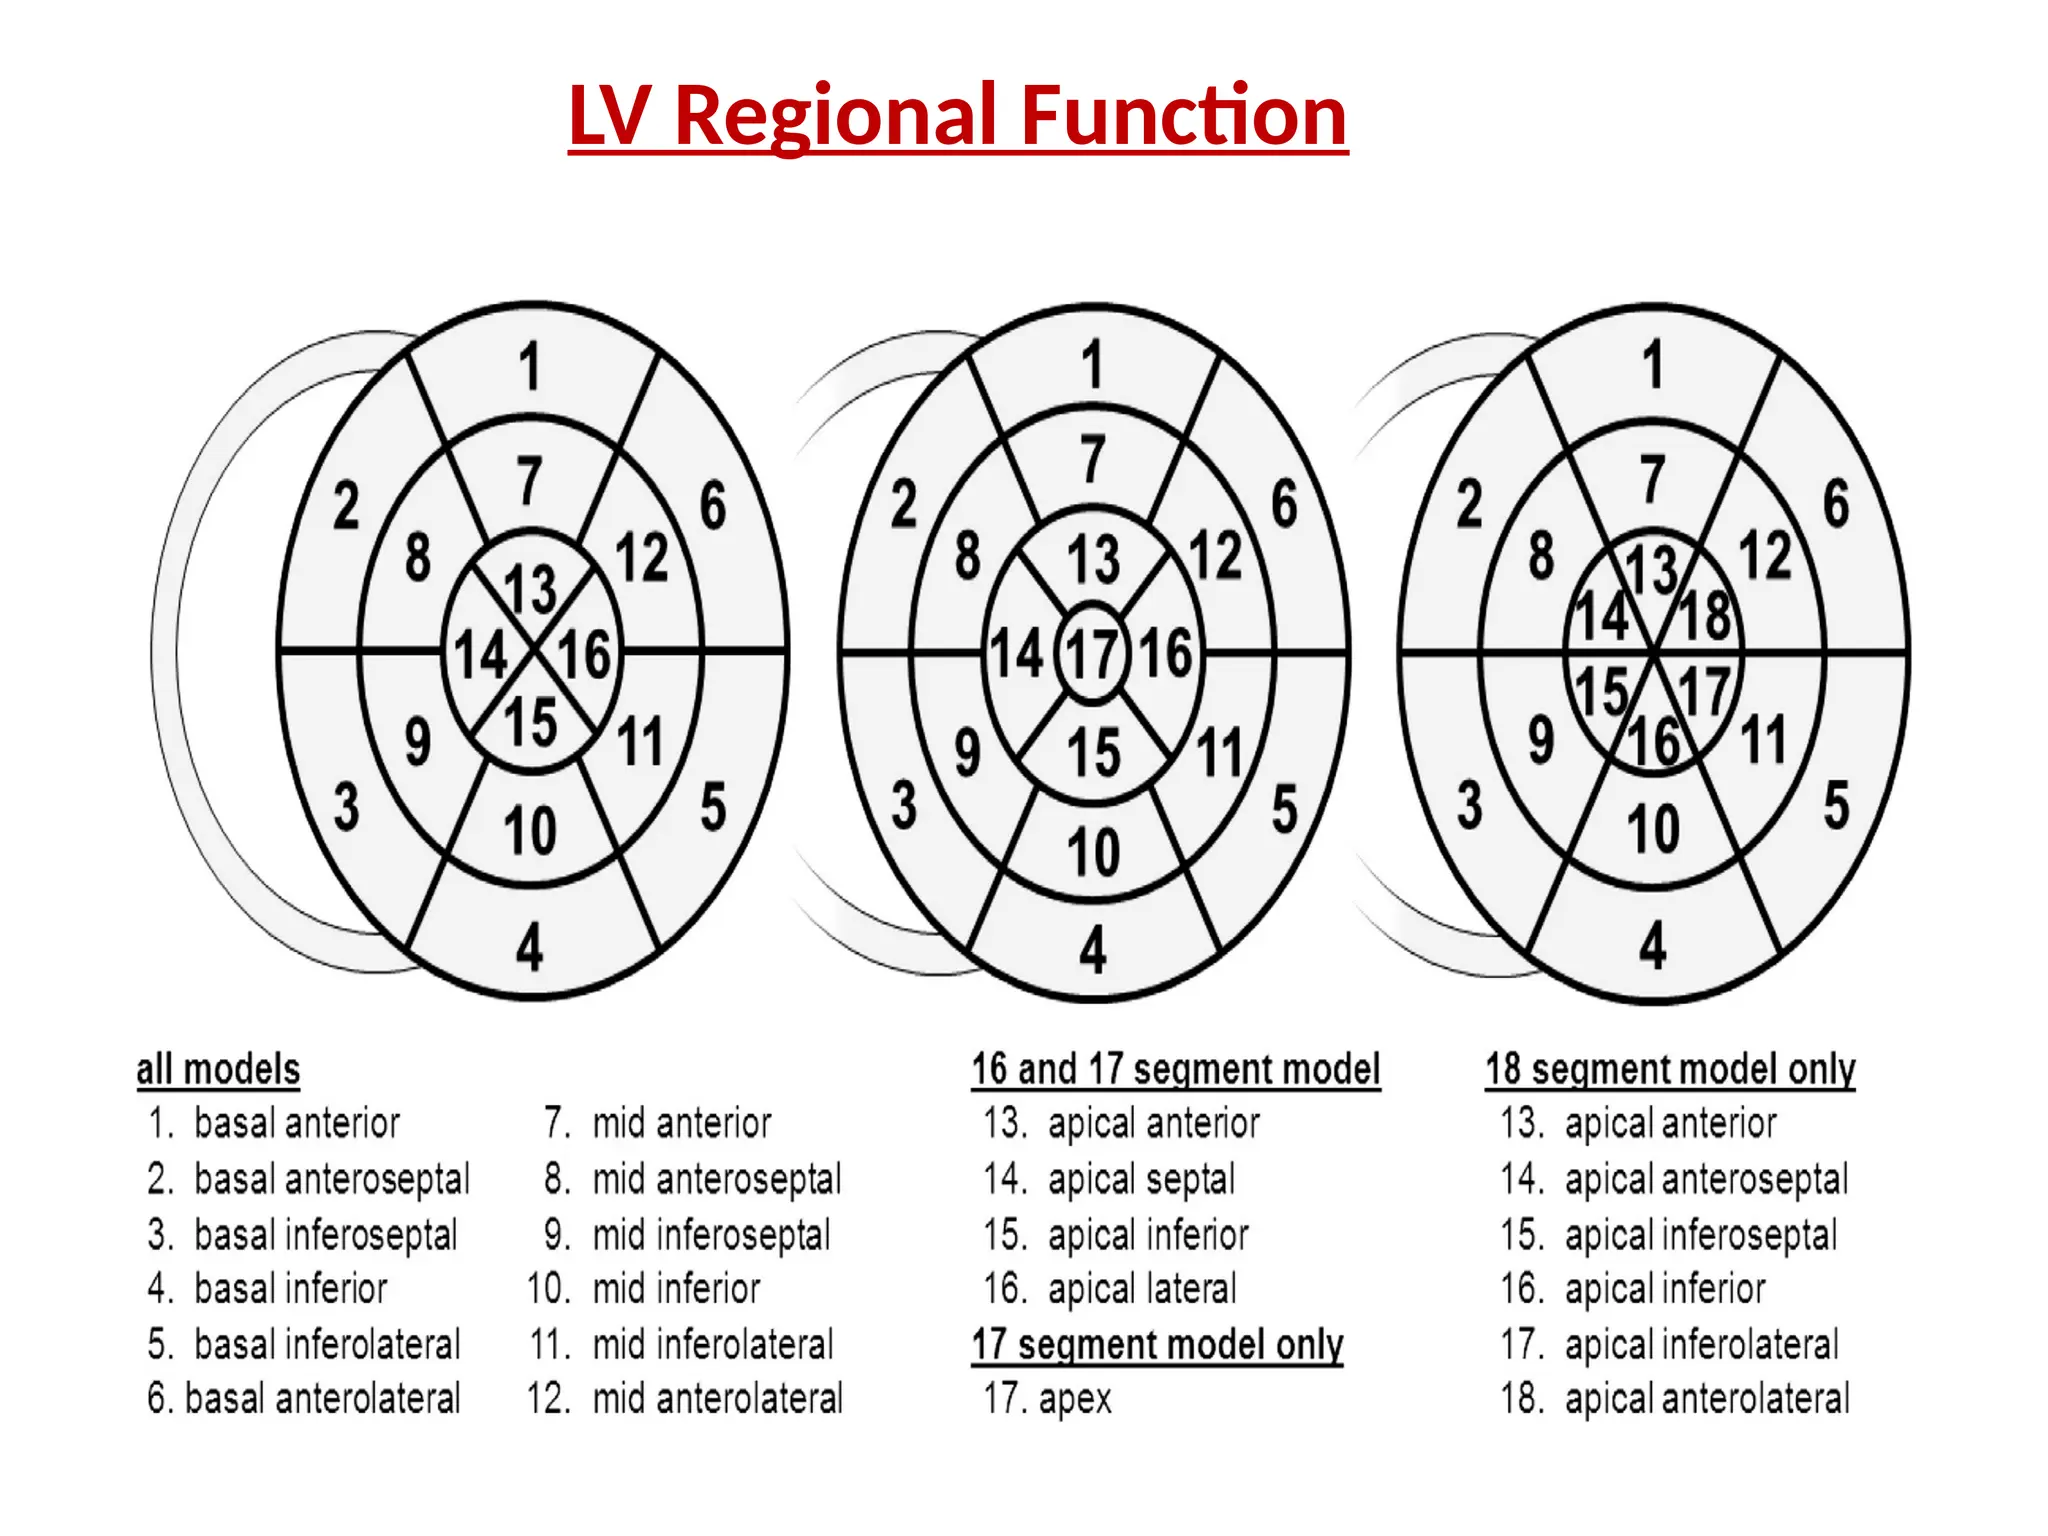
17-SEGMENT MODEL
• Apexdivided into 5 segments - septal, inferior, lateral,
anterior, and ‘‘apical cap’’ (myocardium beyond the end of
LV cavity)
• May be used for perfusion studies or comparison b/w
different imaging modalities, specifically SPECT, PET, and
CMR
• Apical cap not included (16 segment model) for wall
motion or regional strain
98.
RV SIZE ANDFUNCTION
Essential views for imaging and assessment:
Left PLAX
Left PSAX
Left parasternal RV inflow view
Apical 4-chamber view
Focused apical 4-chamber RV view
Modified apical 4-chamber view
Subcostal views
99.
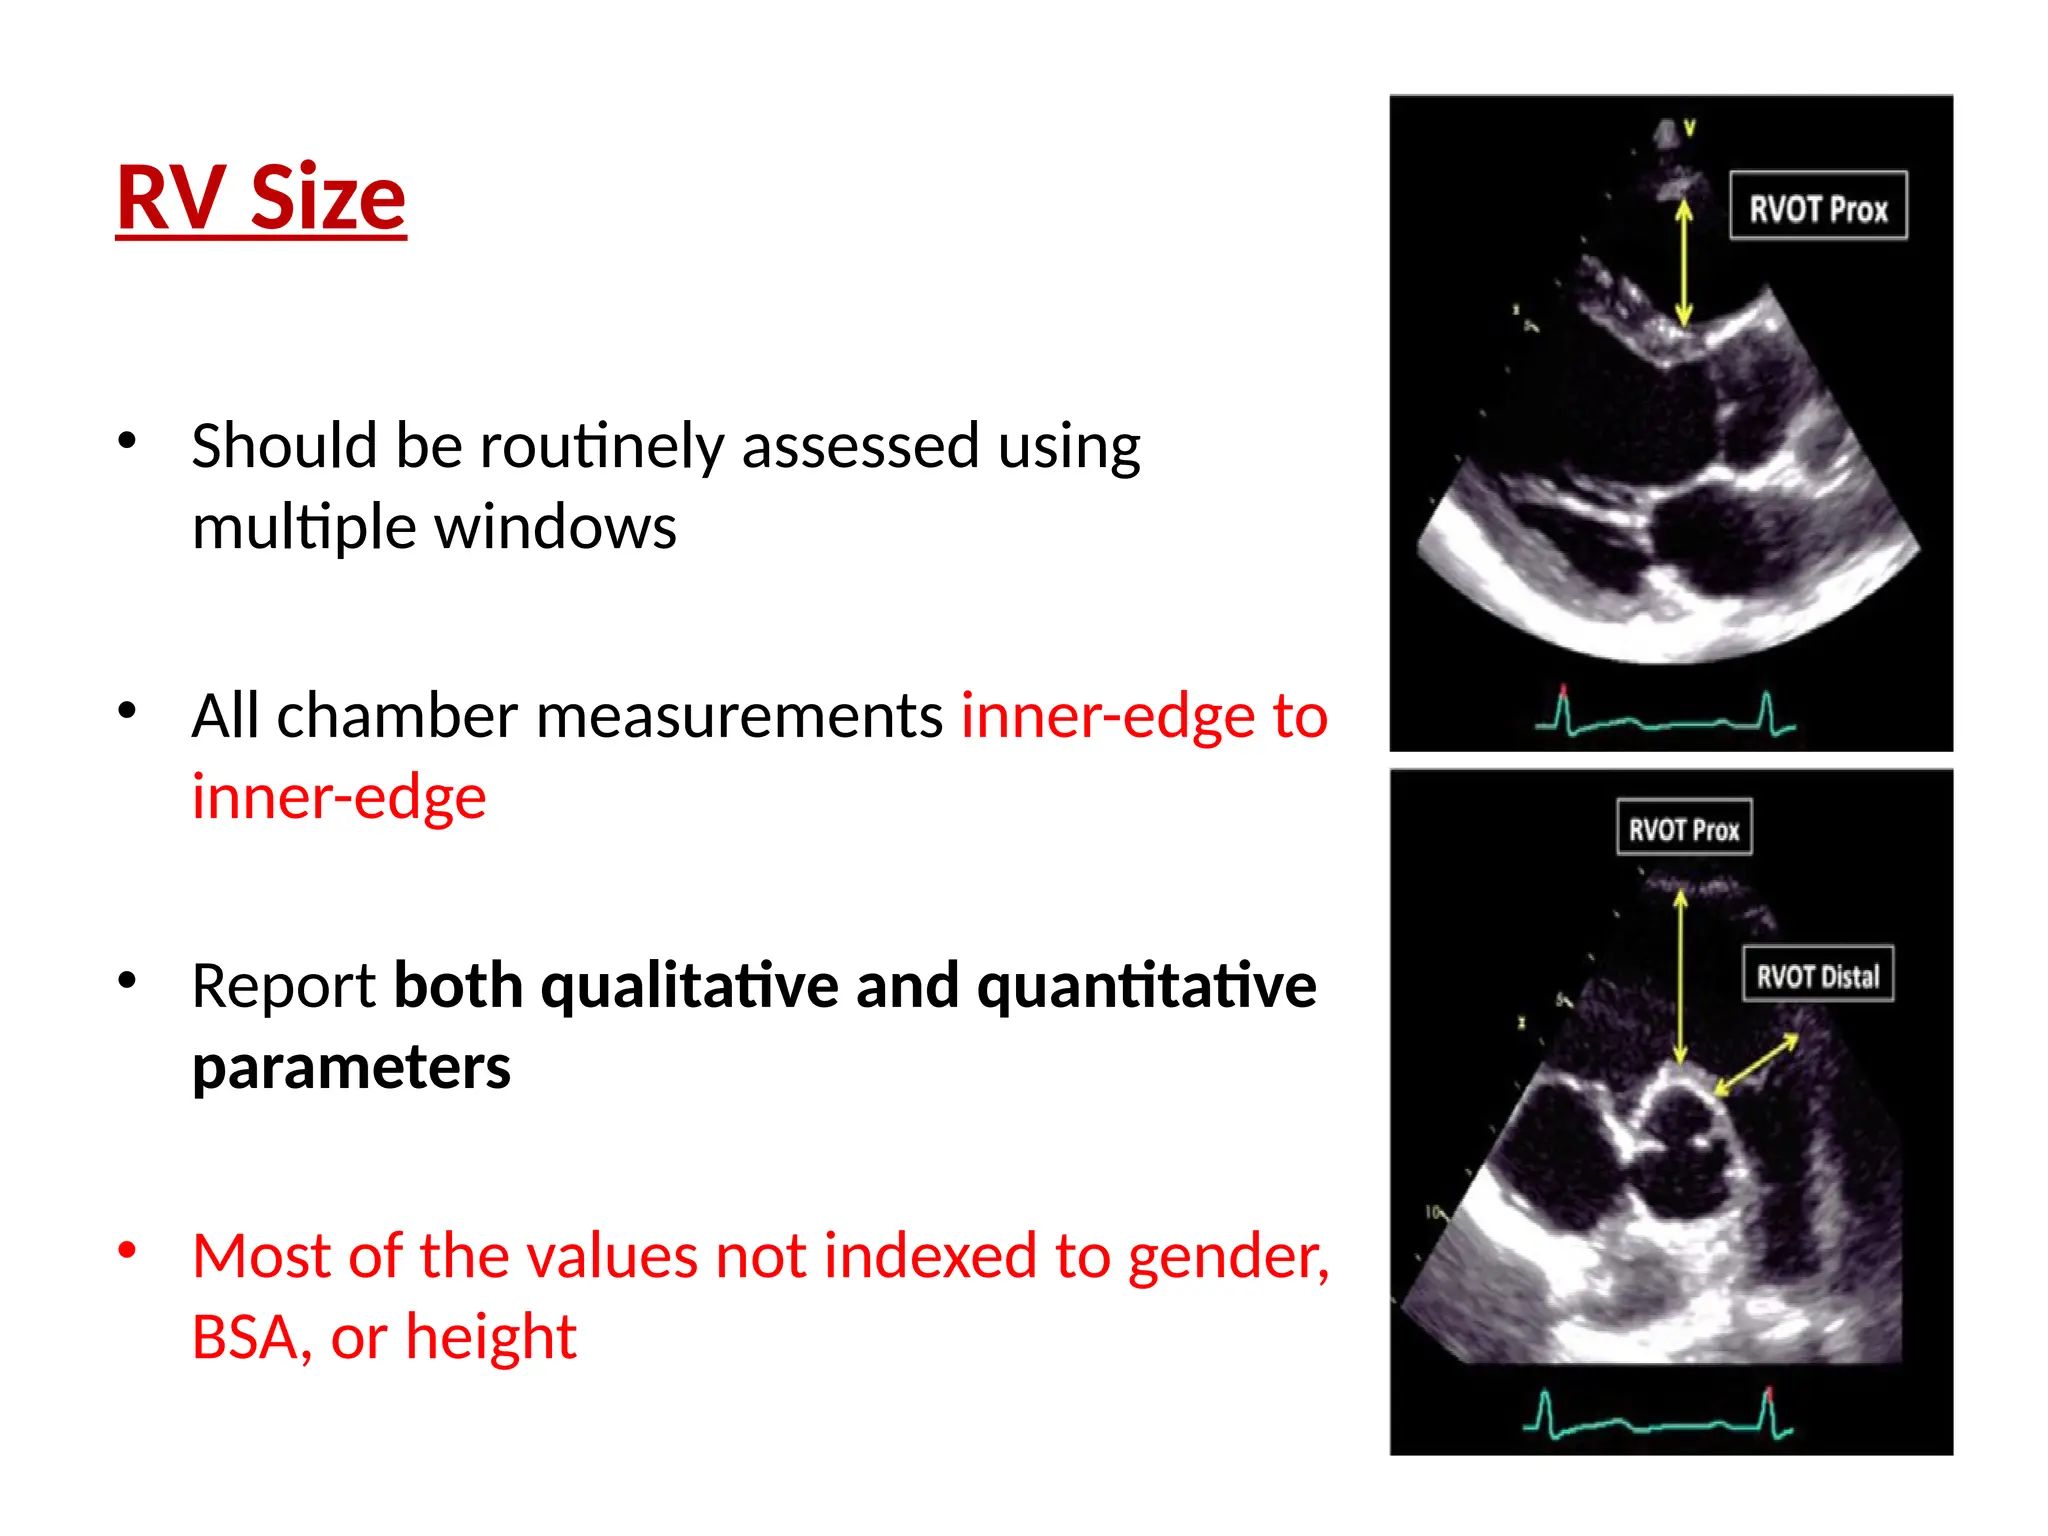
RV Size
• Shouldbe routinely assessed using
multiple windows
• All chamber measurements inner-edge to
inner-edge
• Report both qualitative and quantitative
parameters
• Most of the values not indexed to gender,
BSA, or height
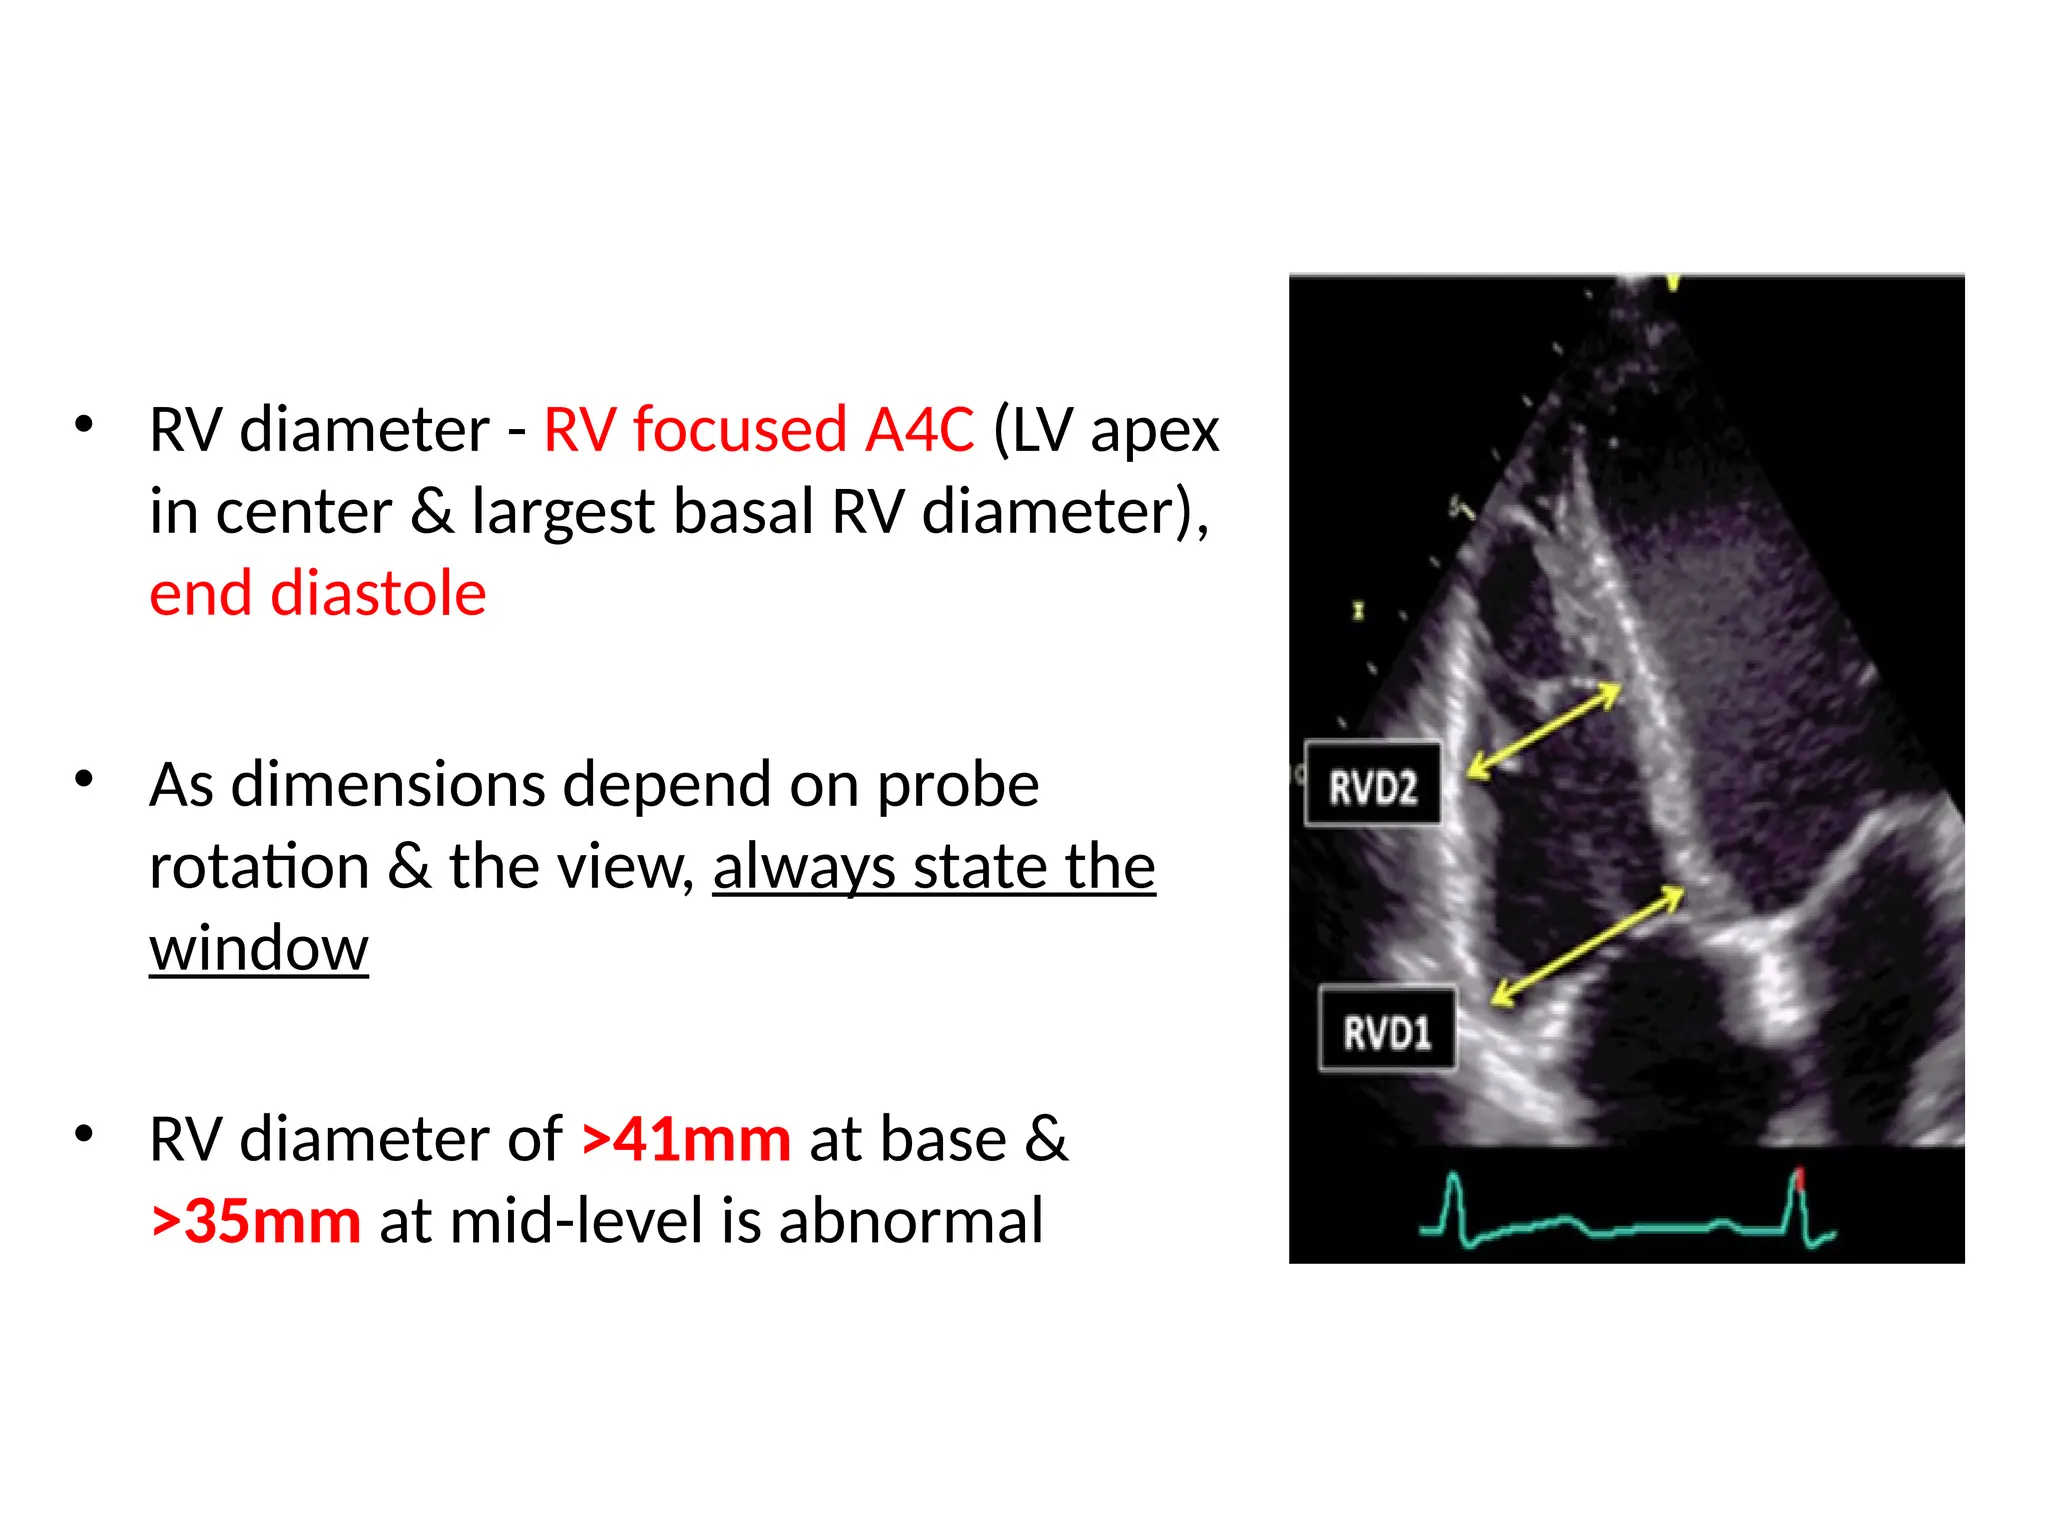
100.
• RV diameter- RV focused A4C (LV apex
in center & largest basal RV diameter),
end diastole
• As dimensions depend on probe
rotation & the view, always state the
window
• RV diameter of >41mm at base &
>35mm at mid-level is abnormal
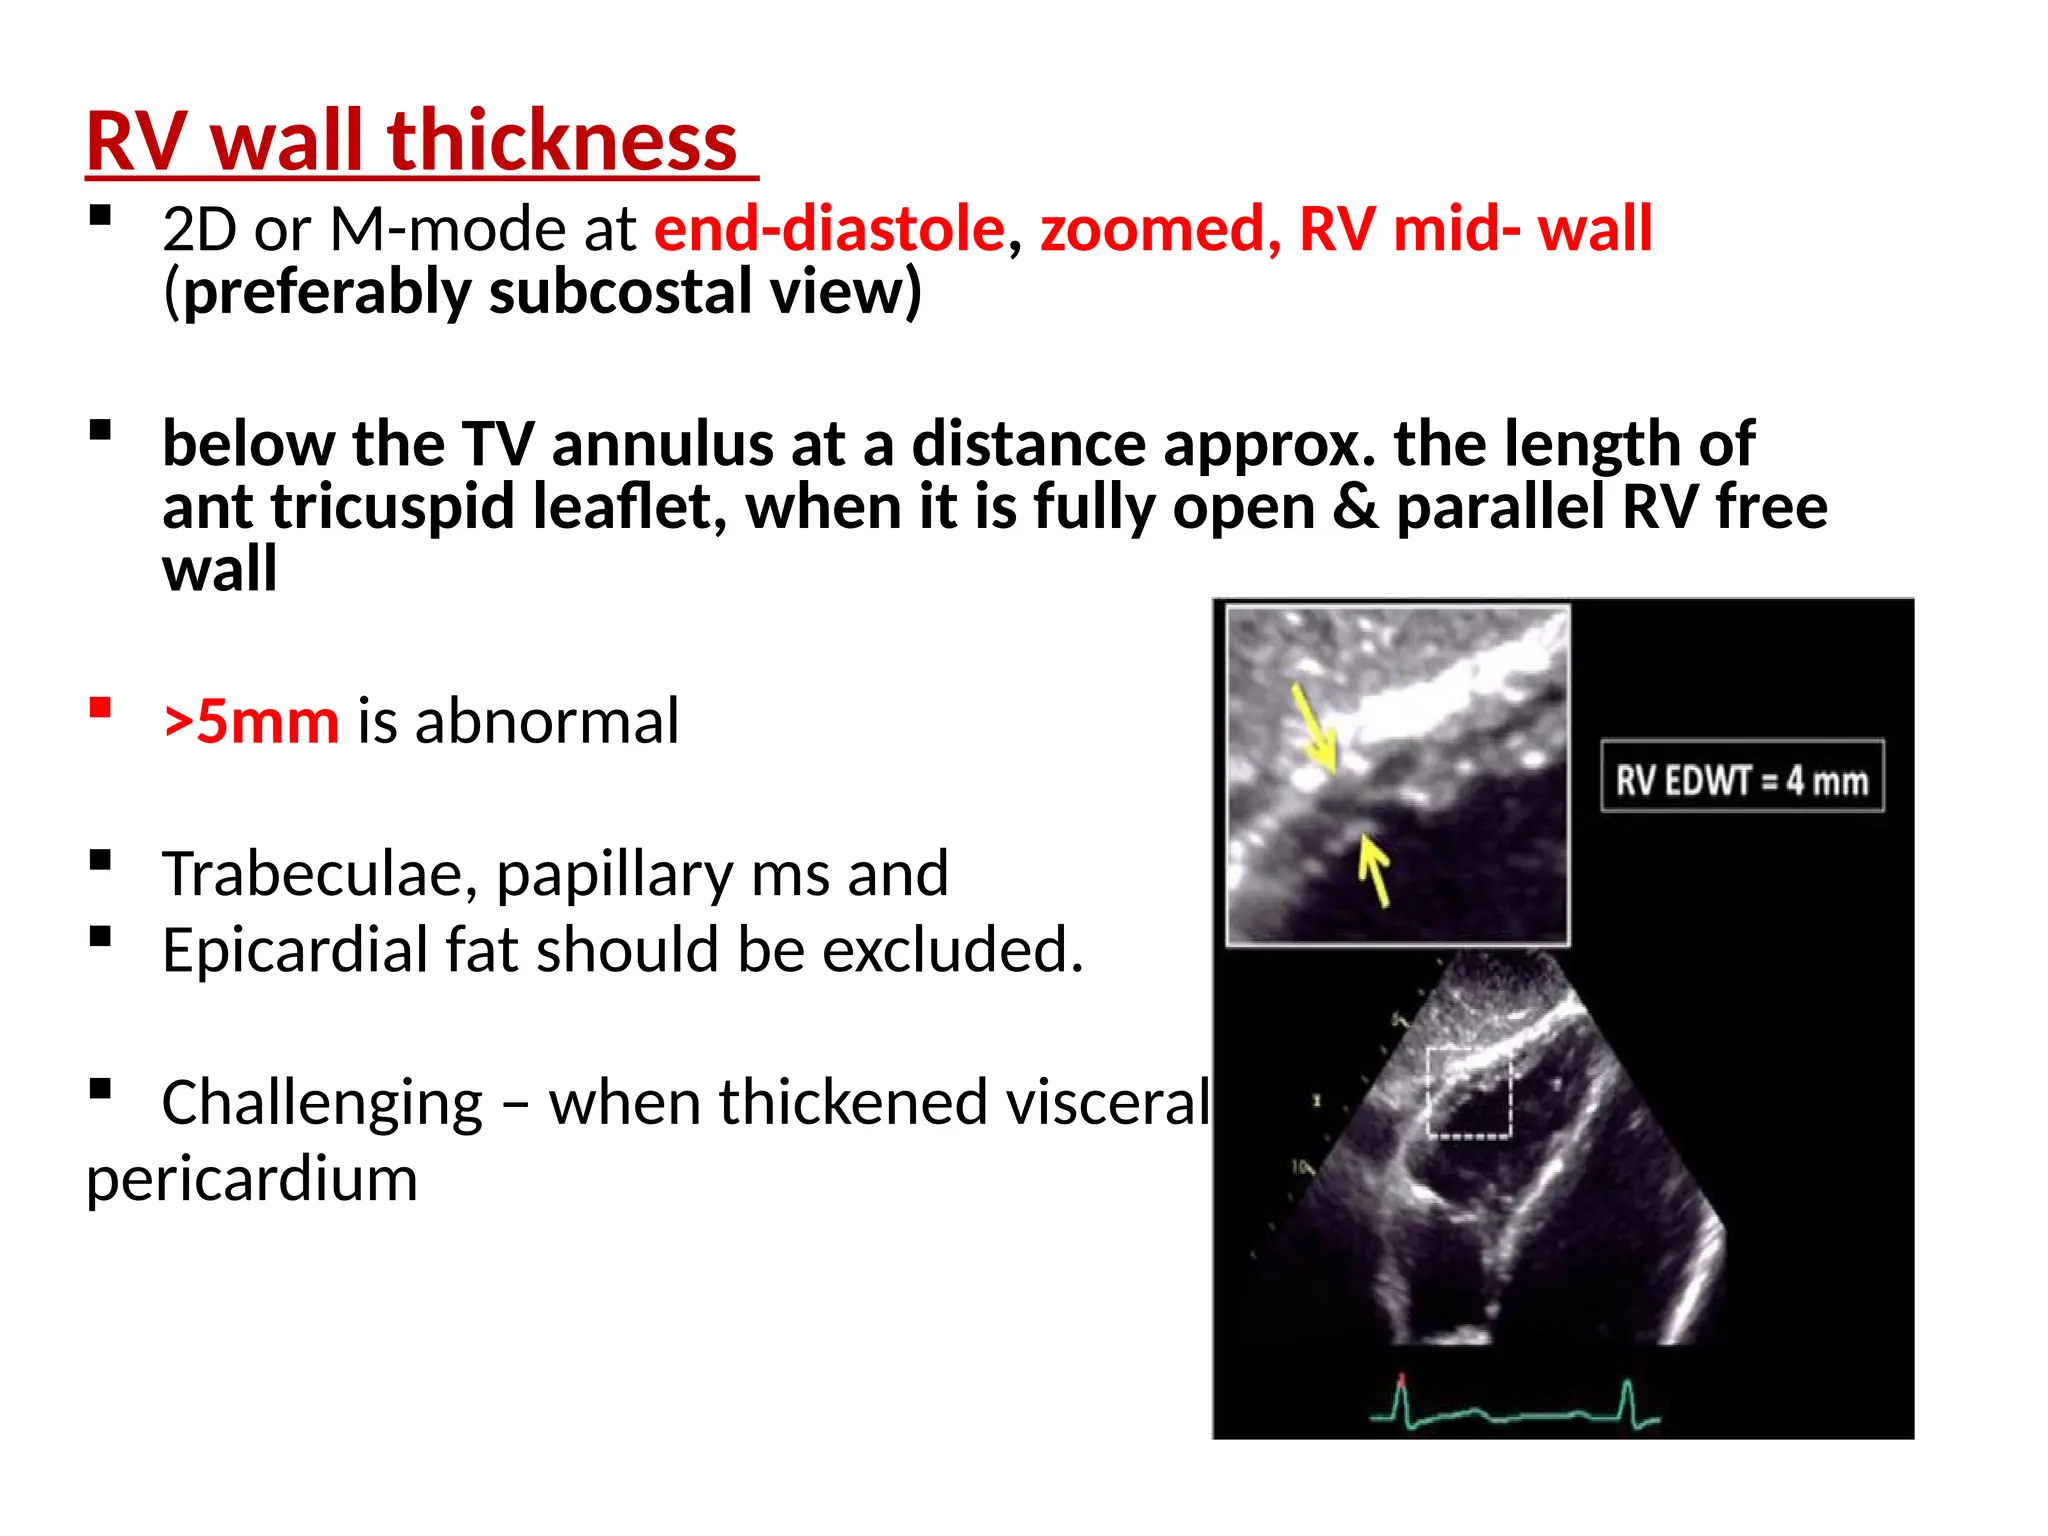
102.
RV wall thickness
2D or M-mode at end-diastole, zoomed, RV mid- wall
(preferably subcostal view)
below the TV annulus at a distance approx. the length of
ant tricuspid leaflet, when it is fully open & parallel RV free
wall
>5mm is abnormal
Trabeculae, papillary ms and
Epicardial fat should be excluded.
Challenging – when thickened visceral
pericardium
103.
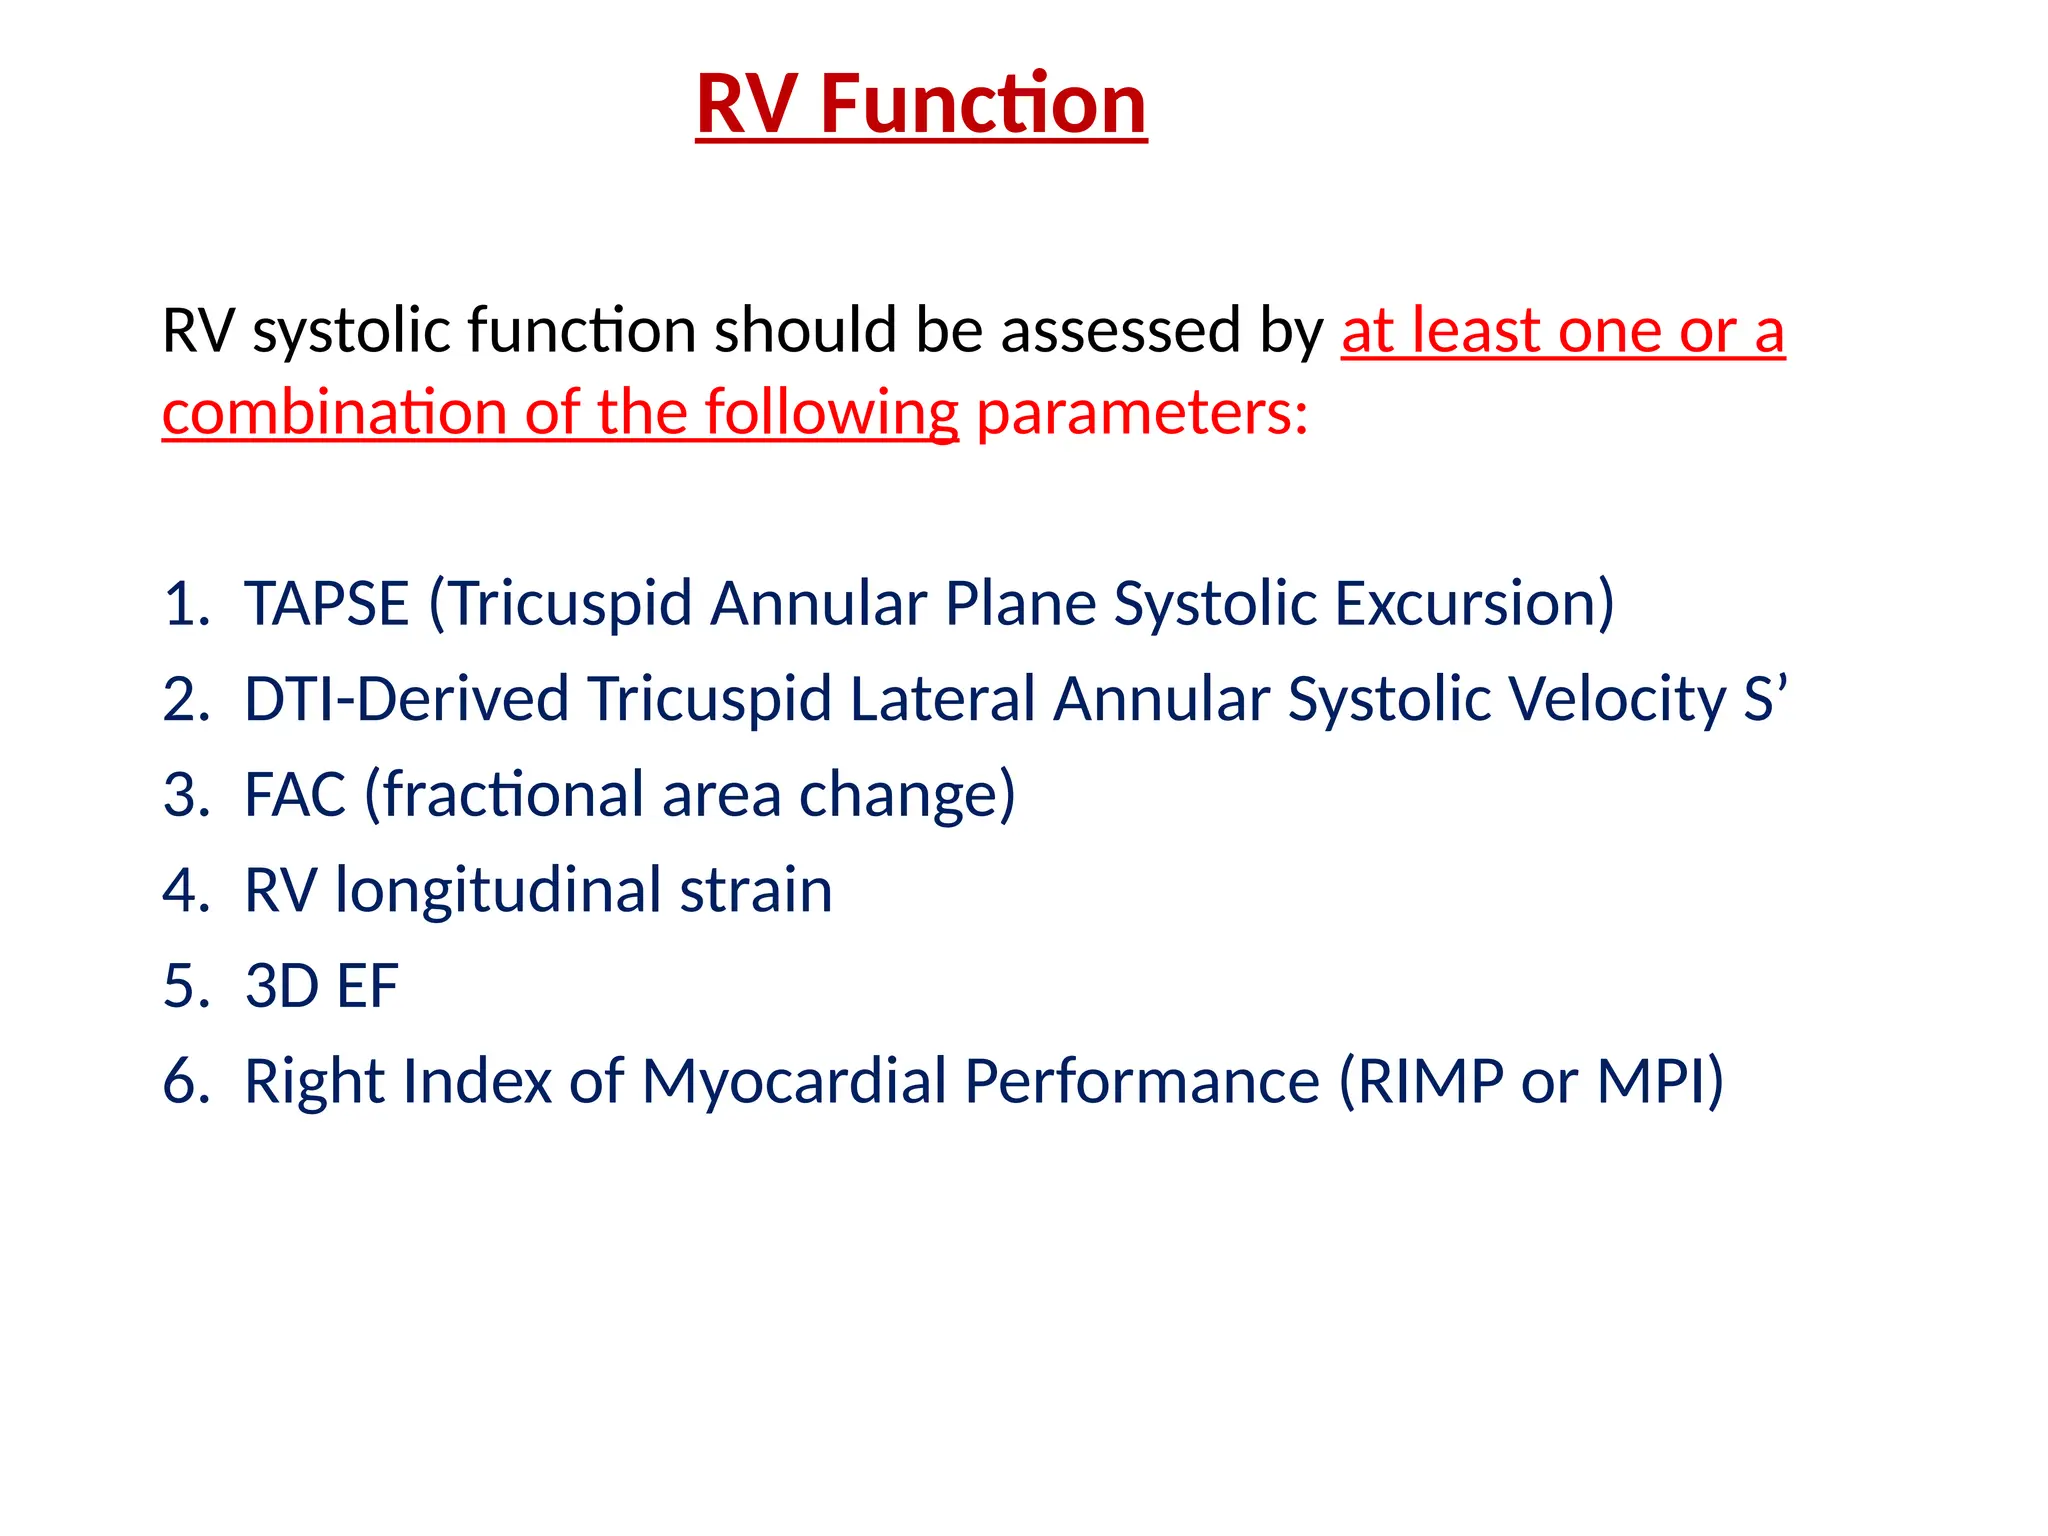
RV Function
RV systolicfunction should be assessed by at least one or a
combination of the following parameters:
1. TAPSE (Tricuspid Annular Plane Systolic Excursion)
2. DTI-Derived Tricuspid Lateral Annular Systolic Velocity S’
3. FAC (fractional area change)
4. RV longitudinal strain
5. 3D EF
6. Right Index of Myocardial Performance (RIMP or MPI)
104.
RIMP (Right Indexof Myocardial
performance) (Tei index)
assesses global RV function
requires beats with similar RR intervals
unreliable when RA pressure is elevated
IVCT, IVRT and ET from PW of TV inflow & RVOT,
or DTI of lateral TV annulus (values differ by method)
RIMP = (TCO – ET)/ET,
where TCO is the TV closure to opening time
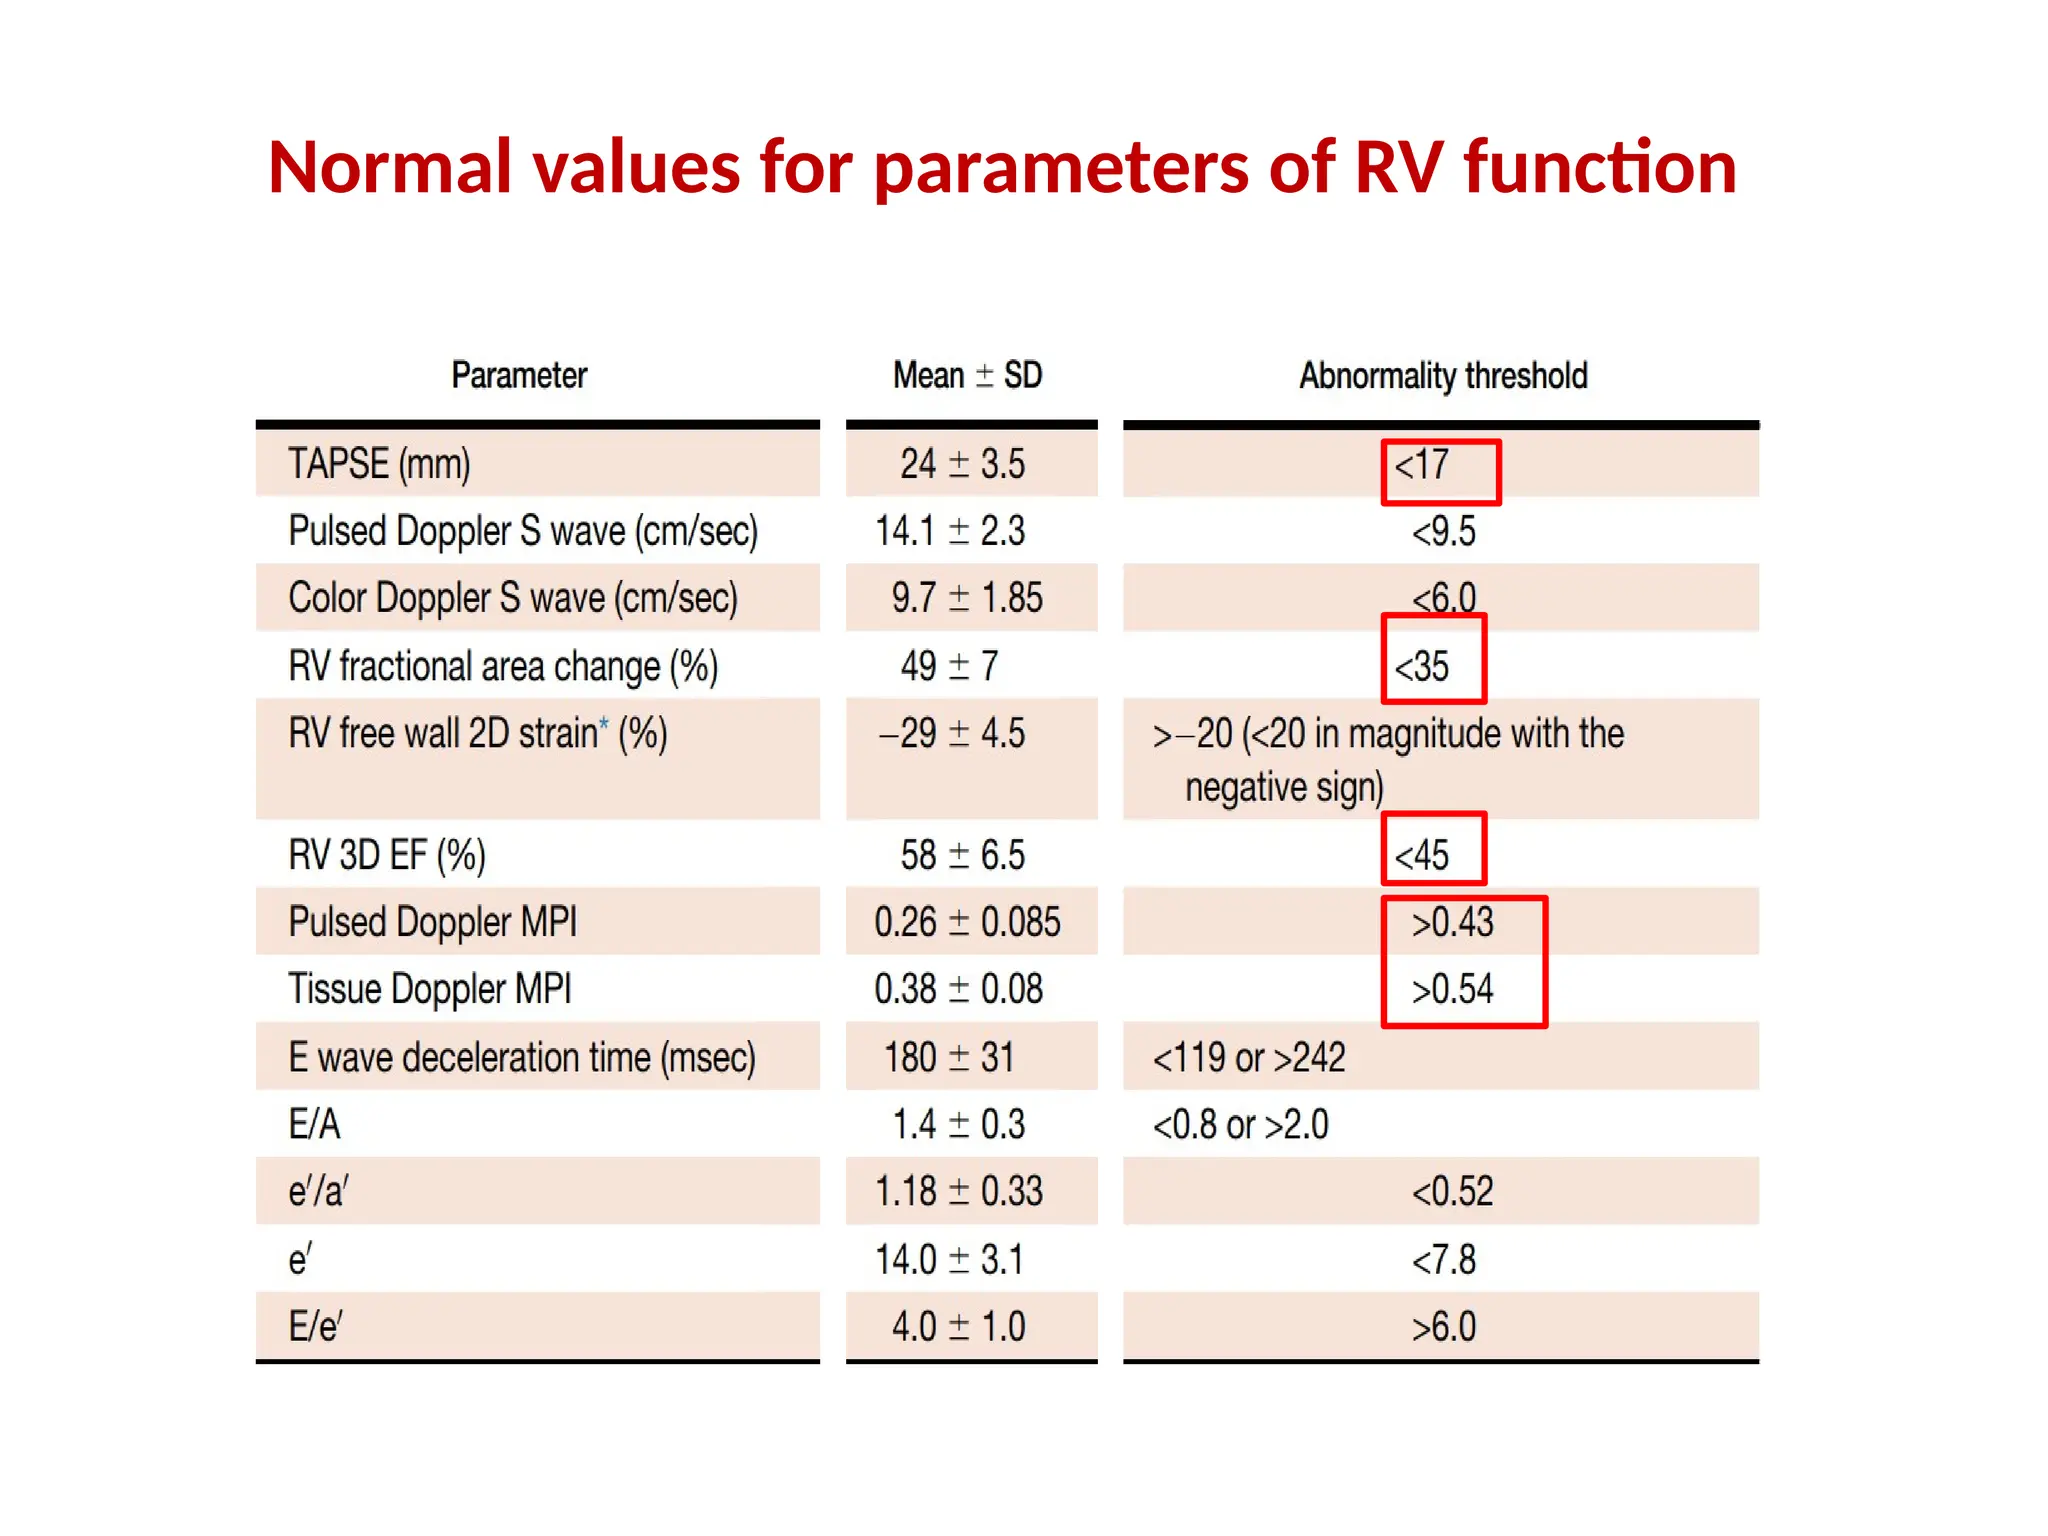
RIMP >0.43 by PW Doppler & >0.54 by DTI s/o
RV DYSFUNCTION.
DTI – single beat recording, no need for R-R interval
matching, which is needed in PW
PW SPECTRAL DOPPLER
DTI OF LATERAL TRICUSPID ANNULUS
105.
FAC
reflects bothlongitudinal & radial components of RV
contraction
correlates with RV EF by CMR
does not include the contribution of RV outflow tract to
systolic function
• RV FAC % = EDA-ESA/EDAX100
• GLOBAL RV SYSTOLIC FUNCTION
<35% FAC s/o RV SYSTOLIC
DYSFUNCTION
RV FOCUSED APICAL 4 CHAMBER VIEW
106.
RV 3D EF
includes RVOT contribution to overall function
post cardiac surgery pts – conventional indices
(TAPSE, S wave) no longer representative of RV
function
slightly higher in women, because of smaller
volumes
<45% s/o RV SYSTOLIC DYSFUNCTION
Limitation - load dependency,
interventricular changes affecting
septal motion,
poor acoustic windows,
& irregular rhythms
107.
TAPSE
predominantly RVlongitudinal function; good correlation
with parameters estimating RV global systolic function
may over- or underestimate RV function due to cardiac
translation
angle dependency
established prognostic value
Measure by M-MODE.
TAPSE <17 mm s/o RV
SYSTOLIC DYSFUNCTION.
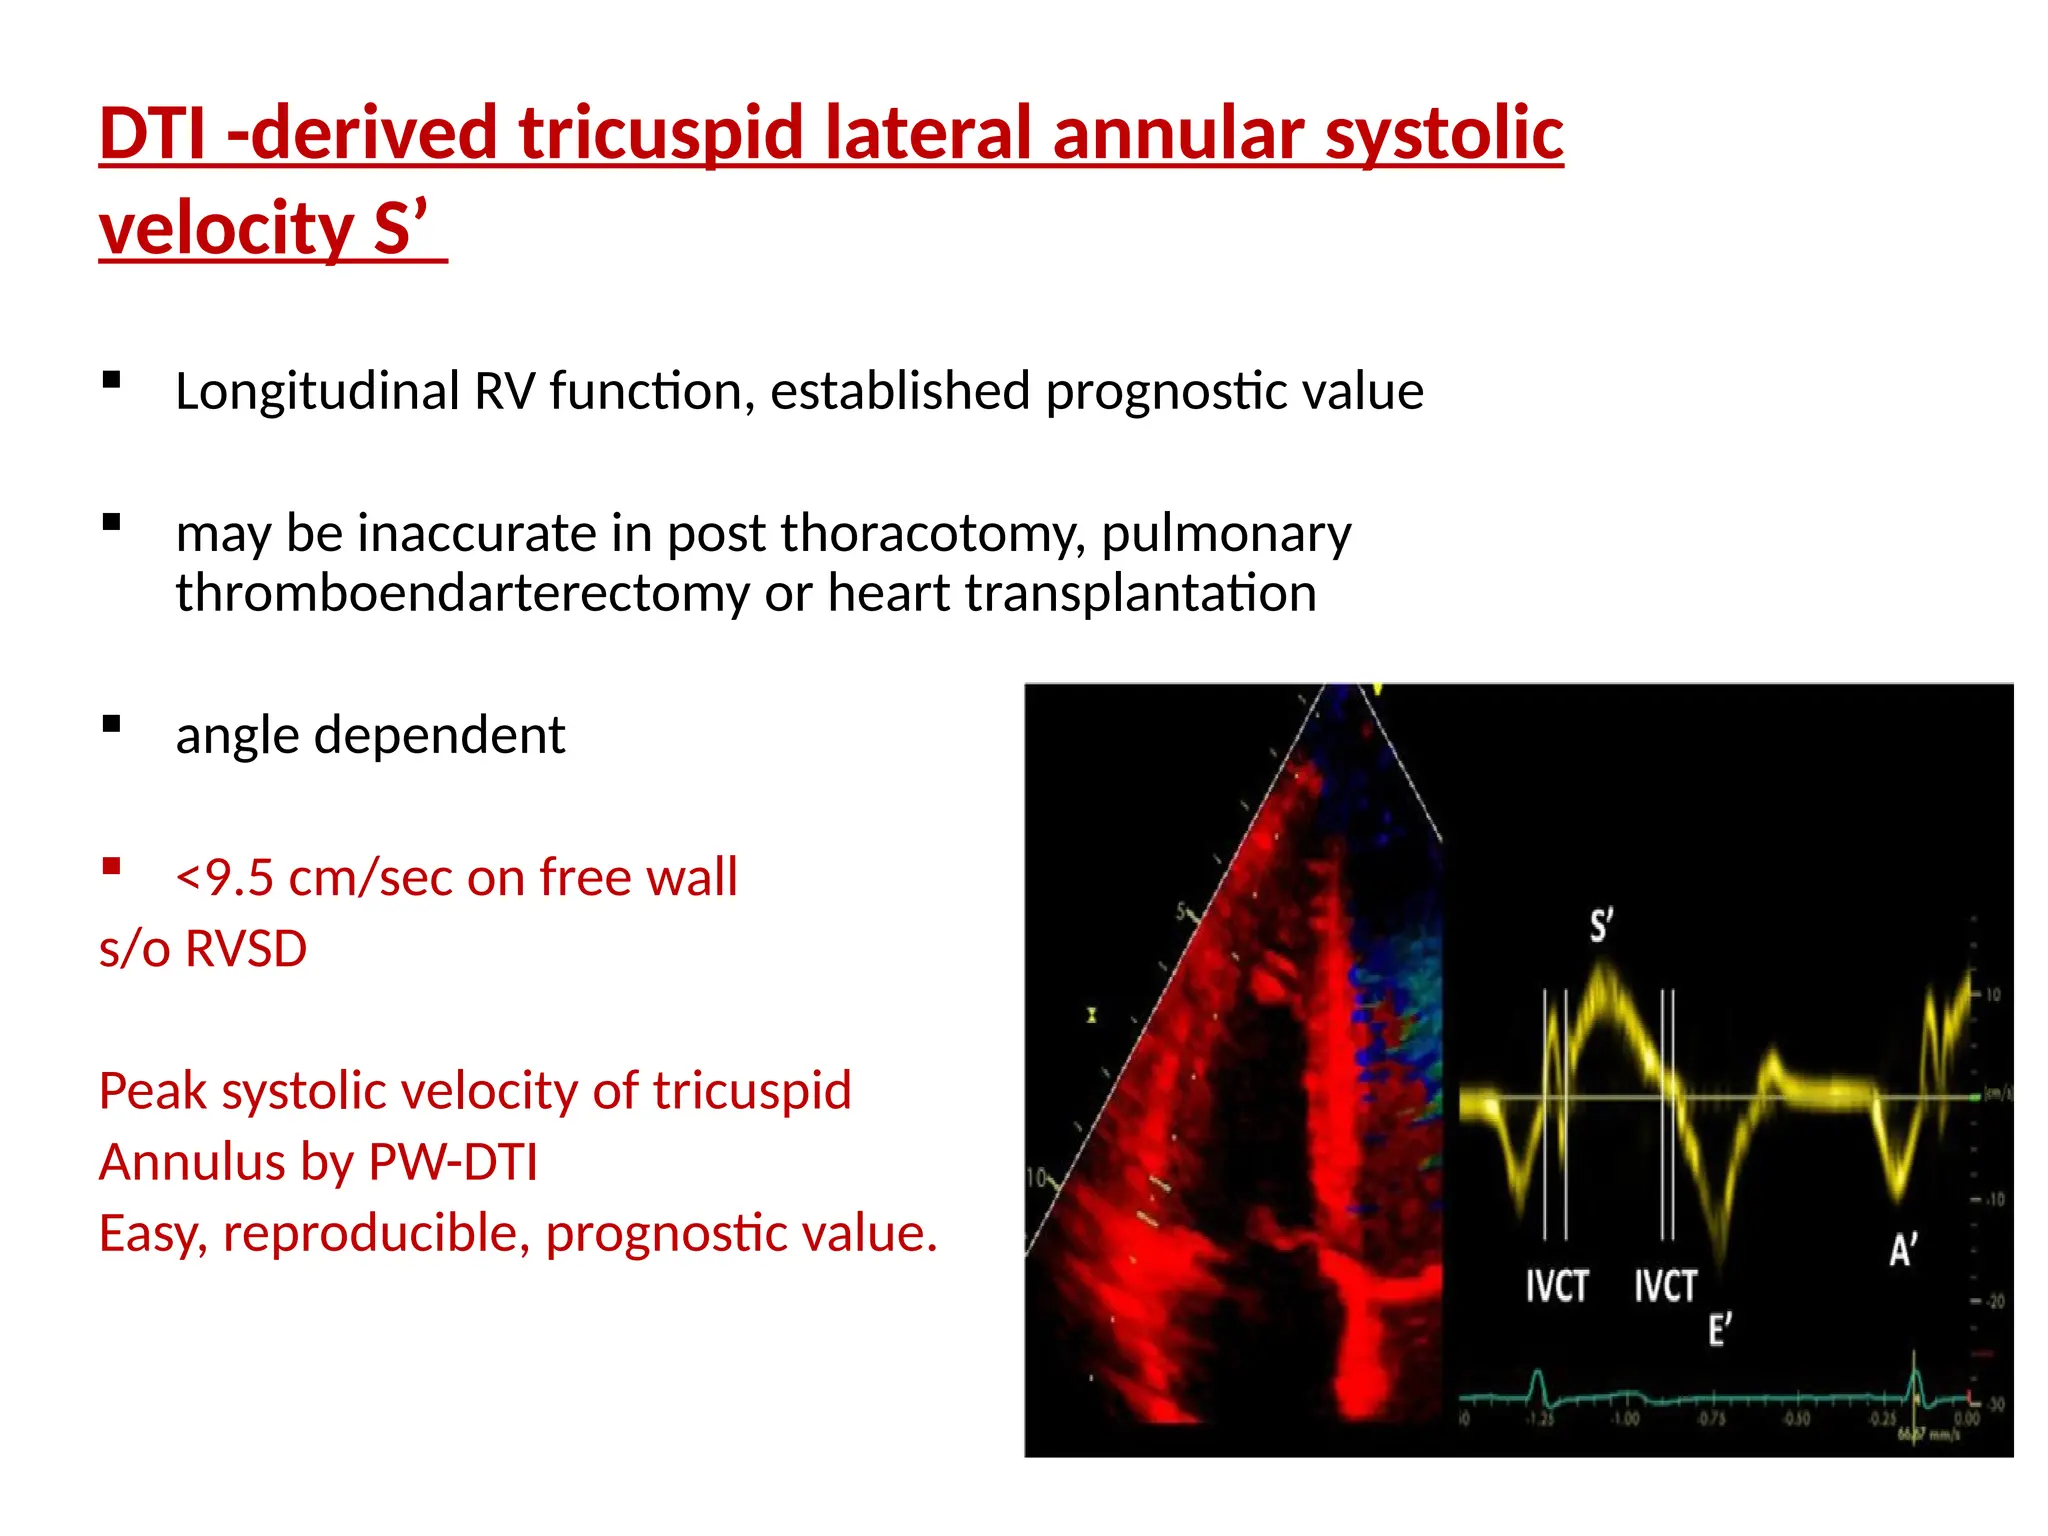
108.
DTI -derived tricuspidlateral annular systolic
velocity S’
Longitudinal RV function, established prognostic value
may be inaccurate in post thoracotomy, pulmonary
thromboendarterectomy or heart transplantation
angle dependent
<9.5 cm/sec on free wall
s/o RVSD
Peak systolic velocity of tricuspid
Annulus by PW-DTI
Easy, reproducible, prognostic value.
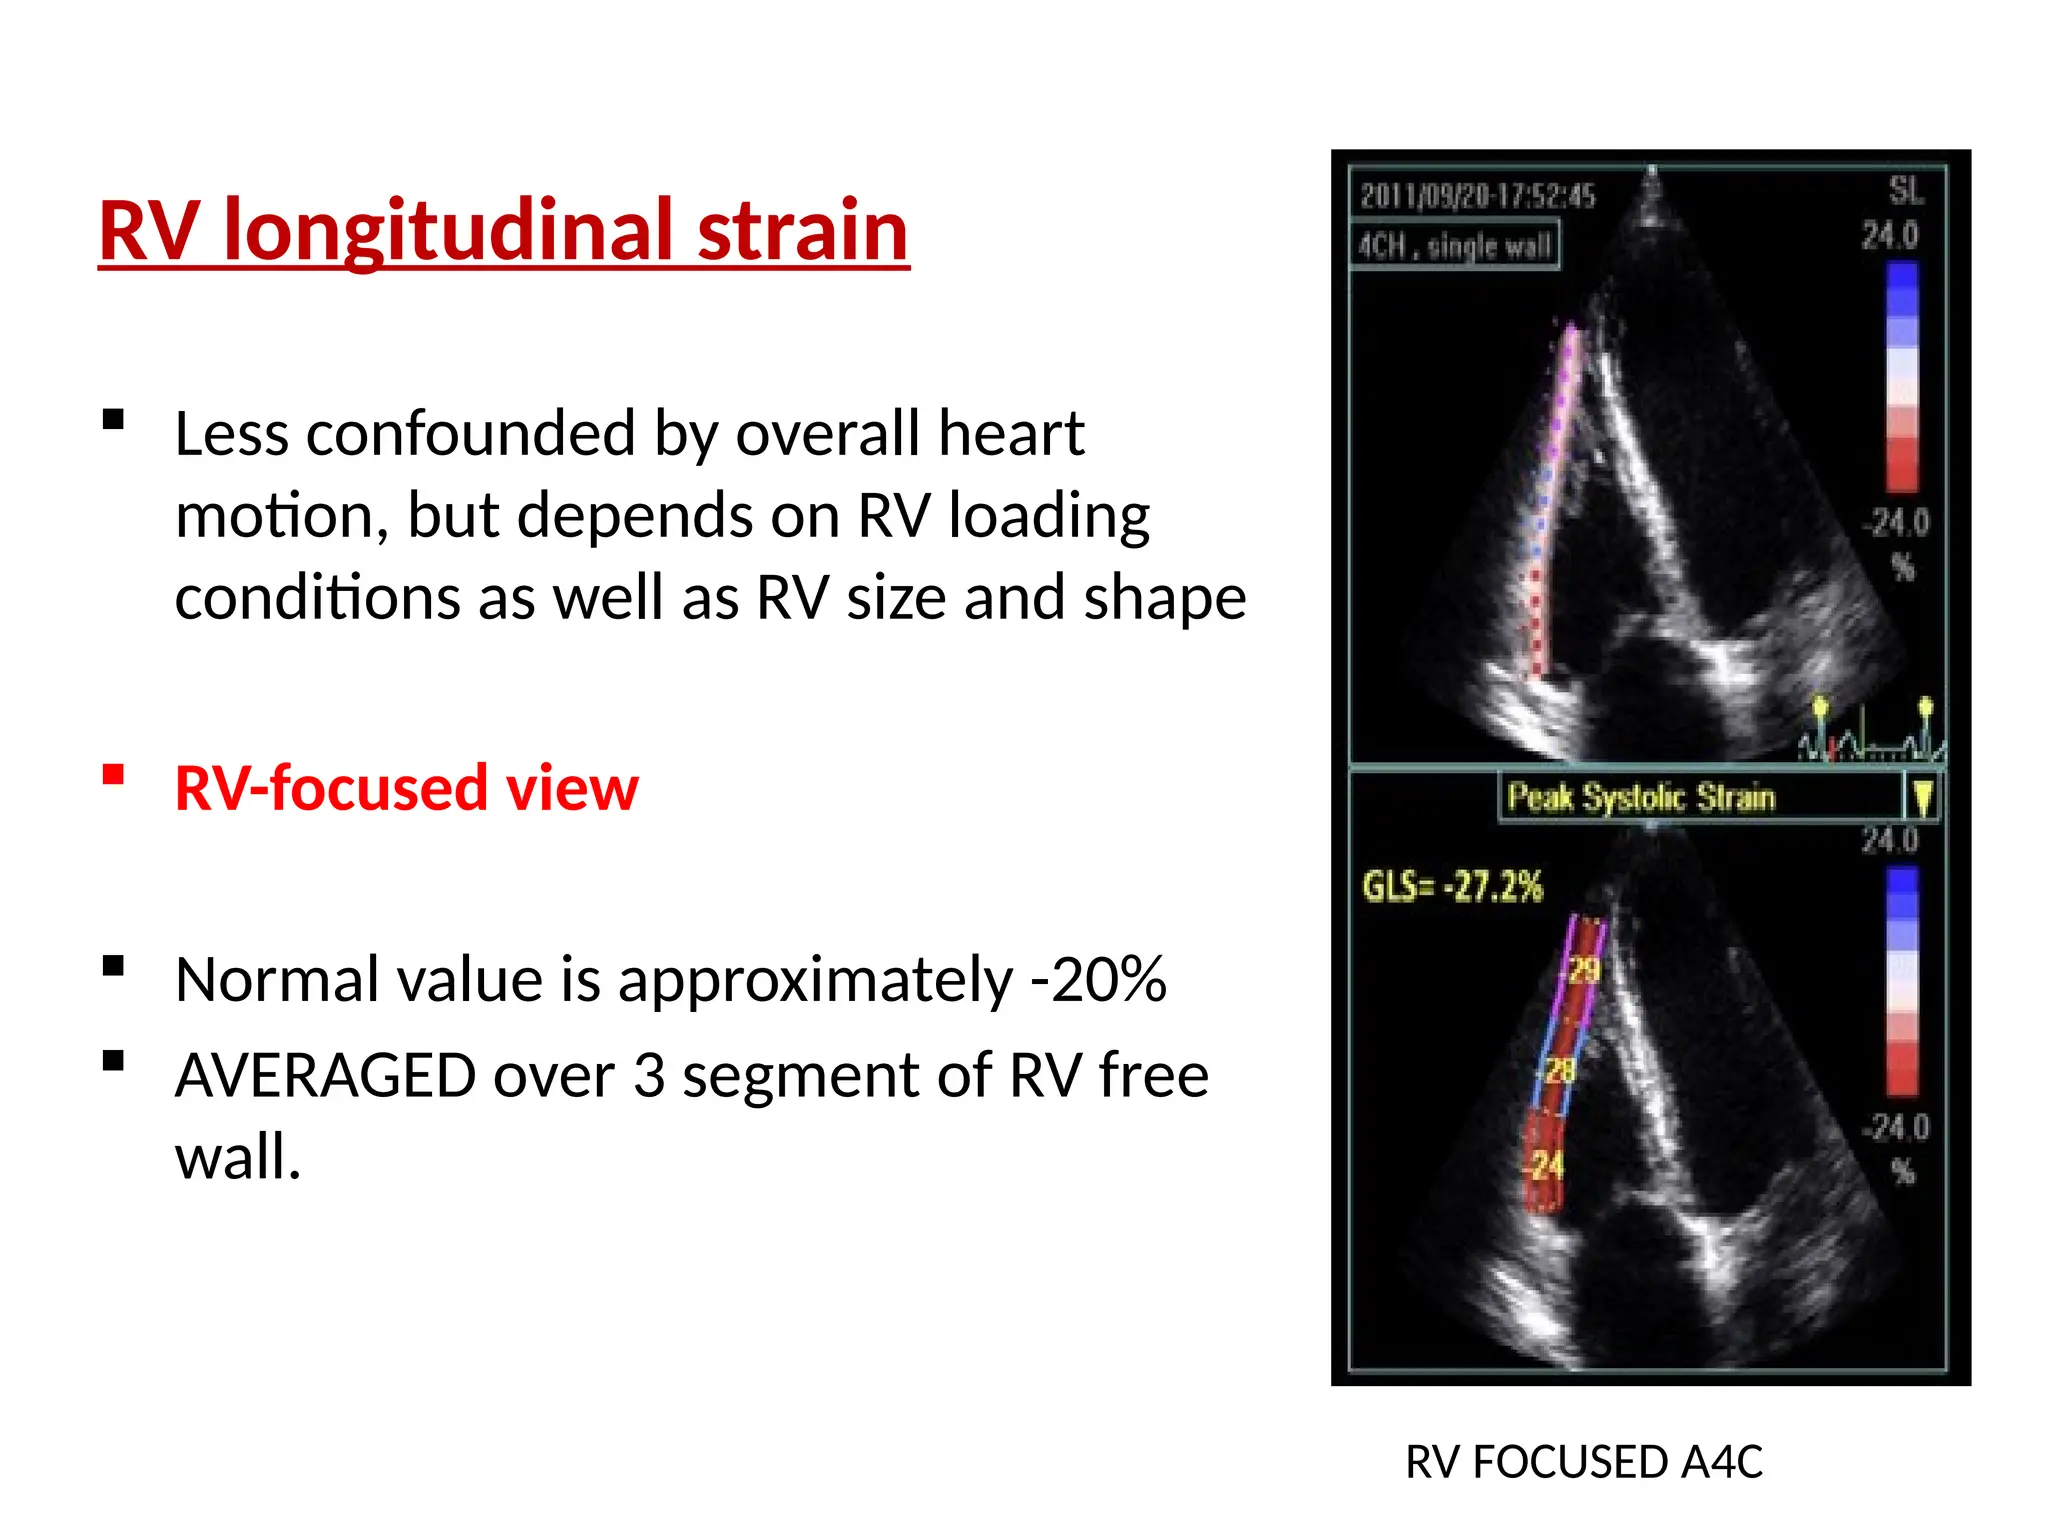
109.
RV longitudinal strain
Less confounded by overall heart
motion, but depends on RV loading
conditions as well as RV size and shape
RV-focused view
Normal value is approximately -20%
AVERAGED over 3 segment of RV free
wall.
RV FOCUSED A4C
LA AREA/ VOLUMEMEASUREMENTS
• End-systole when the LA chamber is at its greatest (prior to MV
opening)
• Avoid foreshortening
• Dedicated acquisition (apical) - maximize LA length & align true long
axis of LA
• For tracing area/volume, exclude confluences of PVs & LA
appendage
• AV interface represented by the mitral annulus plane
112.
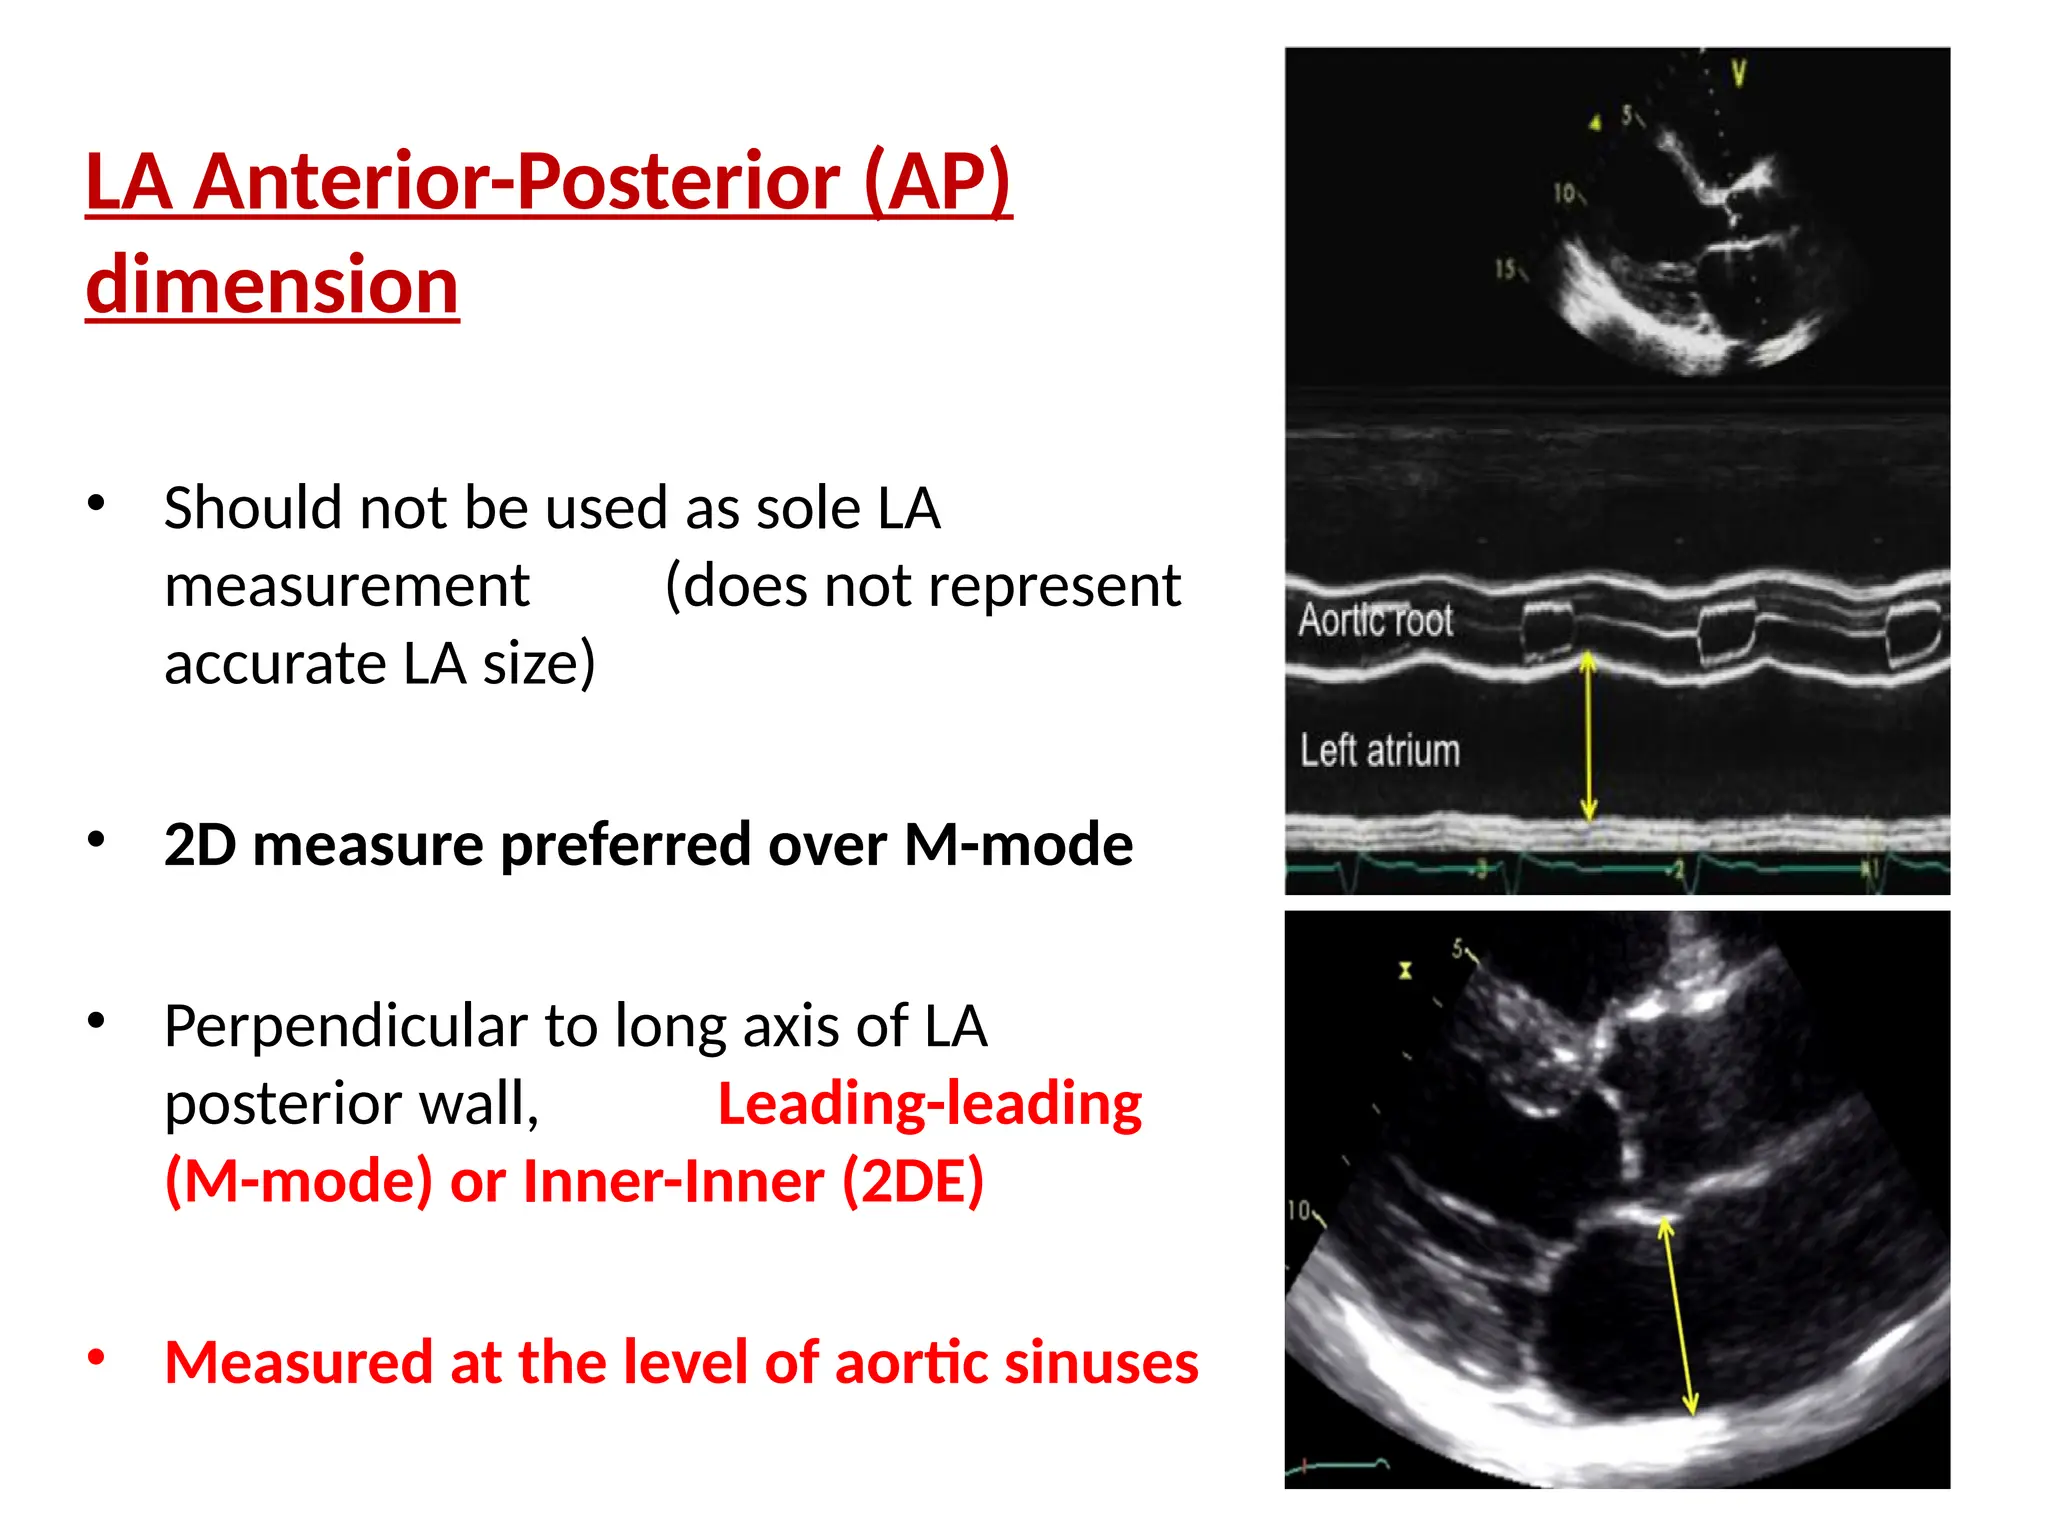
LA Anterior-Posterior (AP)
dimension
•Should not be used as sole LA
measurement (does not represent
accurate LA size)
• 2D measure preferred over M-mode
• Perpendicular to long axis of LA
posterior wall, Leading-leading
(M-mode) or Inner-Inner (2DE)
• Measured at the level of aortic sinuses
113.
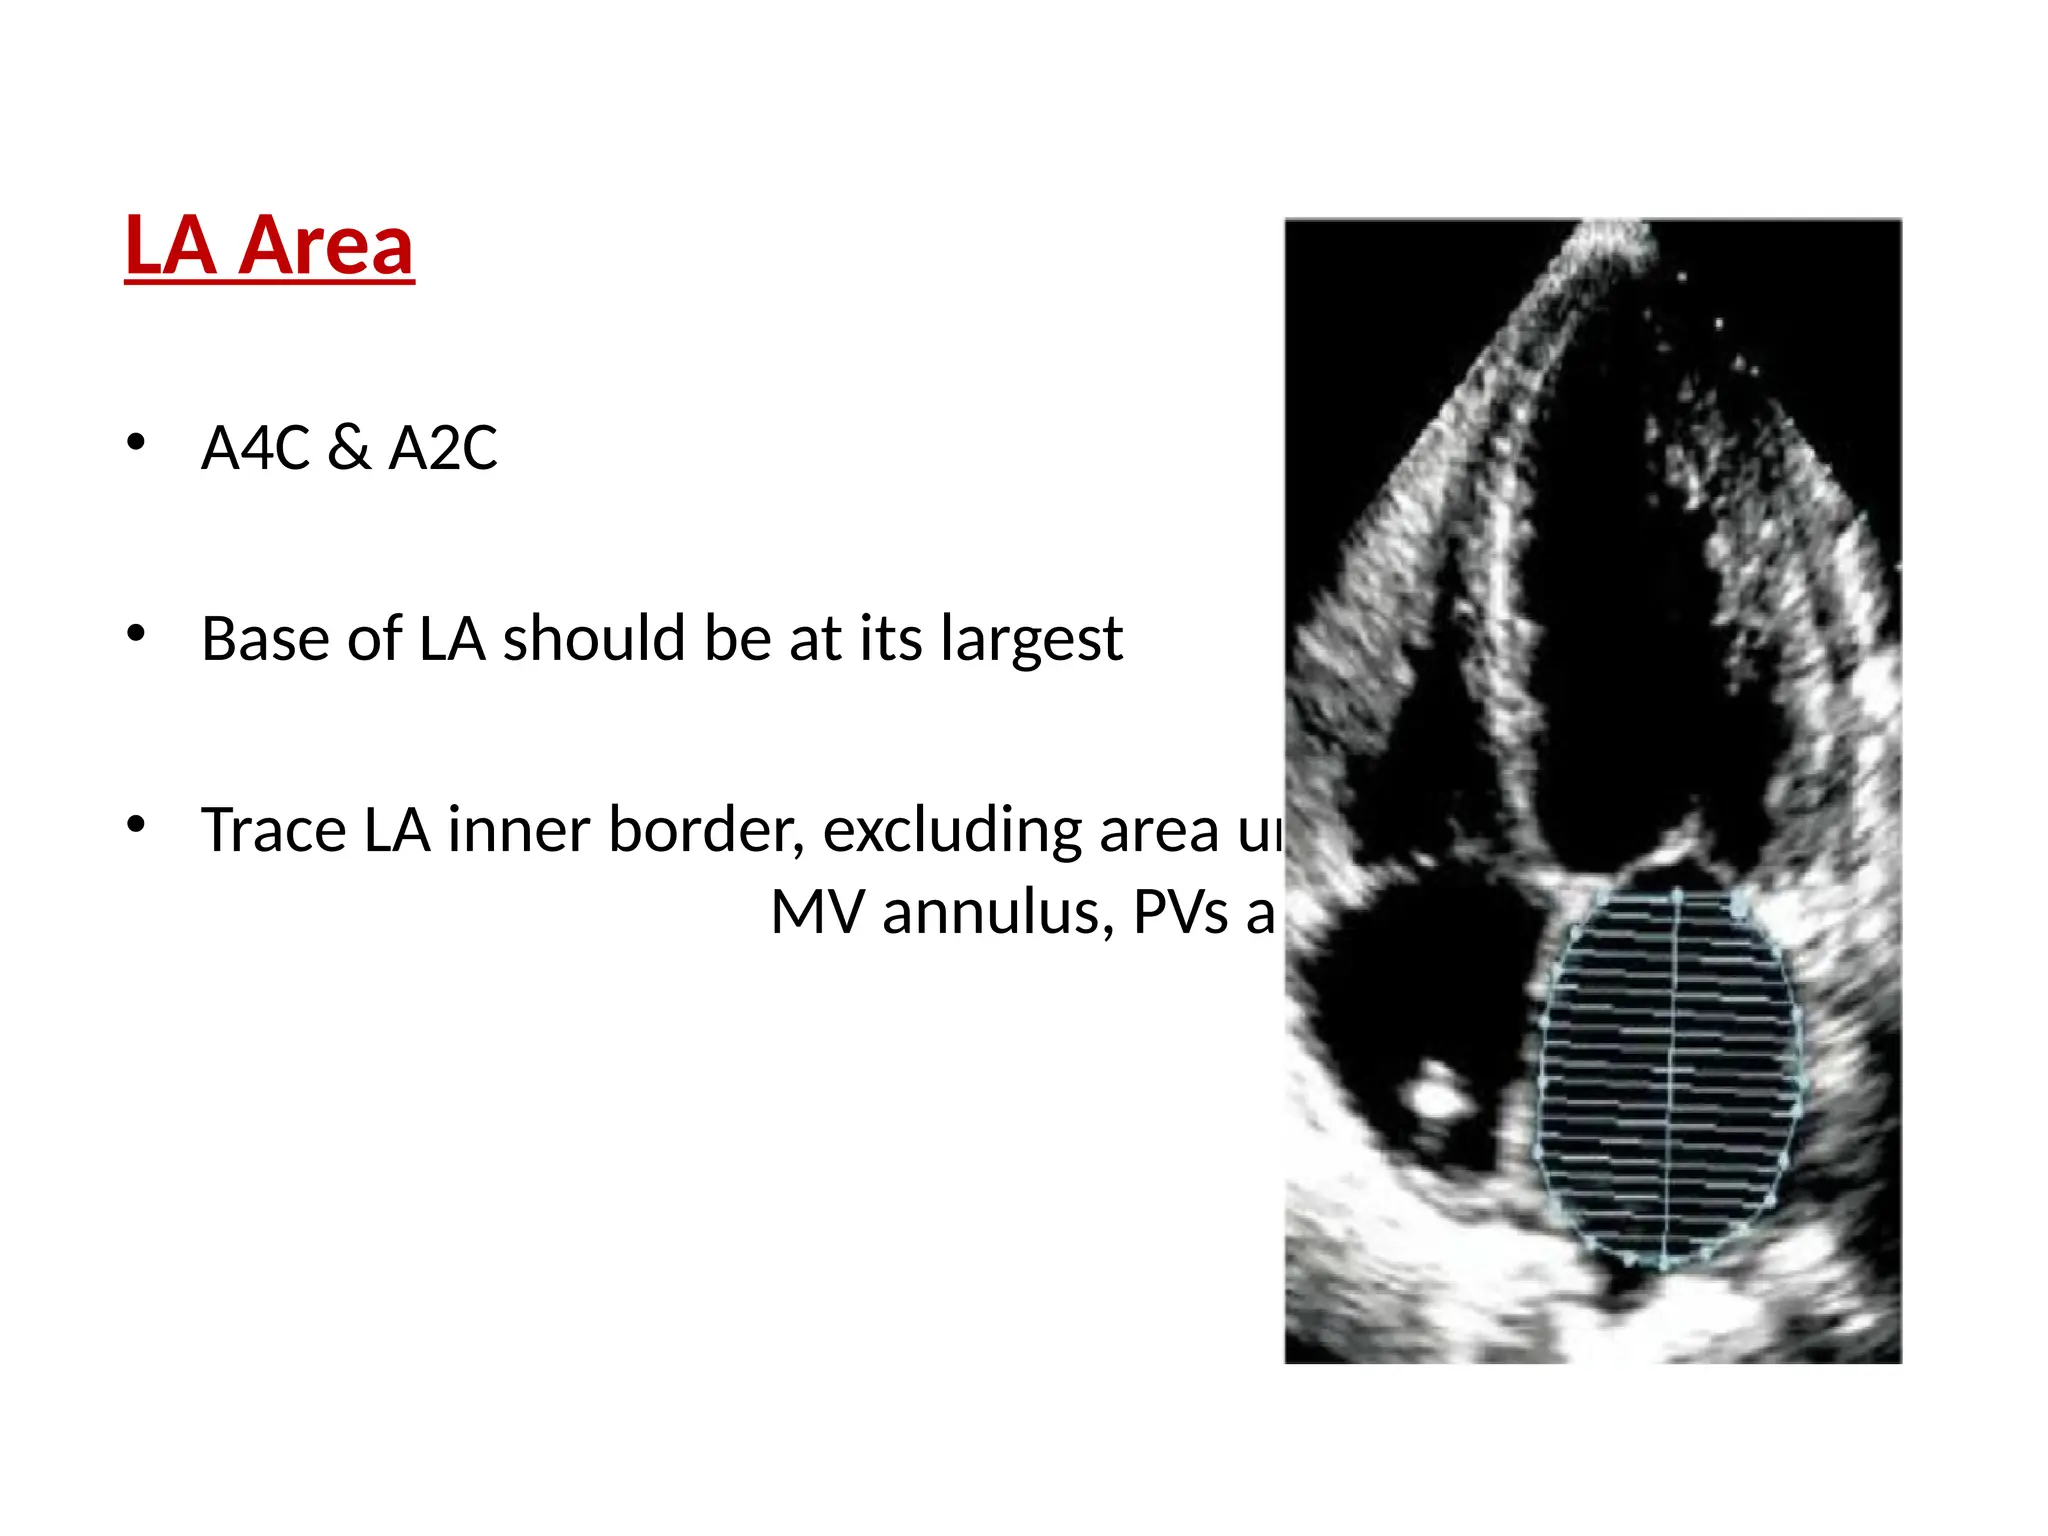
LA Area
• A4C& A2C
• Base of LA should be at its largest
• Trace LA inner border, excluding area under
MV annulus, PVs and LA appendage
114.
LA Volume (Preferredover linear
or area-length method)
Trace LA inner border, excl. area under
MV annulus, PVs, and LA appendage from
A4C & A2C views
Area-length technique: Length (L)
measured from the shorter of the two
long axes in 4C/2C views
Biplane summation of discs (preferred)
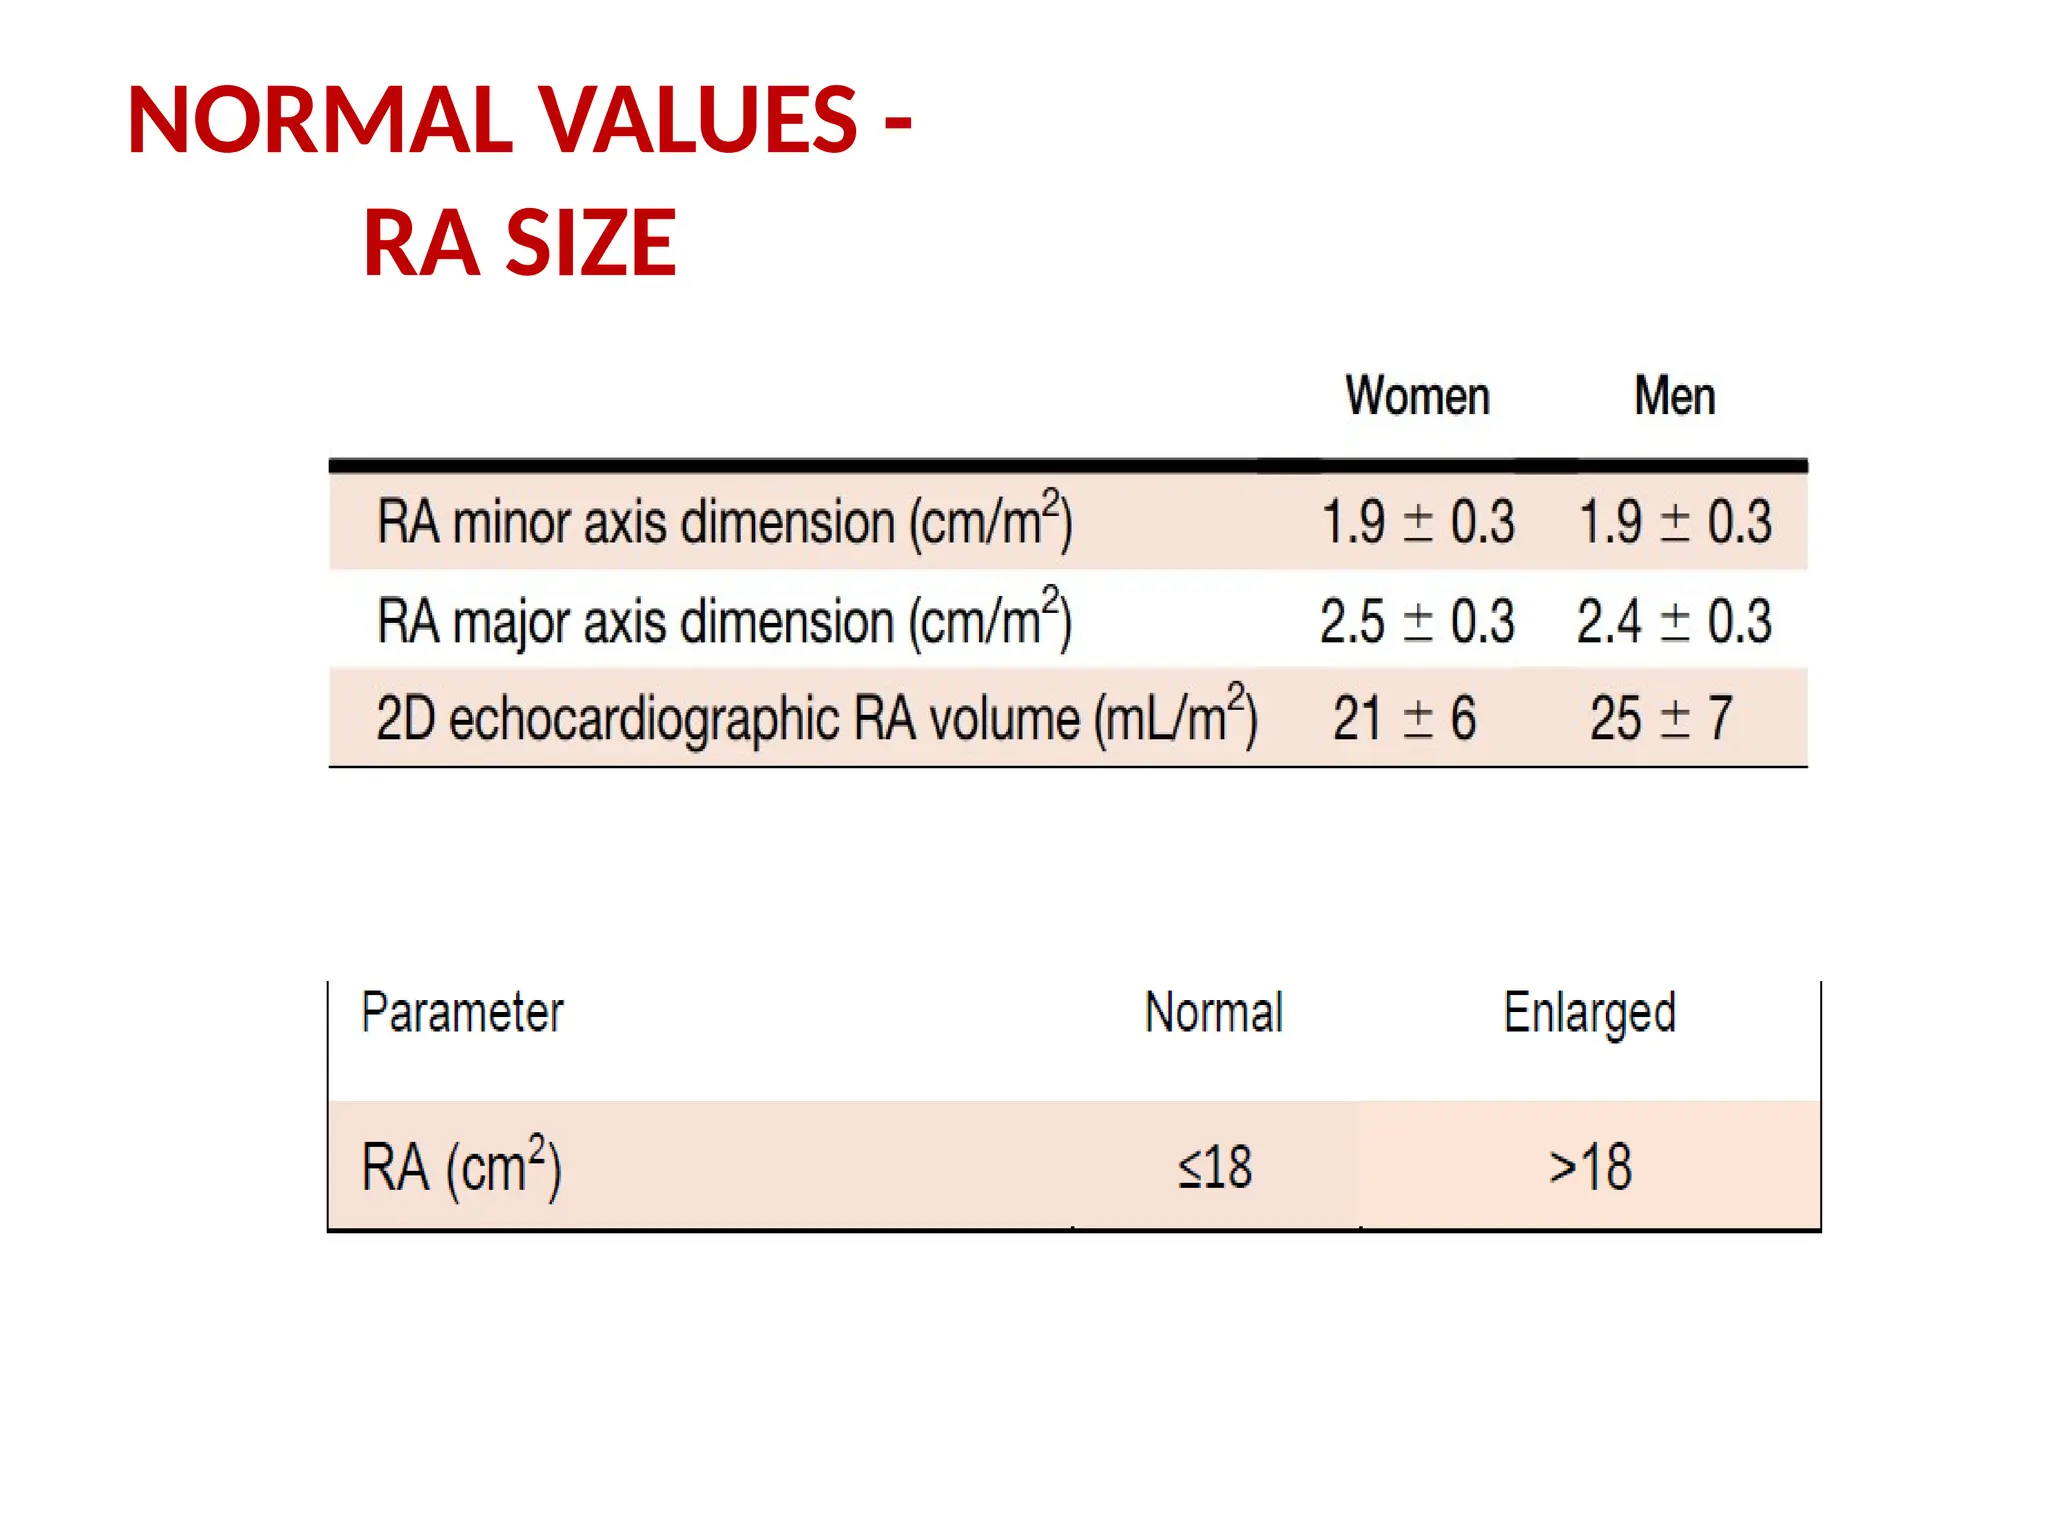
RA AREA &VOLUME MEASUREMENTS
RA area
• End-systole, at its greatest dimension, prior
to TV opening
• Dedicated right heart view (an A4C view
that includes entire RA and is not
foreshortened)
• RA length should be maximized by
alignment along the true long axis of RA
• Base of the RA should be at its largest size
• Planimetry - exclude area under TV annulus
& confluences of RA appendage
118.
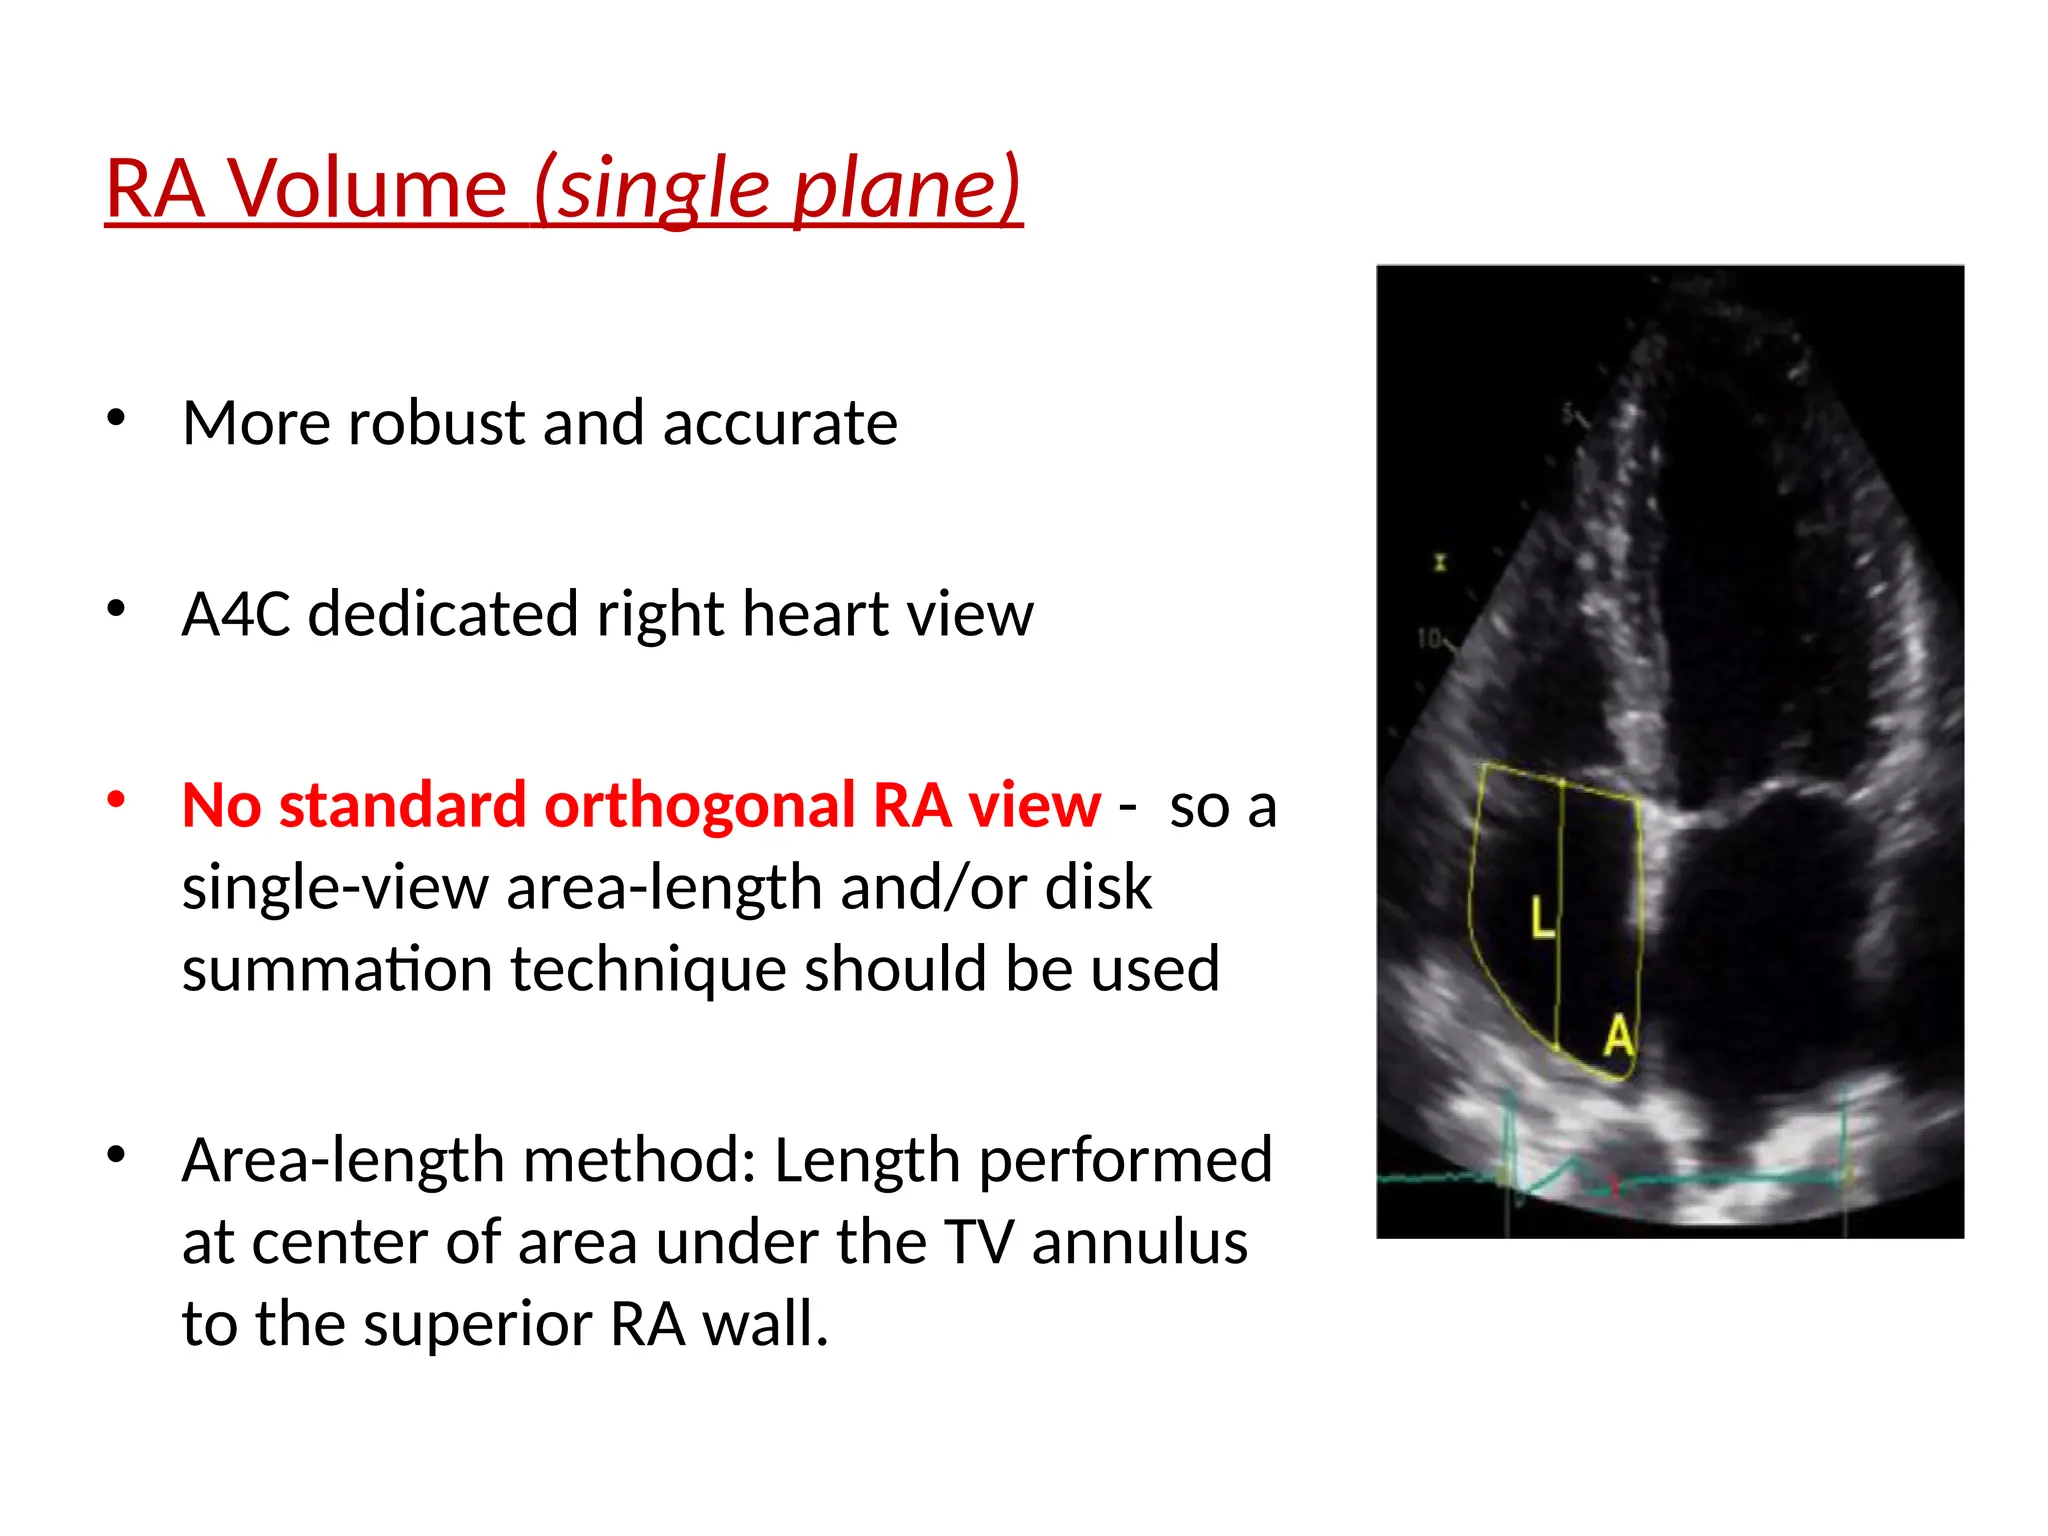
RA Volume (singleplane)
• More robust and accurate
• A4C dedicated right heart view
• No standard orthogonal RA view - so a
single-view area-length and/or disk
summation technique should be used
• Area-length method: Length performed
at center of area under the TV annulus
to the superior RA wall.
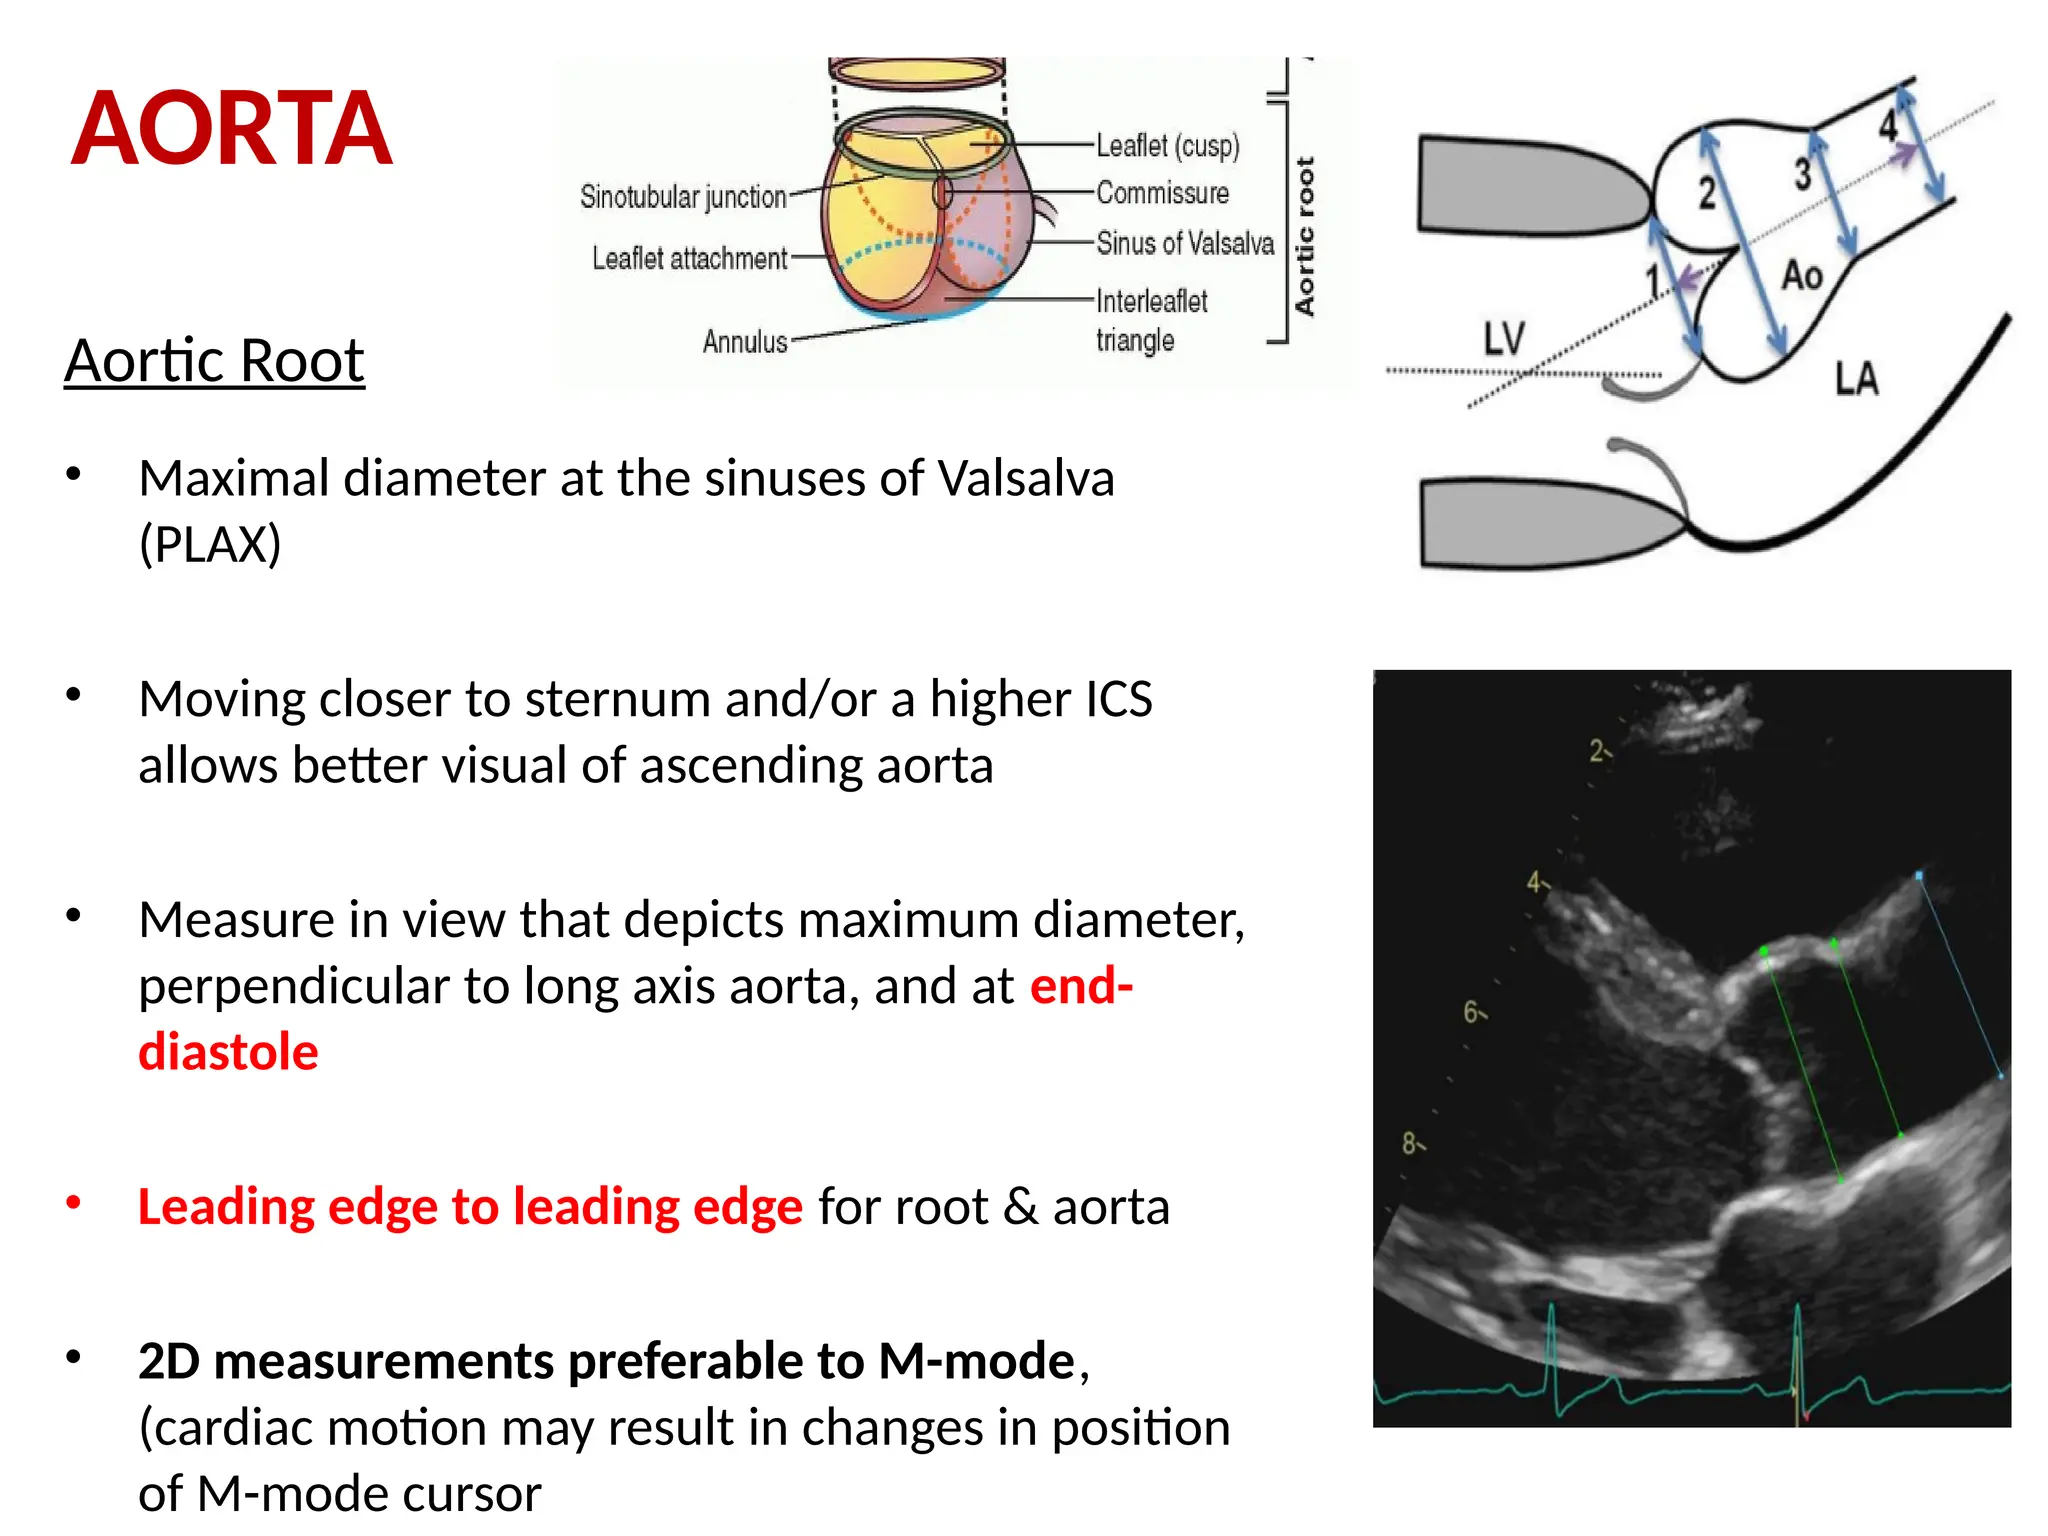
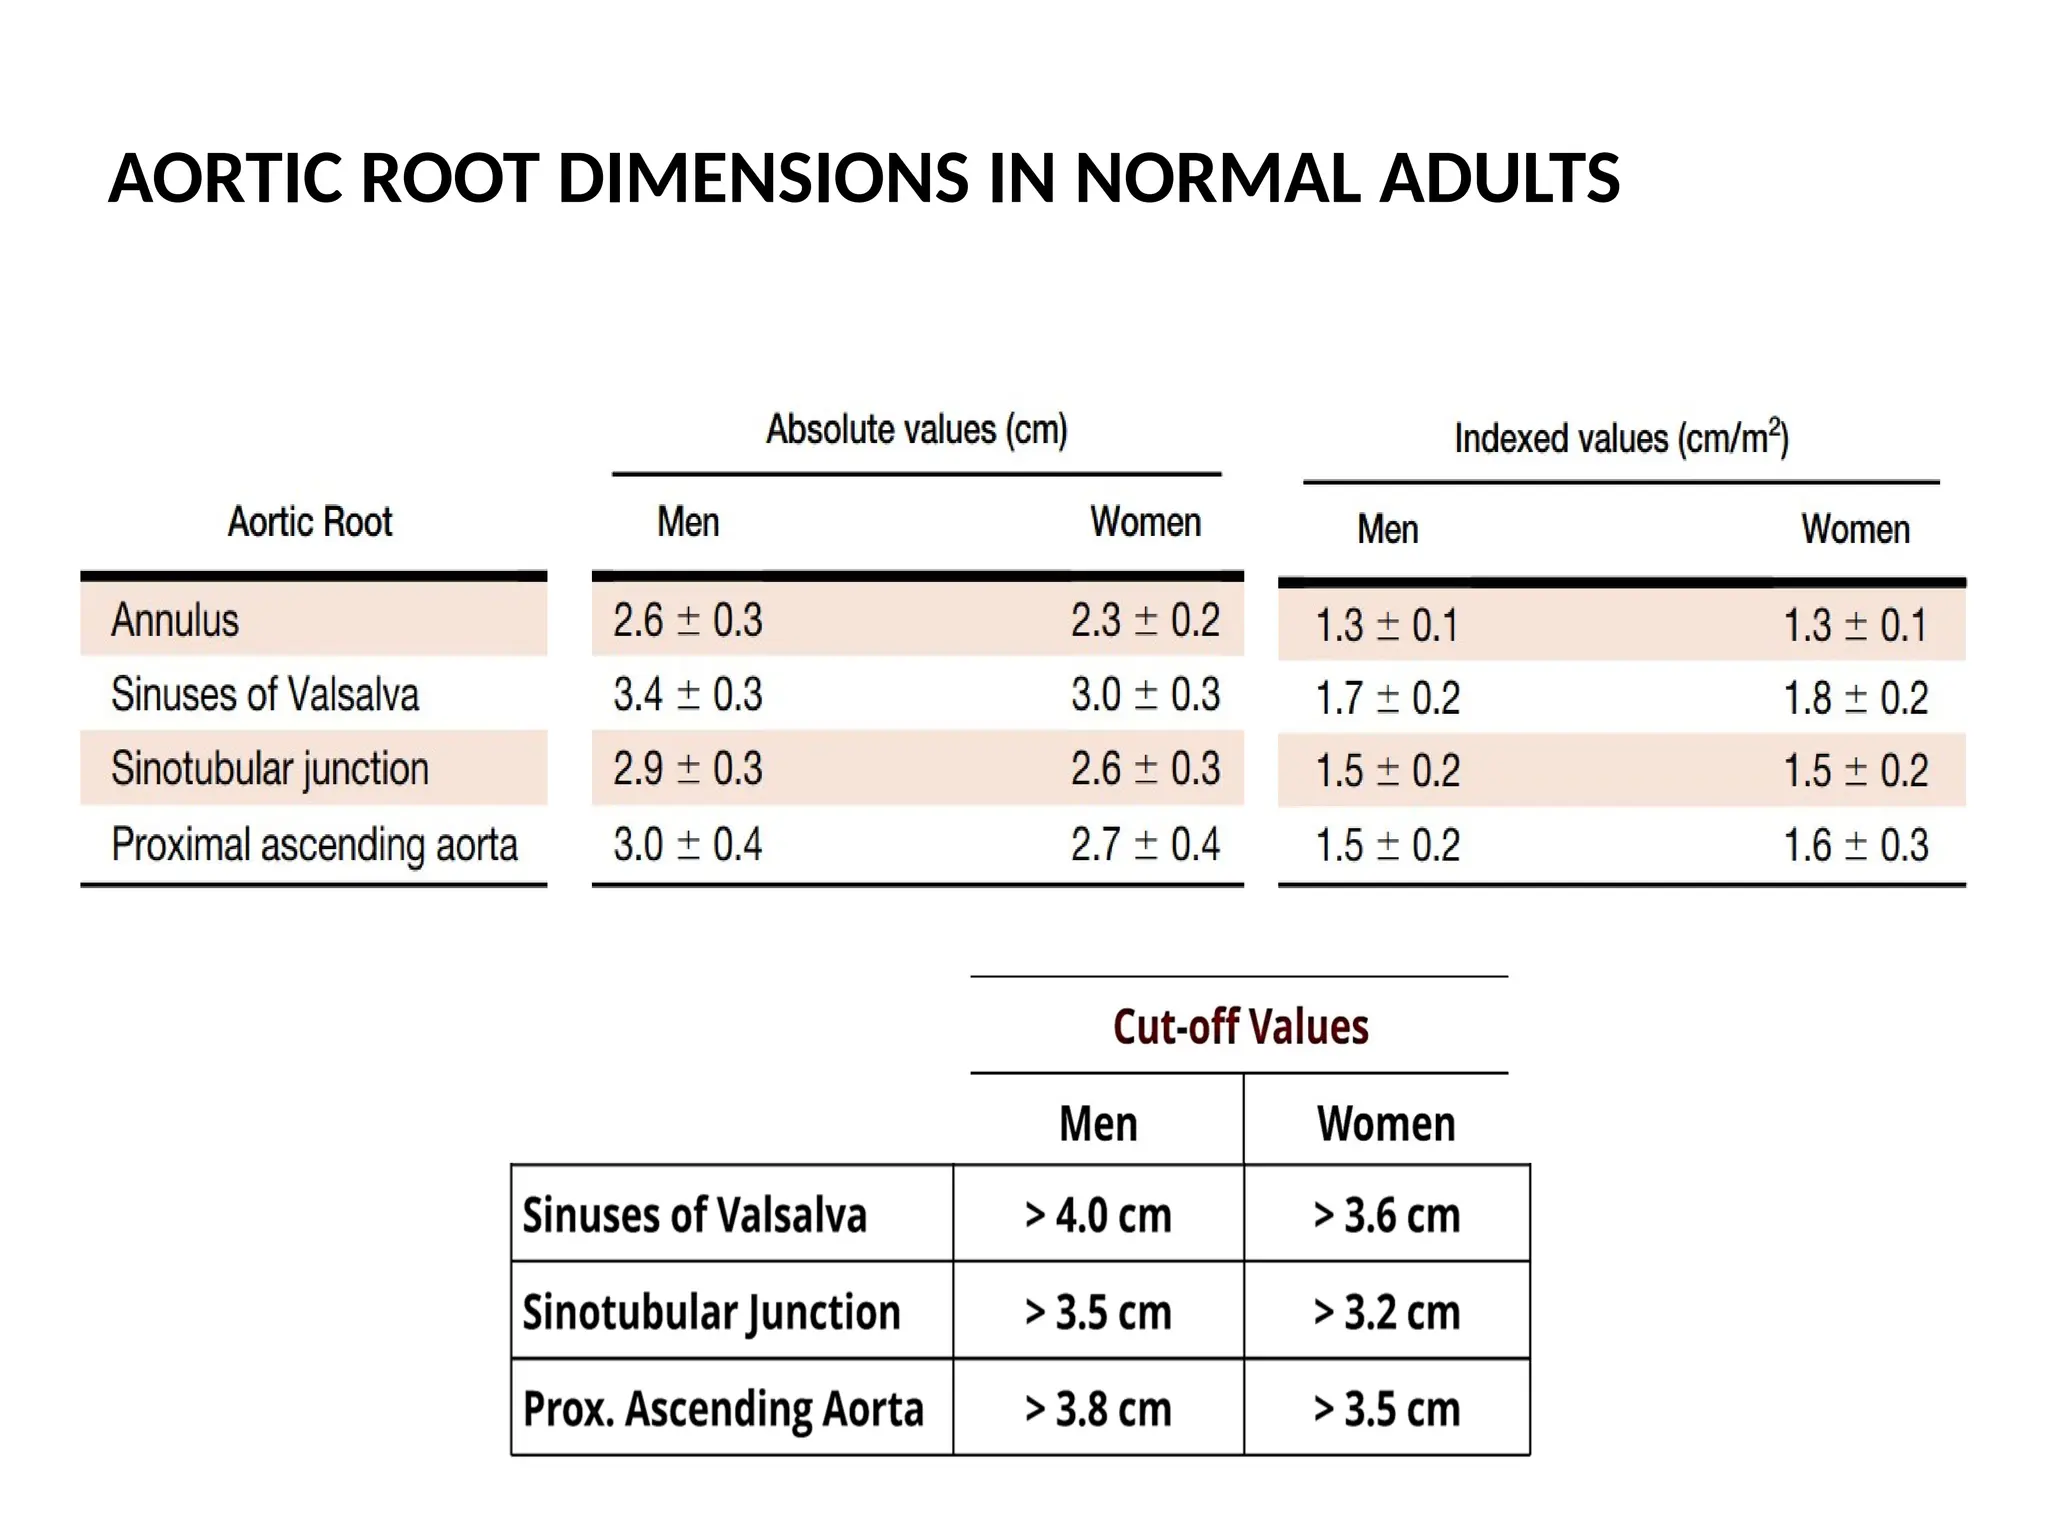
Aortic Root
• Maximaldiameter at the sinuses of Valsalva
(PLAX)
• Moving closer to sternum and/or a higher ICS
allows better visual of ascending aorta
• Measure in view that depicts maximum diameter,
perpendicular to long axis aorta, and at end-
diastole
• Leading edge to leading edge for root & aorta
• 2D measurements preferable to M-mode,
(cardiac motion may result in changes in position
of M-mode cursor
AORTA
121.
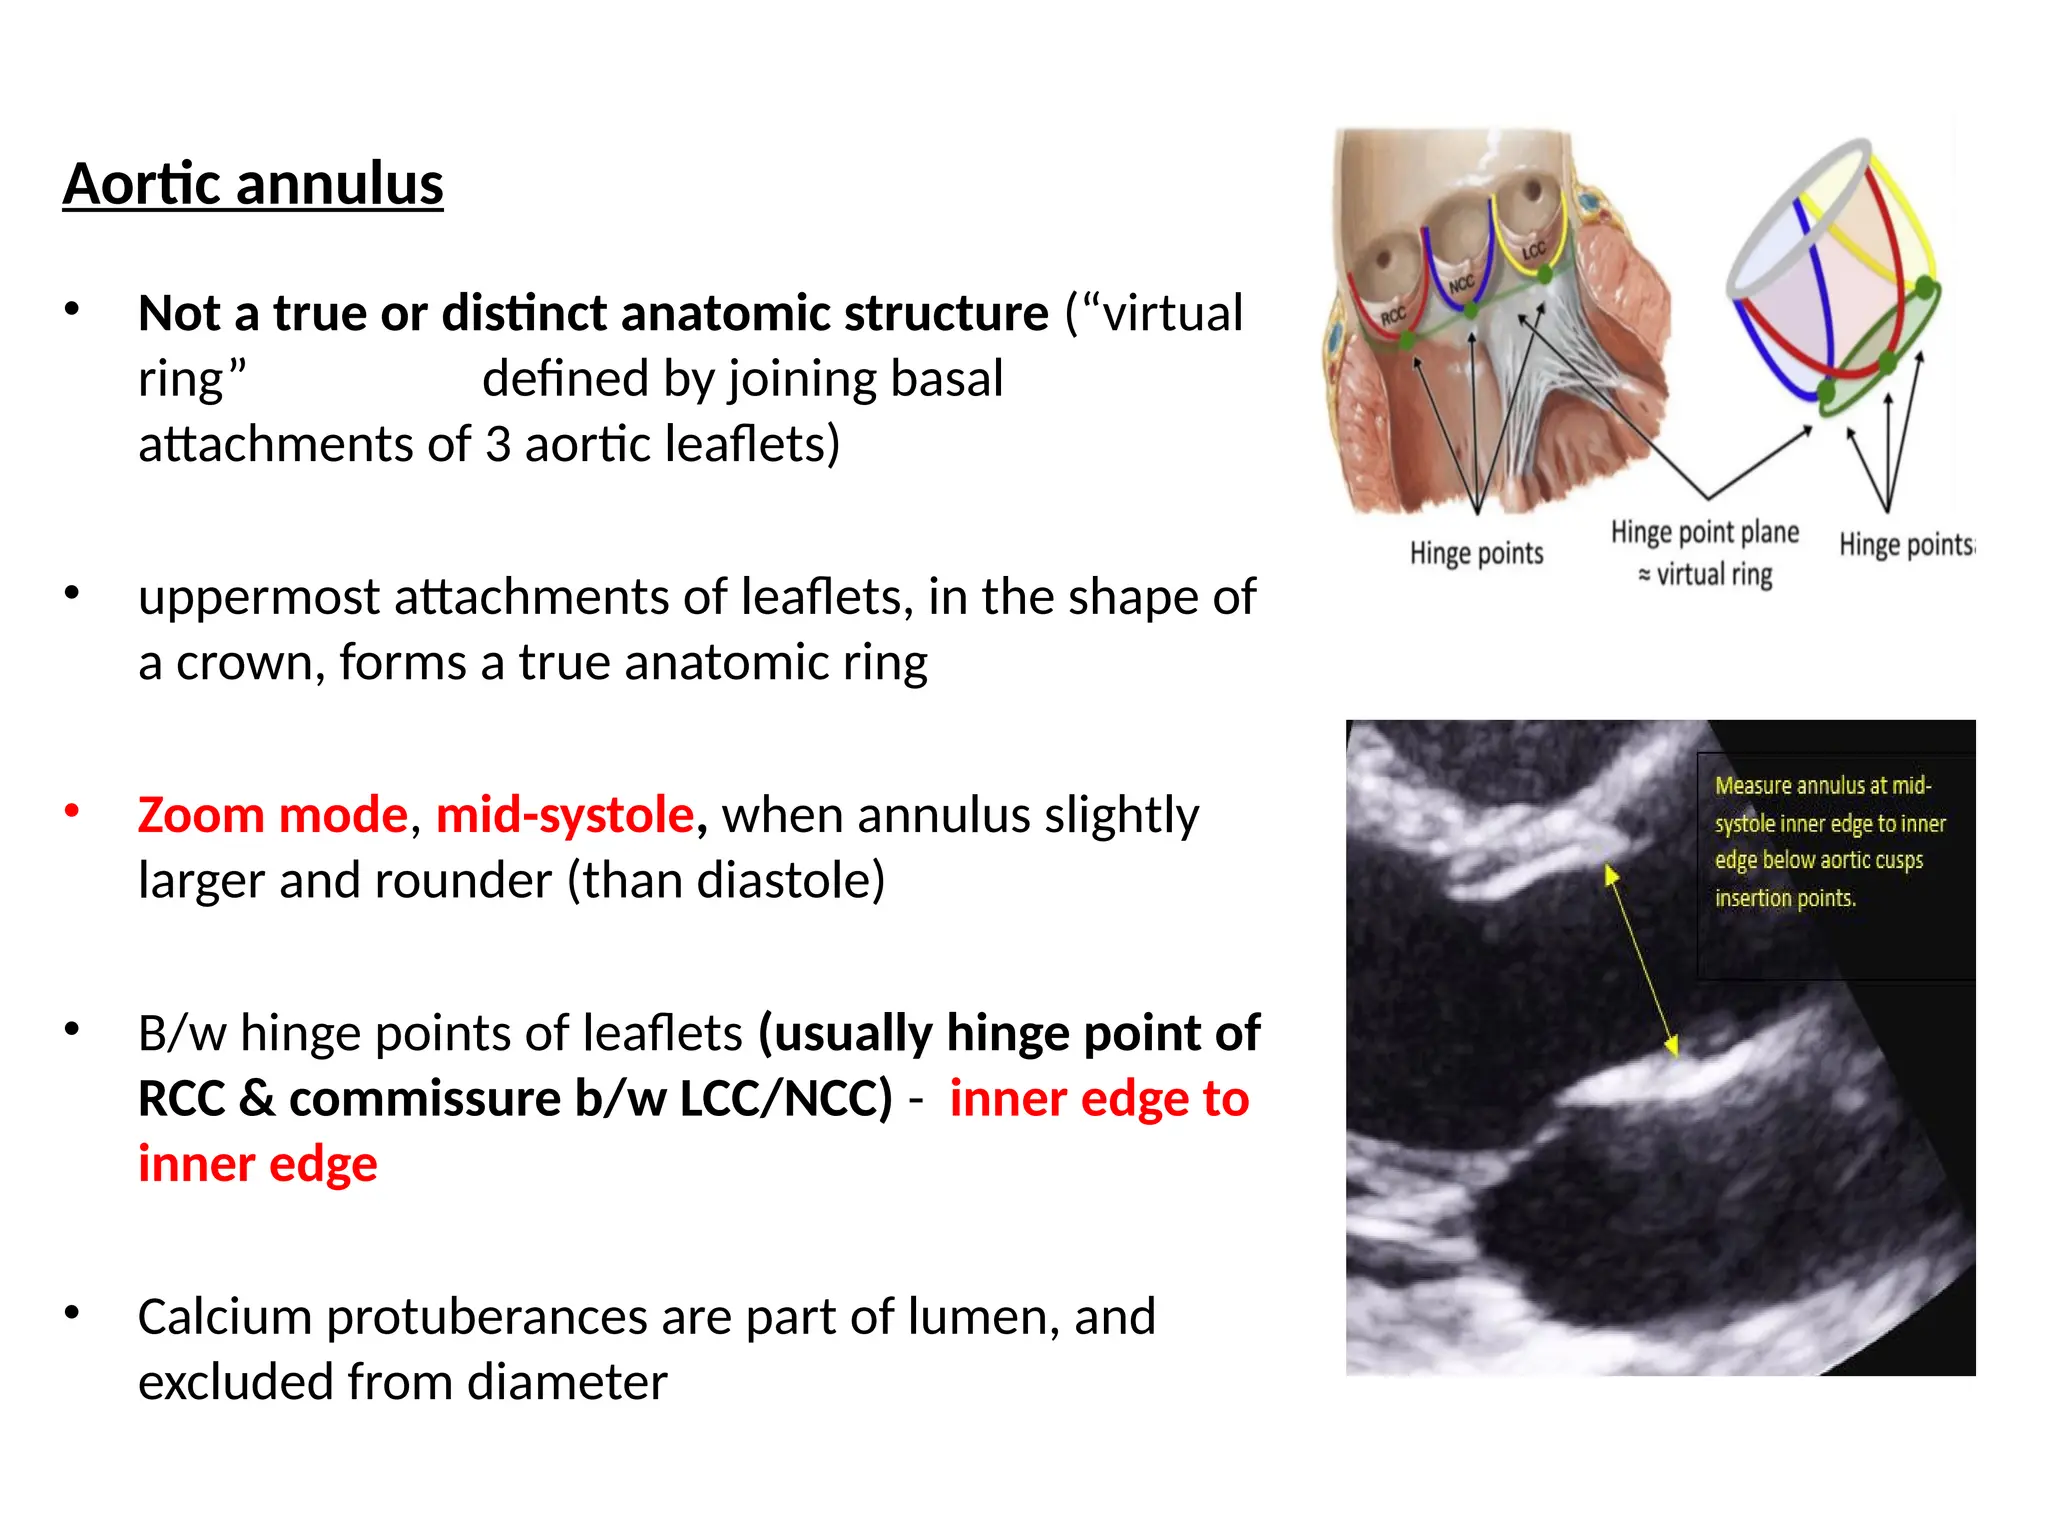
Aortic annulus
• Nota true or distinct anatomic structure (“virtual
ring” defined by joining basal
attachments of 3 aortic leaflets)
• uppermost attachments of leaflets, in the shape of
a crown, forms a true anatomic ring
• Zoom mode, mid-systole, when annulus slightly
larger and rounder (than diastole)
• B/w hinge points of leaflets (usually hinge point of
RCC & commissure b/w LCC/NCC) - inner edge to
inner edge
• Calcium protuberances are part of lumen, and
excluded from diameter
122.
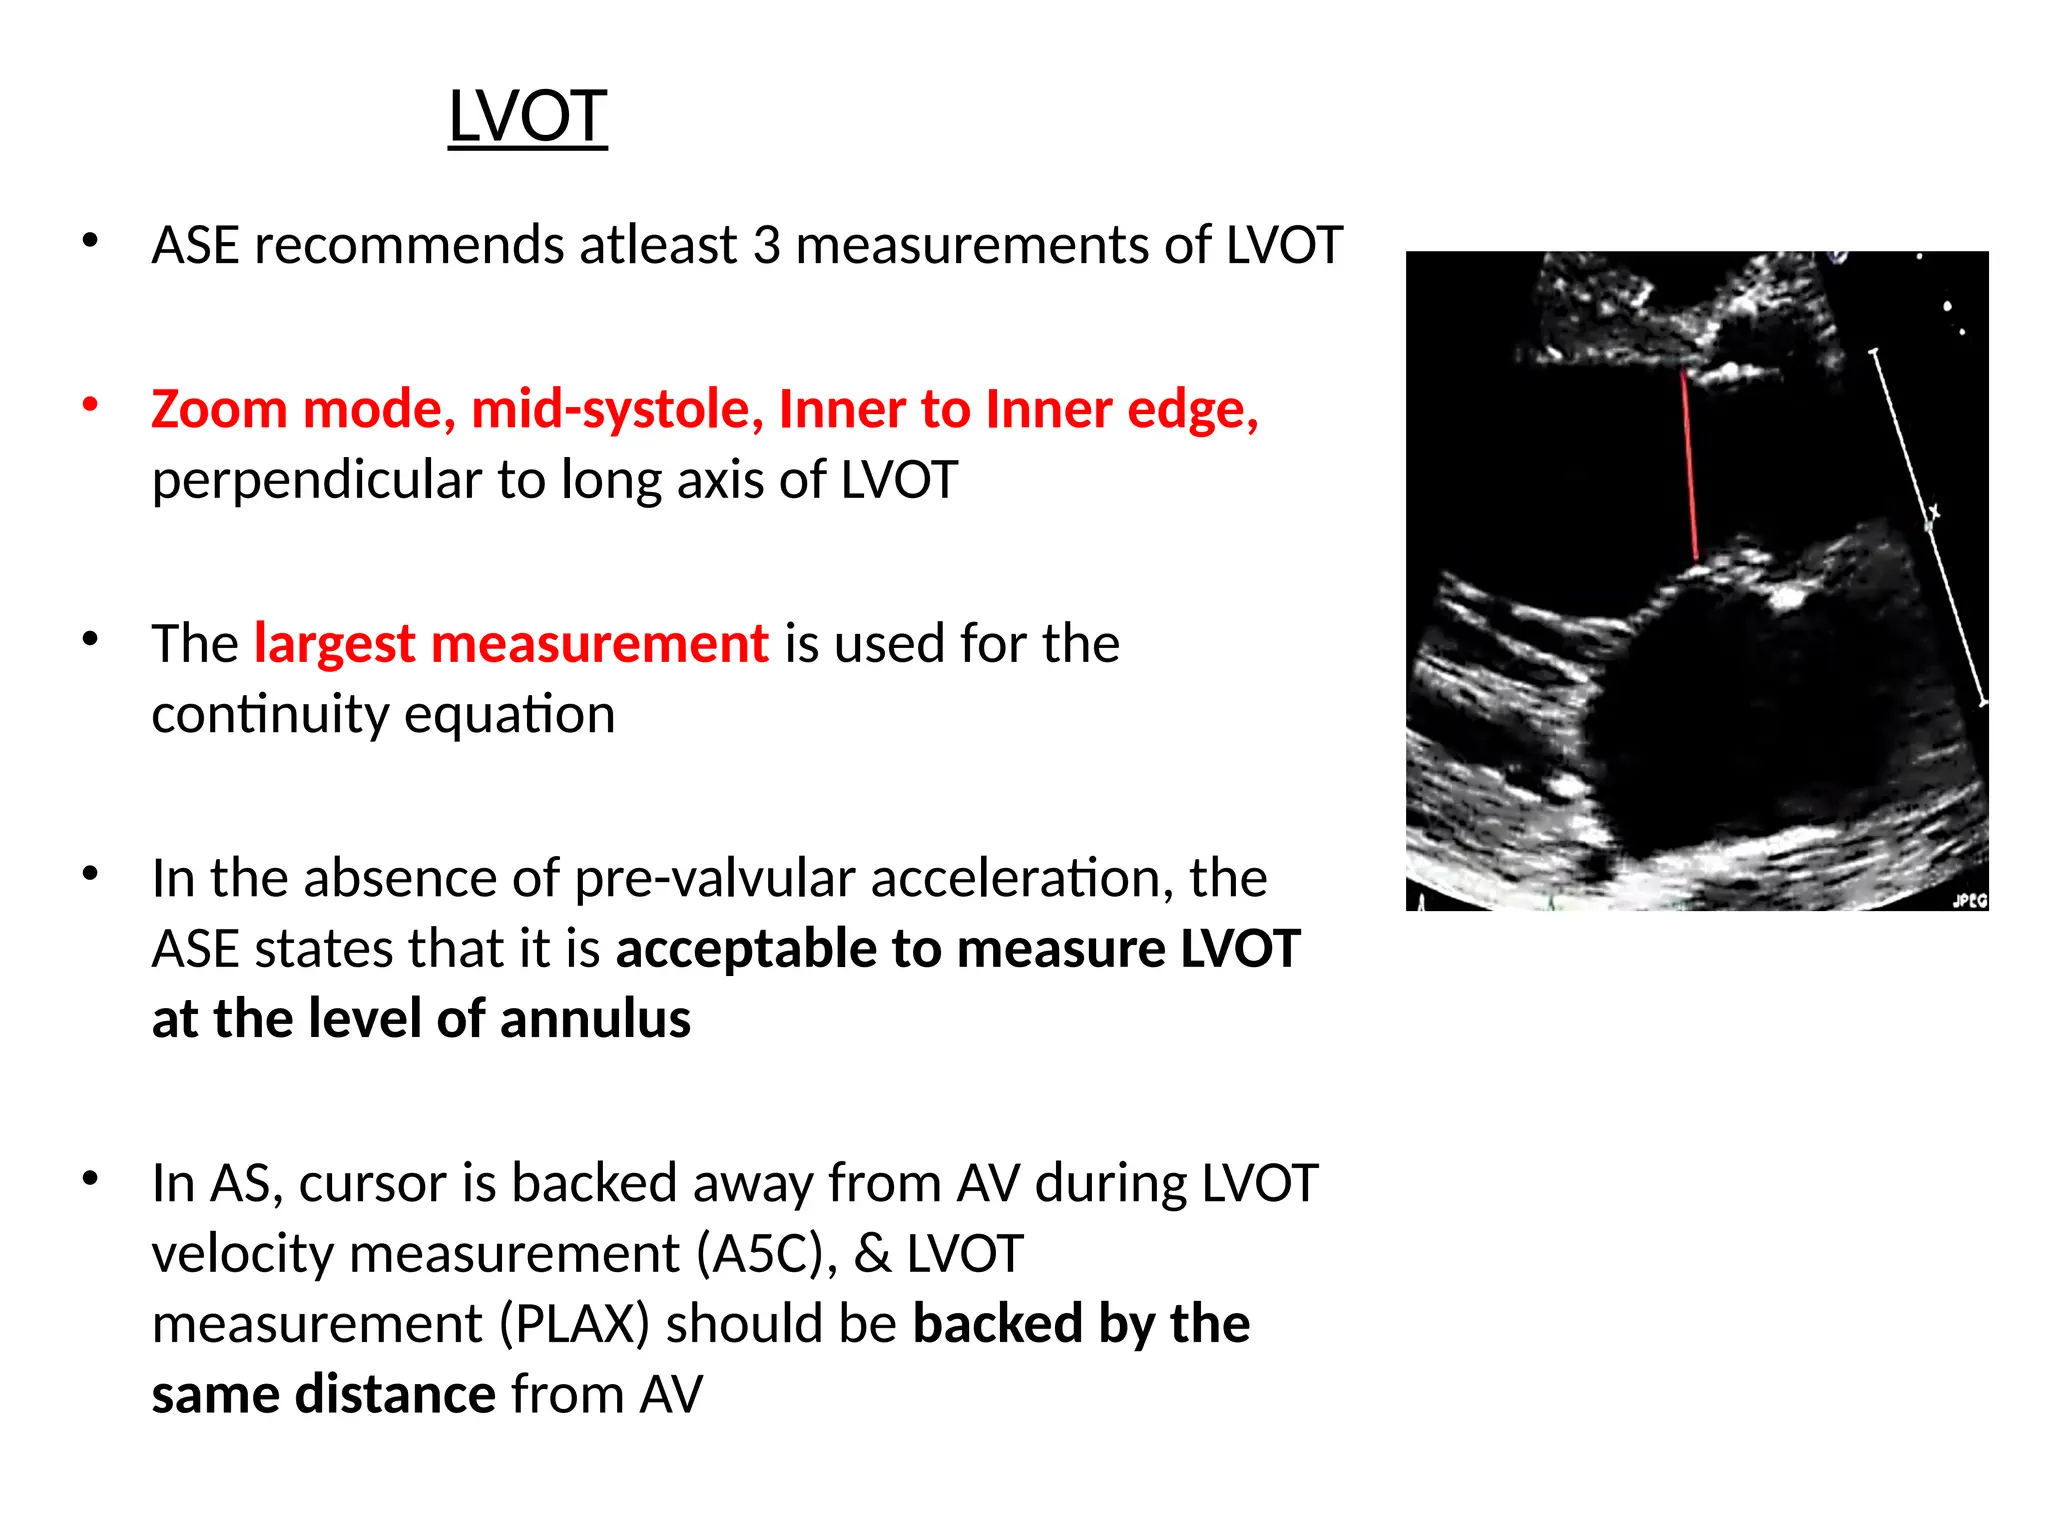
LVOT
• ASE recommendsatleast 3 measurements of LVOT
• Zoom mode, mid-systole, Inner to Inner edge,
perpendicular to long axis of LVOT
• The largest measurement is used for the
continuity equation
• In the absence of pre-valvular acceleration, the
ASE states that it is acceptable to measure LVOT
at the level of annulus
• In AS, cursor is backed away from AV during LVOT
velocity measurement (A5C), & LVOT
measurement (PLAX) should be backed by the
same distance from AV
INFERIOR VENA CAVA
2DEcho
• Subcostal long axis view, with the patient
supine
• Open up IVC, so that diameter at fullest
along the entire length
• Inner-to-Inner Edge (I-I)
• Measure perpendicular to the vessel, 1-2
cm from IVC-RA junction
• DON’T measure at the junction of IVC &
RA
125.
M-Mode (Assessing thecollapsibility/sniff
test)
• Excellent for degree of inspiratory collapse
• Better interrogation over time (pre sniff, sniff and post
sniff) in the same image
• Often requires a brief sniff, as normal inspiration may not
elicit this response
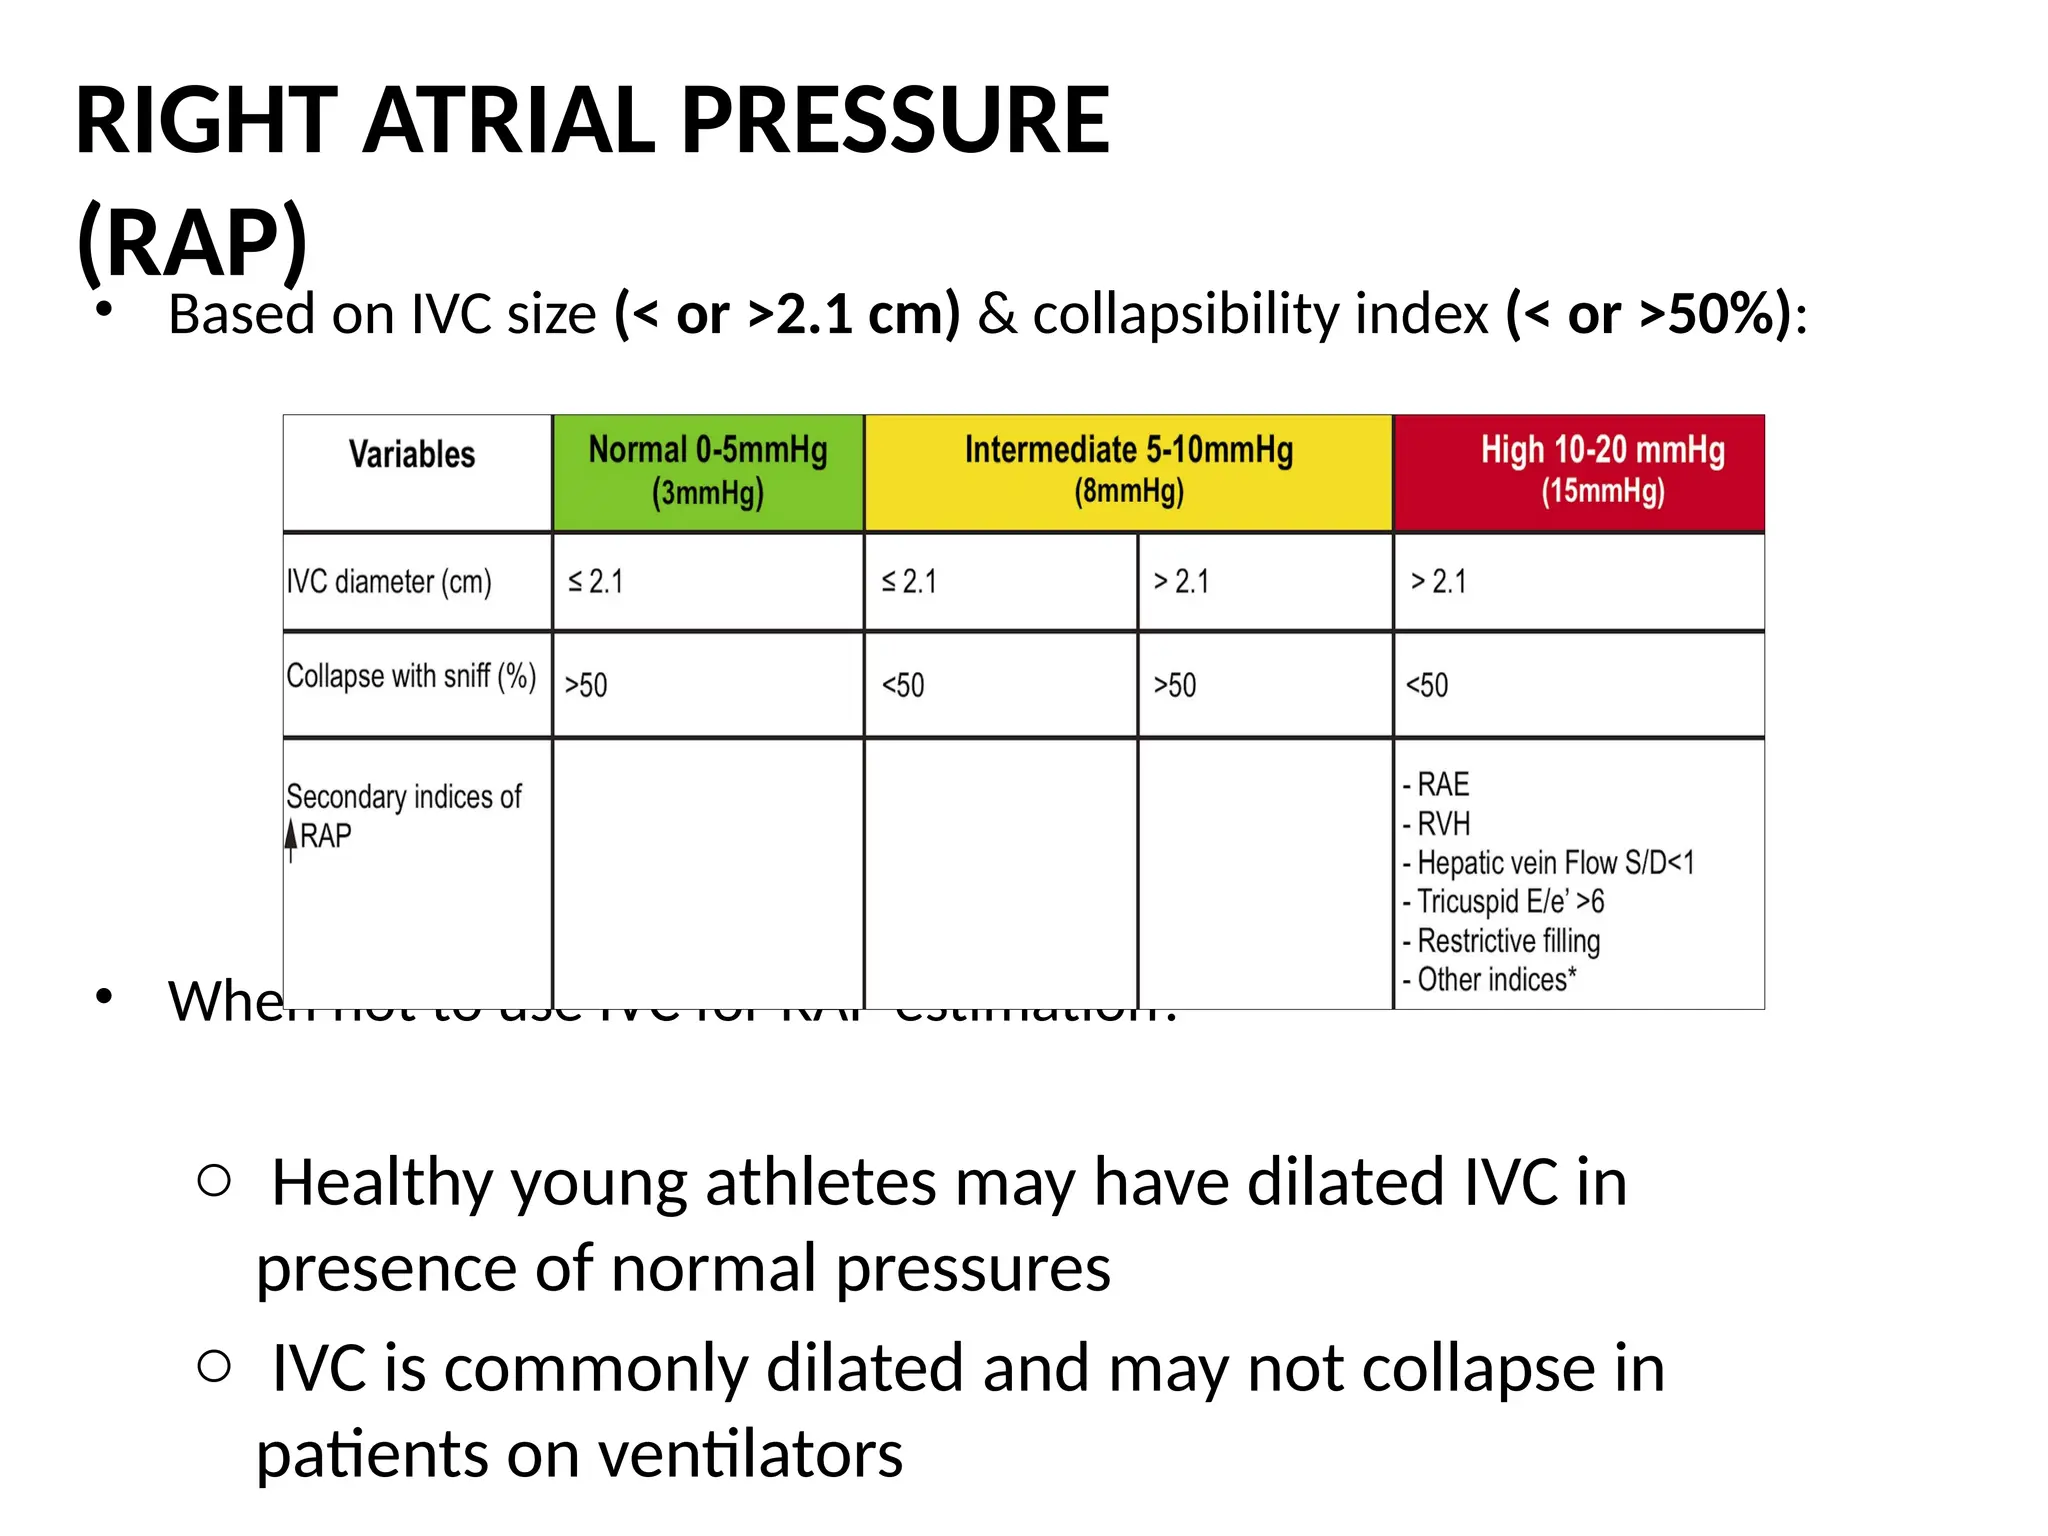
126.
• Based onIVC size (< or >2.1 cm) & collapsibility index (< or >50%):
• When not to use IVC for RAP estimation?
o Healthy young athletes may have dilated IVC in
presence of normal pressures
o IVC is commonly dilated and may not collapse in
patients on ventilators
RIGHT ATRIAL PRESSURE
(RAP)


![LV Mass
Linear Method (Cubed formula) – M MODE
Prolate ellipsoid assumption of LV, with long axis to short axis ratio 2:1
LVID, IVS, PW at end-Diastole,
LV mass = 0.8 x (1.04 x [ (IVS+LVID+PWT)3
- LVID3
] + 0.6 g
Fast and widely used
Wealth of published data
Demonstrated prognostic value
Fairly accurate in normally shaped ventricles
(i.e., systemic hypertension, aortic stenosis)
Simple for screening large populations
Over estimate LV mass
Inaccurate in asymmetric hypertrophy, DCM or disease with regional
variation in wall thickness](https://image.slidesharecdn.com/manasibasicecho-250913171839-b46b16fe/75/Basics-of-transoesphageal-echocardiography-82-2048.jpg)


![2._Intro_to_echo_and___instrumentation[1].pptx](https://cdn.slidesharecdn.com/ss_thumbnails/2-250726161338-64c6d201-thumbnail.jpg?width=640&height=640&fit=bounds)


