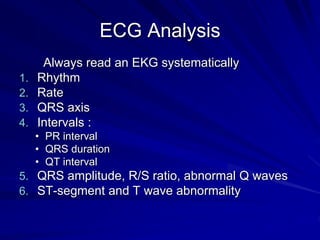
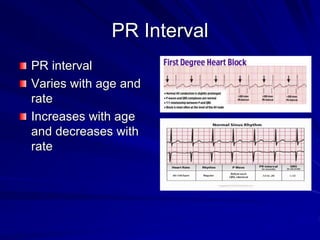
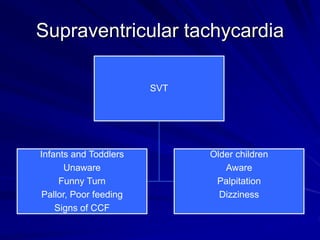
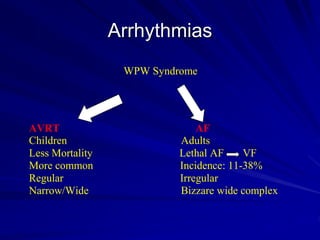
Pediatric EKG Interpretation
Introduction
Values are dynamic and change with age.
Introduction
12 lead EKG
Anatomy of an impulse
12 Lead ECG
EKG is a voltmeter ie measures voltage
which has magnitude and direction.
Voltage displayed on the Y axis
( 1mV=10mm) and time is displayed on
the x axis ( 1 little block = 0.04 seconds)
ECG Paper
ECG Lead Placement
QRS
Anatomy of an Impulse
Electrical Conduction System
ECG Analysis
Always read an EKG systematically
1. Rhythm
2. Rate
3. QRS axis
4. Intervals :
• PR interval
• QRS duration
• QT interval
5. QRS amplitude, R/S ratio, abnormal Q waves
6. ST-segment and T wave abnormality
1. Rhythm
Sinus or not
Sinus rhythm:
P before every QRS
P wave morphology
Regular PR interval
Normal P wave Axis
1. Rhythm
P wave duration < 0.07 sec in infants, <
0.09 in children
LAH duration > 0.08 sec in infants and
>0.1 sec in children
P wave amplitude < 3 mm
RAH > 3 mm
Combined atrial hypertrophy
Rhythm
2. Rate
2. Rate
1 mm = 0.04 sec, 5 mm = 0.2 sec
Measure between R – R’
measure duration in seconds, Rate =
60/duration
measure large divisions, Rate = 300/
number of large divisions
1 minute = 60 seconds, and 300 large
divisions
2. Rate
2. Rate
2. Rate
Count R-R cycles
In 6 large divisions, multiply cycles by 50
In 3 seconds = marks on top margin of
paper , multiply cycles by 20
Quick and easy; 300/150/100/75/60/50
Tachycardia and Bradycardia, check normal
values for age.
3. QRS Axis
Hexaxial System, Limb leads
Frontal Plane
Left vs right, superior and inferior
Lead I left (positive) vs right (negative)
AvF downward (positive) vs upward
(negative)
3. Axis
Horizontal Reference System
Right and left precordial leads
V2 is perpendicular to V6
V2 anterior (positive) posterior (negative)
V6 left (positive) right (negative)
V1 anterior and right (positive) posterior
and left (negative)
Axxis
3. Axis
3. QRS Axis
RAD, LAD look at normal ranges for age
Superior Axis
DDX:
Endocardial cushion defect
Tricuspid atresia
RBBB
Overlap with LAD may occur with Left anterior
hemiblock
4. Intervals
PR Interval QRS Duration and QTC Interval
PR Interval
PR interval
Varies with age and
rate
Increases with age
and decreases with
rate
4. Intervals
Increased PR interval, DDx
First degree AV block
Myocarditis, rheumatic or viral
Digitalis toxicity
ECD, ASD, Ebsteins’s anomaly
4. Intervals
Decreased PR interval, DDx:
Preexcitation
WPW
4. Intervals
QRS duration
Increases with age
Ventricular conduction Disturbances
Ventricular rhythms
QRS Duration
QRS Duration
Initial slurring: Preexcitation, WPW
Ventricular Conduction Disturbances
Terminal slurring: RBBB, LBBB
Diffuse slurring: Intraventricular block
Hyperkalemia, procainamide, quinidine,
myocardial fibrosis, myocardial
dysfunction of metabolic or ischemic
nature
Preexcitation
WPW
Short PR interval ( check tables)
Delta waves, initial slurring of QRS
Wide QRS duration
May mimic VH or RBBB
Pre-excitation WPW
Ventricular Conduction
Disturbances
Initial Slurring
Preexcitation
Diffuse Slurring
Intraventricular block
Terminal Slurring
Vent rhythm, RBBB, LBBB
Ventricular Rhythm
RBBB
Terminal Slurring is right and anterior
RAD for terminal portion
Prolonged QRS duration
Wide slurred S in I, V5 V6
Terminal slurred R’ in aVR, V4R, V1, V2
T waves inversion common in adults, but
not in children
RBBB
RBBB and LBBB
QRS duration
Ventricular Rhythms:
Premature Ventricular Conctractions
Ventricular Tachycardia
Implanted Ventricular Pacemaker
QTc interval
QTc = QT/√ R-R interval
<0.44
<0.49 in infants
QTc
QTc Interval
Increased QTc DDX;
Cardiac Causes:
Myocarditis, diffuse myocardial disease
(hypertrophic and dilated cardiomyopathy)
Long QT syndrome (Jervell and Lange –
Nielsen , Romano-Ward syndrome
Prolonged QTc Interval
None cardiac causes:
Hypocalcemia, head trauma, malnutrition
Drugs;
Antibiotics (Amp, Em,TMP-Sulfa)
Anti psychotic (phenothiazines)
Anti depressants ( tricyclic)
Anti histamines (Seldane)
Anti arrhythmic drugs
Arsenics
Organophosphates
Hypertrophy
QRS voltage:
Increases in the direction of the respective
ventricle.
Normal QRS duration
LVH increased R voltages in Leads I, II,
aVL, sometimes aVF and III, tall R’s in V5-
7 with deep S’s in V1-2 and V3R and V4R
Hypertrophy
RVH increased R in aVR and III, and deep
S in lead I, increased R in V1-2, V3R and
V4R and deep S ‘s in V5-6
Hypertrophy
Changes in T Axis
Abnormal T axis with increased QRS-T
angle = strain
Upright T waves in RPL after day 3 of life
and up to adolescence = strain
Inverted T waves in LPL = strain
Hypertrophy
Q waves
Abnormal Q waves are either deep or wide or
both.
Q waves are normally present in LPL and absent
in RPL
Deep and wide Q’s are present in myocardial
infarction
Deep Q’s are present in volume overload VH
Presence of Q’s in RPL (RVH or V inversion)
Absence in LPL ( LBBB or V inversion)
RVH
RVH
RVH
LVH
LVH
LVH
CVH
Presence of RVH and LVH criteria
Positive criteria for RVH or LVH and large
voltages for the other
Large equiphasic QRS complexes in 2 or
more limb leads and the mid precordial
leads
ST Segments
Up to 1mm elevation or depression is
acceptable in children
Examples of nonpathologic ST segment
shift: Early repolarization, J point
depression
ST Segment
St Segment
Pathologic depression;
Downward slant with a diphasic or inverted
T wave
Horizontal elevation or depression
sustained for over 0.08 seconds
ST depression; hypertrophy, strain,
ischemia, digoxin effect
ST elevation; pericarditis, injury
T waves
< ½ of QRS
Positive in I, II, aVL, V4-6
Negative in aVR, V3R, V1-2
Abnormal inverted T waves: ischemia,
hypertrophy and hyperventilation
Flattened T waves: hypokalemia
Peaked T waves : hyperkalemia,
ventricular hypertrophy or BBB
Normal Infant ECG
P wave
Atrial Contraction
Indication of atrial morphology
Does the p wave have a normal axis? (P
waves are positive in I,II and aVF)
Rt atrial enlargement: Peak P wave
>2.5mm in II, V1,V2
Lt atrial enlargement: P wave broad/bifid
(P wave 0.04 to 0.08 in infancy. 0.06 to
0.1sec in older children)
RVH
Monophasic or pure R wave in V1 V4R
Upright T wave in V1 after 7 days until 7 years
R/S ration in V1 : 0-3/12:6.5, 3-6/12:4,6/12 to
3years: 2.4 3-5 years:1.6
R in V1 >20mm at all ages
S wave in V6 >15mm in first week, 10mm up to
6 months, 7mm from 6 to 12 months, 5mm
above 1 year
T wave inversion extending to V4
Widening of QRS complex>0.08
LVH
Tall R waves in V5/V6( >40mm over
1year, >30mm under 1 year)
Deep S wave in V1
Q wave ≥4mm in V5/V6
Widening of QRS duration/Flattening of T
waves in V5, V6
T wave inversion in V5, V6 (Severe)
ST segment depression (Severe)
Electrical Heart Diseases
Tachyarrhythmia
0-5 years
Serious
Non- Specific Symptoms
Maternal History
5- 10 years
Significant
Specific Symptoms
Maternal and Patient History
10-16 years
Significant and Interesting
Specific Symptoms
Patient History
History is the
Supraventricular tachycardia
SVT
Infants and Toddlers
Unaware
Funny Turn
Pallor, Poor feeding
Signs of CCF
Older children
Aware
Palpitation
Dizziness
WPW Syndrome
Arrhythmias
WPW Syndrome
AVRT AF
Children Adults
Less Mortality Lethal AF VF
More common Incidence: 11-38%
Regular Irregular
Narrow/Wide Bizzare wide complex
Supraventricular tachycardia
Commonest tachyarrhythmia in childhood
Majority has a structurally normal heart
Short lived SVTs are not life threatening
Baseline ECG: May reveal predisposing
features
24 hour ECG
Event recorder
SVT in children
Common Arrhythmia in children
Can be asymptomatic
Adenosine mainstay for acute attacks
Chronic SVTs can lead to poor LV function
SVT
Long term treatment
No treatment
Vagal manoeuvres
Drugs
Beta Blockade: Propranolol, Atenolol
Flecanide, Amiodarone
Radiofrequency Catheter Ablation

Pediatric-EKG-Interpretation-2018.ppt

  • 1.
  • 2.
    Introduction Values are dynamicand change with age.
  • 3.
  • 4.
    12 Lead ECG EKGis a voltmeter ie measures voltage which has magnitude and direction. Voltage displayed on the Y axis ( 1mV=10mm) and time is displayed on the x axis ( 1 little block = 0.04 seconds)
  • 5.
  • 6.
  • 7.
  • 8.
  • 9.
  • 11.
    ECG Analysis Always readan EKG systematically 1. Rhythm 2. Rate 3. QRS axis 4. Intervals : • PR interval • QRS duration • QT interval 5. QRS amplitude, R/S ratio, abnormal Q waves 6. ST-segment and T wave abnormality
  • 12.
    1. Rhythm Sinus ornot Sinus rhythm: P before every QRS P wave morphology Regular PR interval Normal P wave Axis
  • 13.
    1. Rhythm P waveduration < 0.07 sec in infants, < 0.09 in children LAH duration > 0.08 sec in infants and >0.1 sec in children P wave amplitude < 3 mm RAH > 3 mm Combined atrial hypertrophy
  • 14.
  • 15.
  • 16.
    2. Rate 1 mm= 0.04 sec, 5 mm = 0.2 sec Measure between R – R’ measure duration in seconds, Rate = 60/duration measure large divisions, Rate = 300/ number of large divisions 1 minute = 60 seconds, and 300 large divisions
  • 17.
  • 18.
  • 19.
    2. Rate Count R-Rcycles In 6 large divisions, multiply cycles by 50 In 3 seconds = marks on top margin of paper , multiply cycles by 20 Quick and easy; 300/150/100/75/60/50 Tachycardia and Bradycardia, check normal values for age.
  • 20.
    3. QRS Axis HexaxialSystem, Limb leads Frontal Plane Left vs right, superior and inferior Lead I left (positive) vs right (negative) AvF downward (positive) vs upward (negative)
  • 21.
  • 22.
    Horizontal Reference System Rightand left precordial leads V2 is perpendicular to V6 V2 anterior (positive) posterior (negative) V6 left (positive) right (negative) V1 anterior and right (positive) posterior and left (negative)
  • 23.
  • 24.
  • 25.
    3. QRS Axis RAD,LAD look at normal ranges for age Superior Axis DDX: Endocardial cushion defect Tricuspid atresia RBBB Overlap with LAD may occur with Left anterior hemiblock
  • 26.
    4. Intervals PR IntervalQRS Duration and QTC Interval
  • 27.
    PR Interval PR interval Varieswith age and rate Increases with age and decreases with rate
  • 28.
    4. Intervals Increased PRinterval, DDx First degree AV block Myocarditis, rheumatic or viral Digitalis toxicity ECD, ASD, Ebsteins’s anomaly
  • 29.
    4. Intervals Decreased PRinterval, DDx: Preexcitation WPW
  • 30.
    4. Intervals QRS duration Increaseswith age Ventricular conduction Disturbances Ventricular rhythms
  • 31.
  • 32.
    QRS Duration Initial slurring:Preexcitation, WPW Ventricular Conduction Disturbances Terminal slurring: RBBB, LBBB Diffuse slurring: Intraventricular block Hyperkalemia, procainamide, quinidine, myocardial fibrosis, myocardial dysfunction of metabolic or ischemic nature
  • 33.
    Preexcitation WPW Short PR interval( check tables) Delta waves, initial slurring of QRS Wide QRS duration May mimic VH or RBBB
  • 34.
  • 35.
    Ventricular Conduction Disturbances Initial Slurring Preexcitation DiffuseSlurring Intraventricular block Terminal Slurring Vent rhythm, RBBB, LBBB
  • 36.
  • 37.
    RBBB Terminal Slurring isright and anterior RAD for terminal portion Prolonged QRS duration Wide slurred S in I, V5 V6 Terminal slurred R’ in aVR, V4R, V1, V2 T waves inversion common in adults, but not in children
  • 38.
  • 39.
  • 41.
    QRS duration Ventricular Rhythms: PrematureVentricular Conctractions Ventricular Tachycardia Implanted Ventricular Pacemaker
  • 42.
    QTc interval QTc =QT/√ R-R interval <0.44 <0.49 in infants
  • 43.
  • 44.
    QTc Interval Increased QTcDDX; Cardiac Causes: Myocarditis, diffuse myocardial disease (hypertrophic and dilated cardiomyopathy) Long QT syndrome (Jervell and Lange – Nielsen , Romano-Ward syndrome
  • 45.
    Prolonged QTc Interval Nonecardiac causes: Hypocalcemia, head trauma, malnutrition Drugs; Antibiotics (Amp, Em,TMP-Sulfa) Anti psychotic (phenothiazines) Anti depressants ( tricyclic) Anti histamines (Seldane) Anti arrhythmic drugs Arsenics Organophosphates
  • 46.
    Hypertrophy QRS voltage: Increases inthe direction of the respective ventricle. Normal QRS duration LVH increased R voltages in Leads I, II, aVL, sometimes aVF and III, tall R’s in V5- 7 with deep S’s in V1-2 and V3R and V4R
  • 47.
    Hypertrophy RVH increased Rin aVR and III, and deep S in lead I, increased R in V1-2, V3R and V4R and deep S ‘s in V5-6
  • 48.
    Hypertrophy Changes in TAxis Abnormal T axis with increased QRS-T angle = strain Upright T waves in RPL after day 3 of life and up to adolescence = strain Inverted T waves in LPL = strain
  • 49.
    Hypertrophy Q waves Abnormal Qwaves are either deep or wide or both. Q waves are normally present in LPL and absent in RPL Deep and wide Q’s are present in myocardial infarction Deep Q’s are present in volume overload VH Presence of Q’s in RPL (RVH or V inversion) Absence in LPL ( LBBB or V inversion)
  • 50.
  • 51.
  • 52.
  • 53.
  • 54.
    CVH Presence of RVHand LVH criteria Positive criteria for RVH or LVH and large voltages for the other Large equiphasic QRS complexes in 2 or more limb leads and the mid precordial leads
  • 55.
    ST Segments Up to1mm elevation or depression is acceptable in children Examples of nonpathologic ST segment shift: Early repolarization, J point depression
  • 56.
  • 57.
    St Segment Pathologic depression; Downwardslant with a diphasic or inverted T wave Horizontal elevation or depression sustained for over 0.08 seconds ST depression; hypertrophy, strain, ischemia, digoxin effect ST elevation; pericarditis, injury
  • 58.
    T waves < ½of QRS Positive in I, II, aVL, V4-6 Negative in aVR, V3R, V1-2 Abnormal inverted T waves: ischemia, hypertrophy and hyperventilation Flattened T waves: hypokalemia Peaked T waves : hyperkalemia, ventricular hypertrophy or BBB
  • 59.
  • 60.
    P wave Atrial Contraction Indicationof atrial morphology Does the p wave have a normal axis? (P waves are positive in I,II and aVF) Rt atrial enlargement: Peak P wave >2.5mm in II, V1,V2 Lt atrial enlargement: P wave broad/bifid (P wave 0.04 to 0.08 in infancy. 0.06 to 0.1sec in older children)
  • 61.
    RVH Monophasic or pureR wave in V1 V4R Upright T wave in V1 after 7 days until 7 years R/S ration in V1 : 0-3/12:6.5, 3-6/12:4,6/12 to 3years: 2.4 3-5 years:1.6 R in V1 >20mm at all ages S wave in V6 >15mm in first week, 10mm up to 6 months, 7mm from 6 to 12 months, 5mm above 1 year T wave inversion extending to V4 Widening of QRS complex>0.08
  • 62.
    LVH Tall R wavesin V5/V6( >40mm over 1year, >30mm under 1 year) Deep S wave in V1 Q wave ≥4mm in V5/V6 Widening of QRS duration/Flattening of T waves in V5, V6 T wave inversion in V5, V6 (Severe) ST segment depression (Severe)
  • 63.
    Electrical Heart Diseases Tachyarrhythmia 0-5years Serious Non- Specific Symptoms Maternal History 5- 10 years Significant Specific Symptoms Maternal and Patient History 10-16 years Significant and Interesting Specific Symptoms Patient History History is the
  • 64.
    Supraventricular tachycardia SVT Infants andToddlers Unaware Funny Turn Pallor, Poor feeding Signs of CCF Older children Aware Palpitation Dizziness
  • 65.
  • 66.
    Arrhythmias WPW Syndrome AVRT AF ChildrenAdults Less Mortality Lethal AF VF More common Incidence: 11-38% Regular Irregular Narrow/Wide Bizzare wide complex
  • 67.
    Supraventricular tachycardia Commonest tachyarrhythmiain childhood Majority has a structurally normal heart Short lived SVTs are not life threatening Baseline ECG: May reveal predisposing features 24 hour ECG Event recorder
  • 68.
    SVT in children CommonArrhythmia in children Can be asymptomatic Adenosine mainstay for acute attacks Chronic SVTs can lead to poor LV function
  • 69.
    SVT Long term treatment Notreatment Vagal manoeuvres Drugs Beta Blockade: Propranolol, Atenolol Flecanide, Amiodarone Radiofrequency Catheter Ablation