This document provides an overview of key concepts in statistics including:
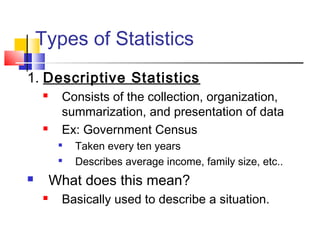
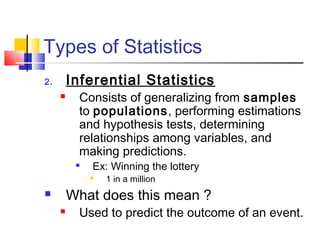
- Descriptive statistics which summarize and describe data, and inferential statistics which make predictions based on samples.
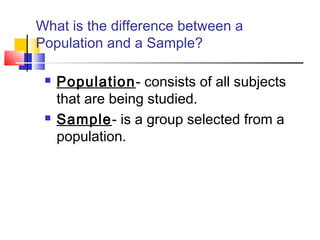
- The difference between a population, which is all subjects being studied, and a sample, which is a subset selected from the population.
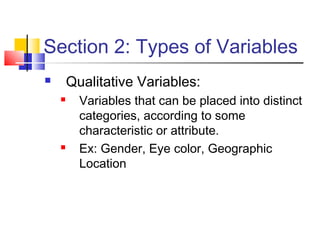
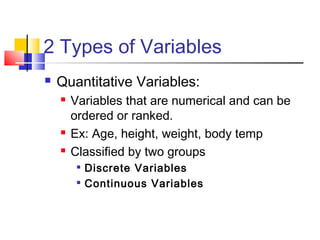
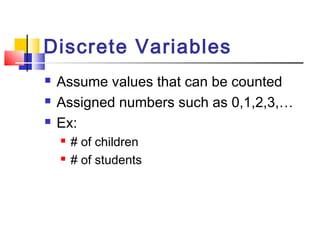
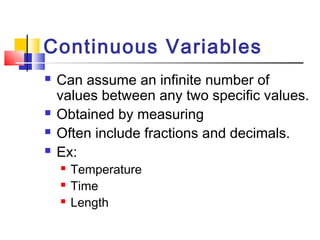
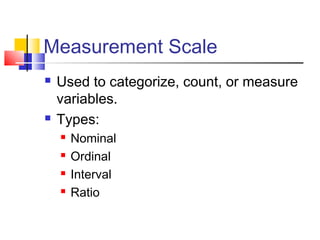
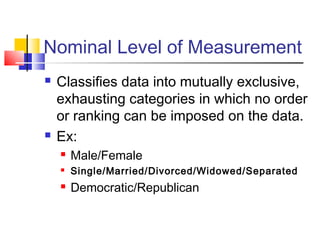
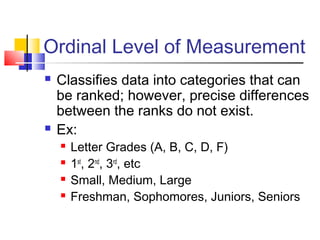
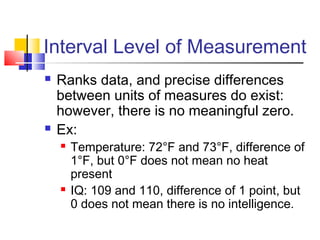
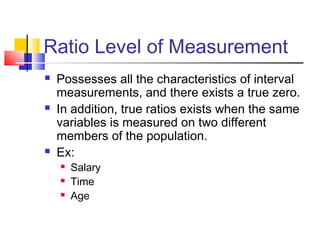
- Types of variables like qualitative, quantitative, discrete, continuous and different measurement scales.
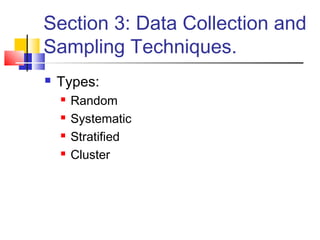
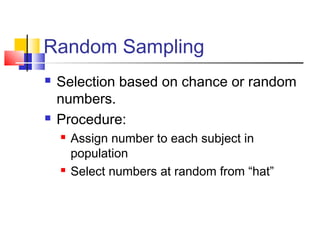
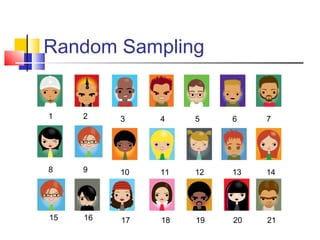
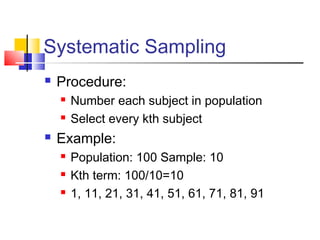
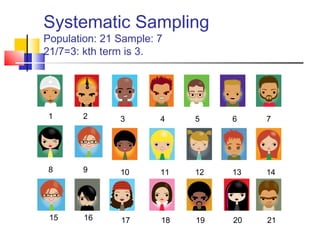
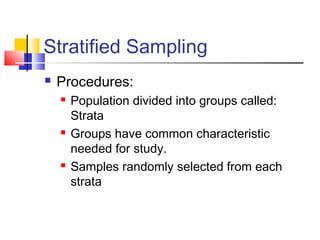
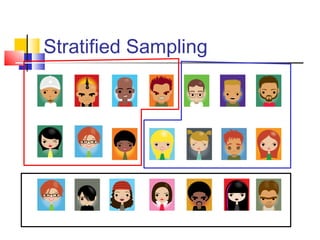
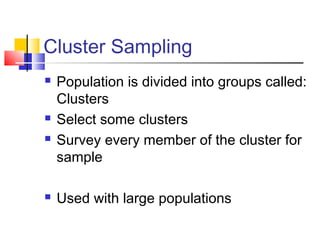
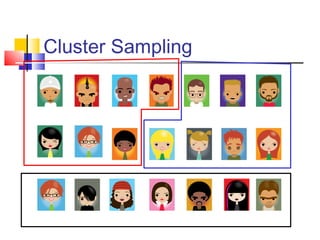
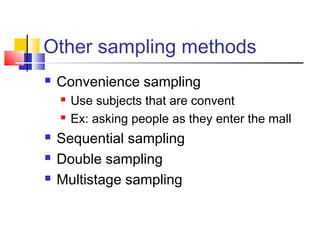
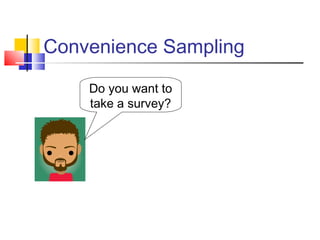
- Various data collection methods like random, systematic, stratified and cluster sampling.
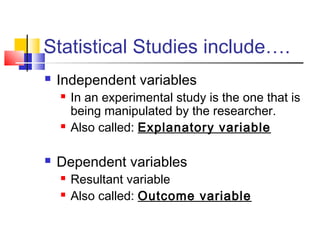
- The two main types of statistical studies - observational which observes phenomena, and experimental which manipulates variables.
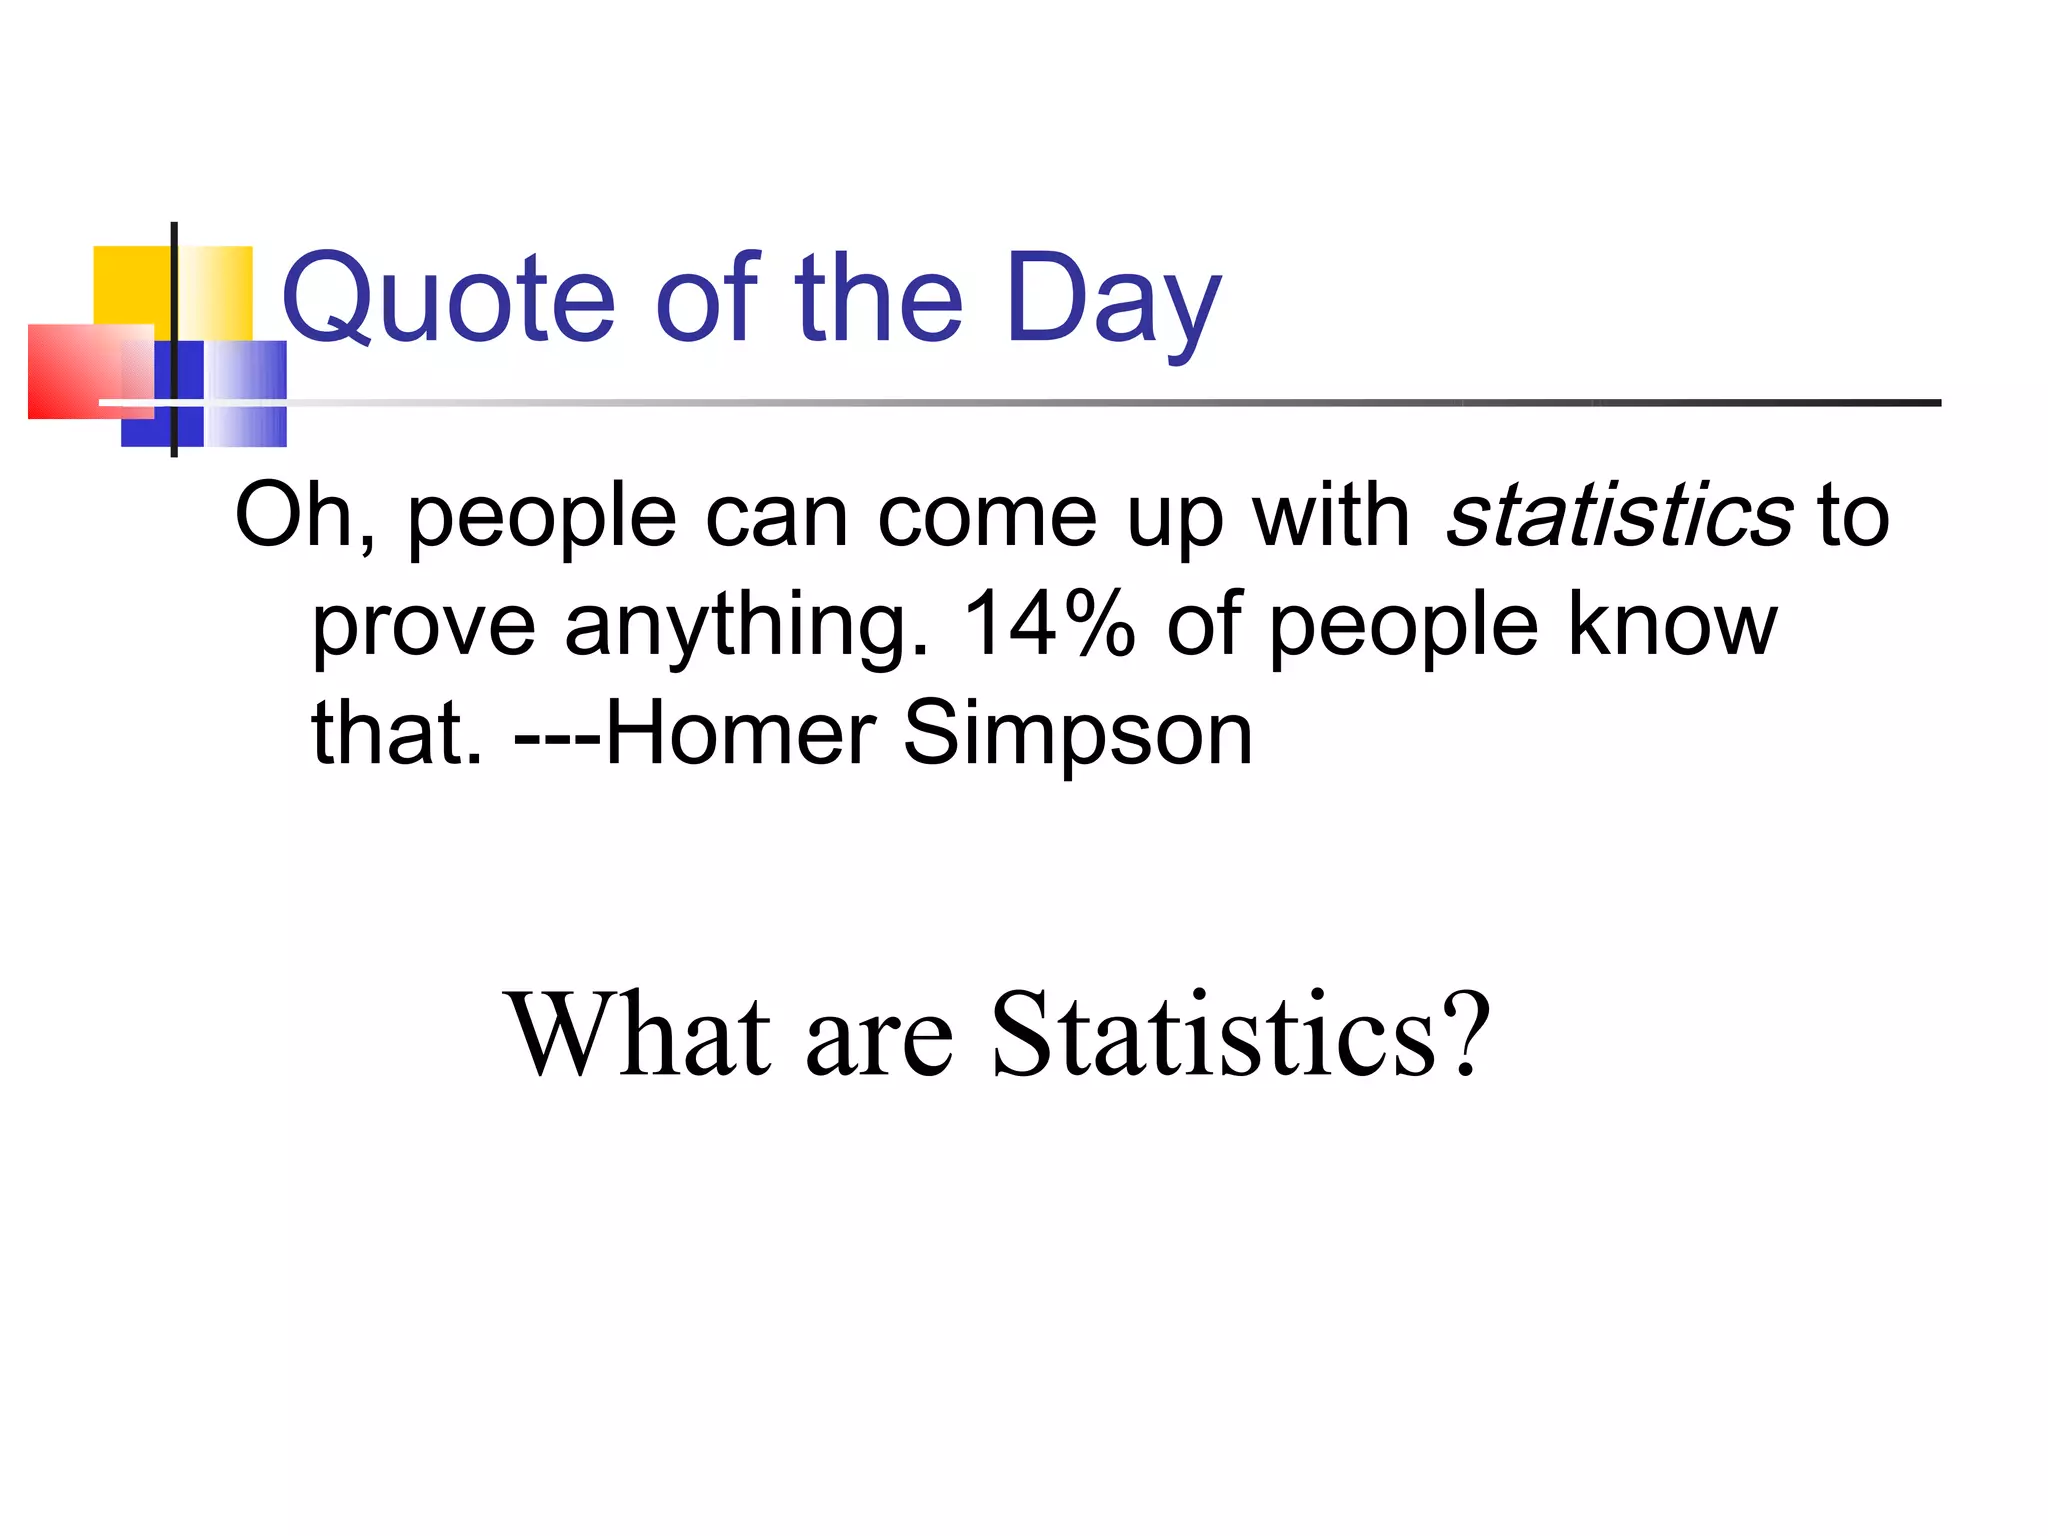
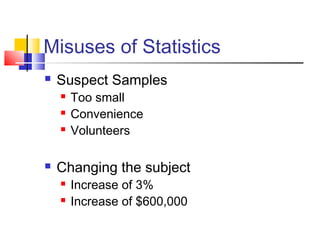
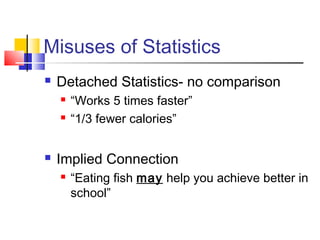
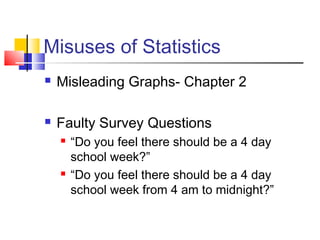
- Common statistical terms like independent and dependent variables and misuses of statistics to mislead.