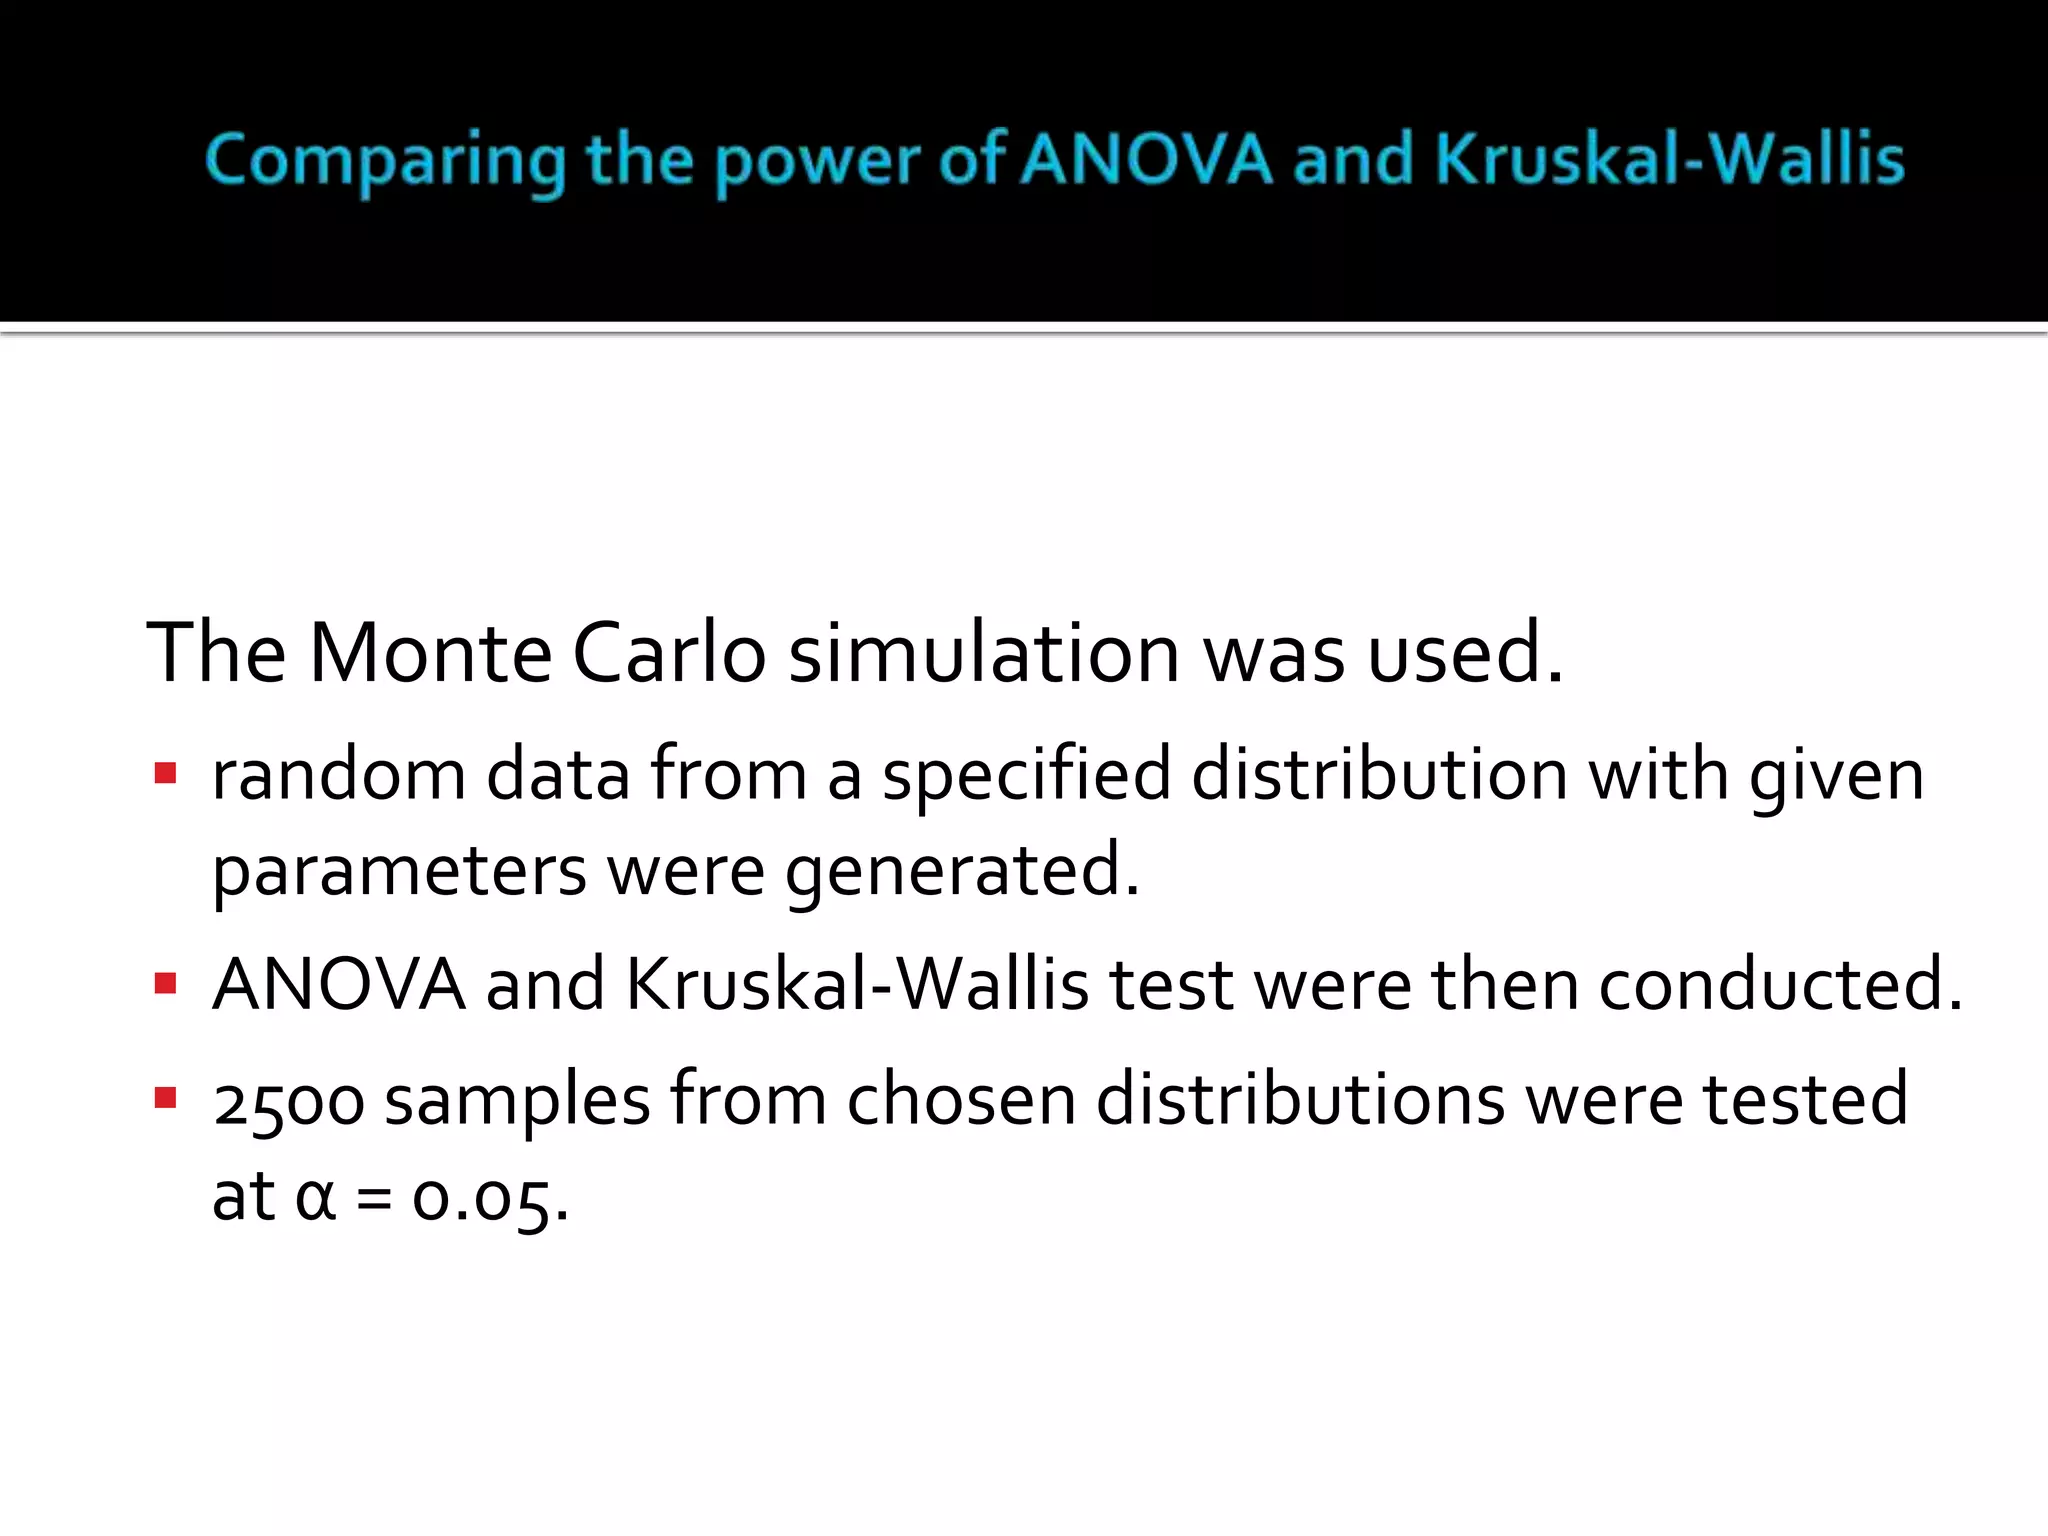
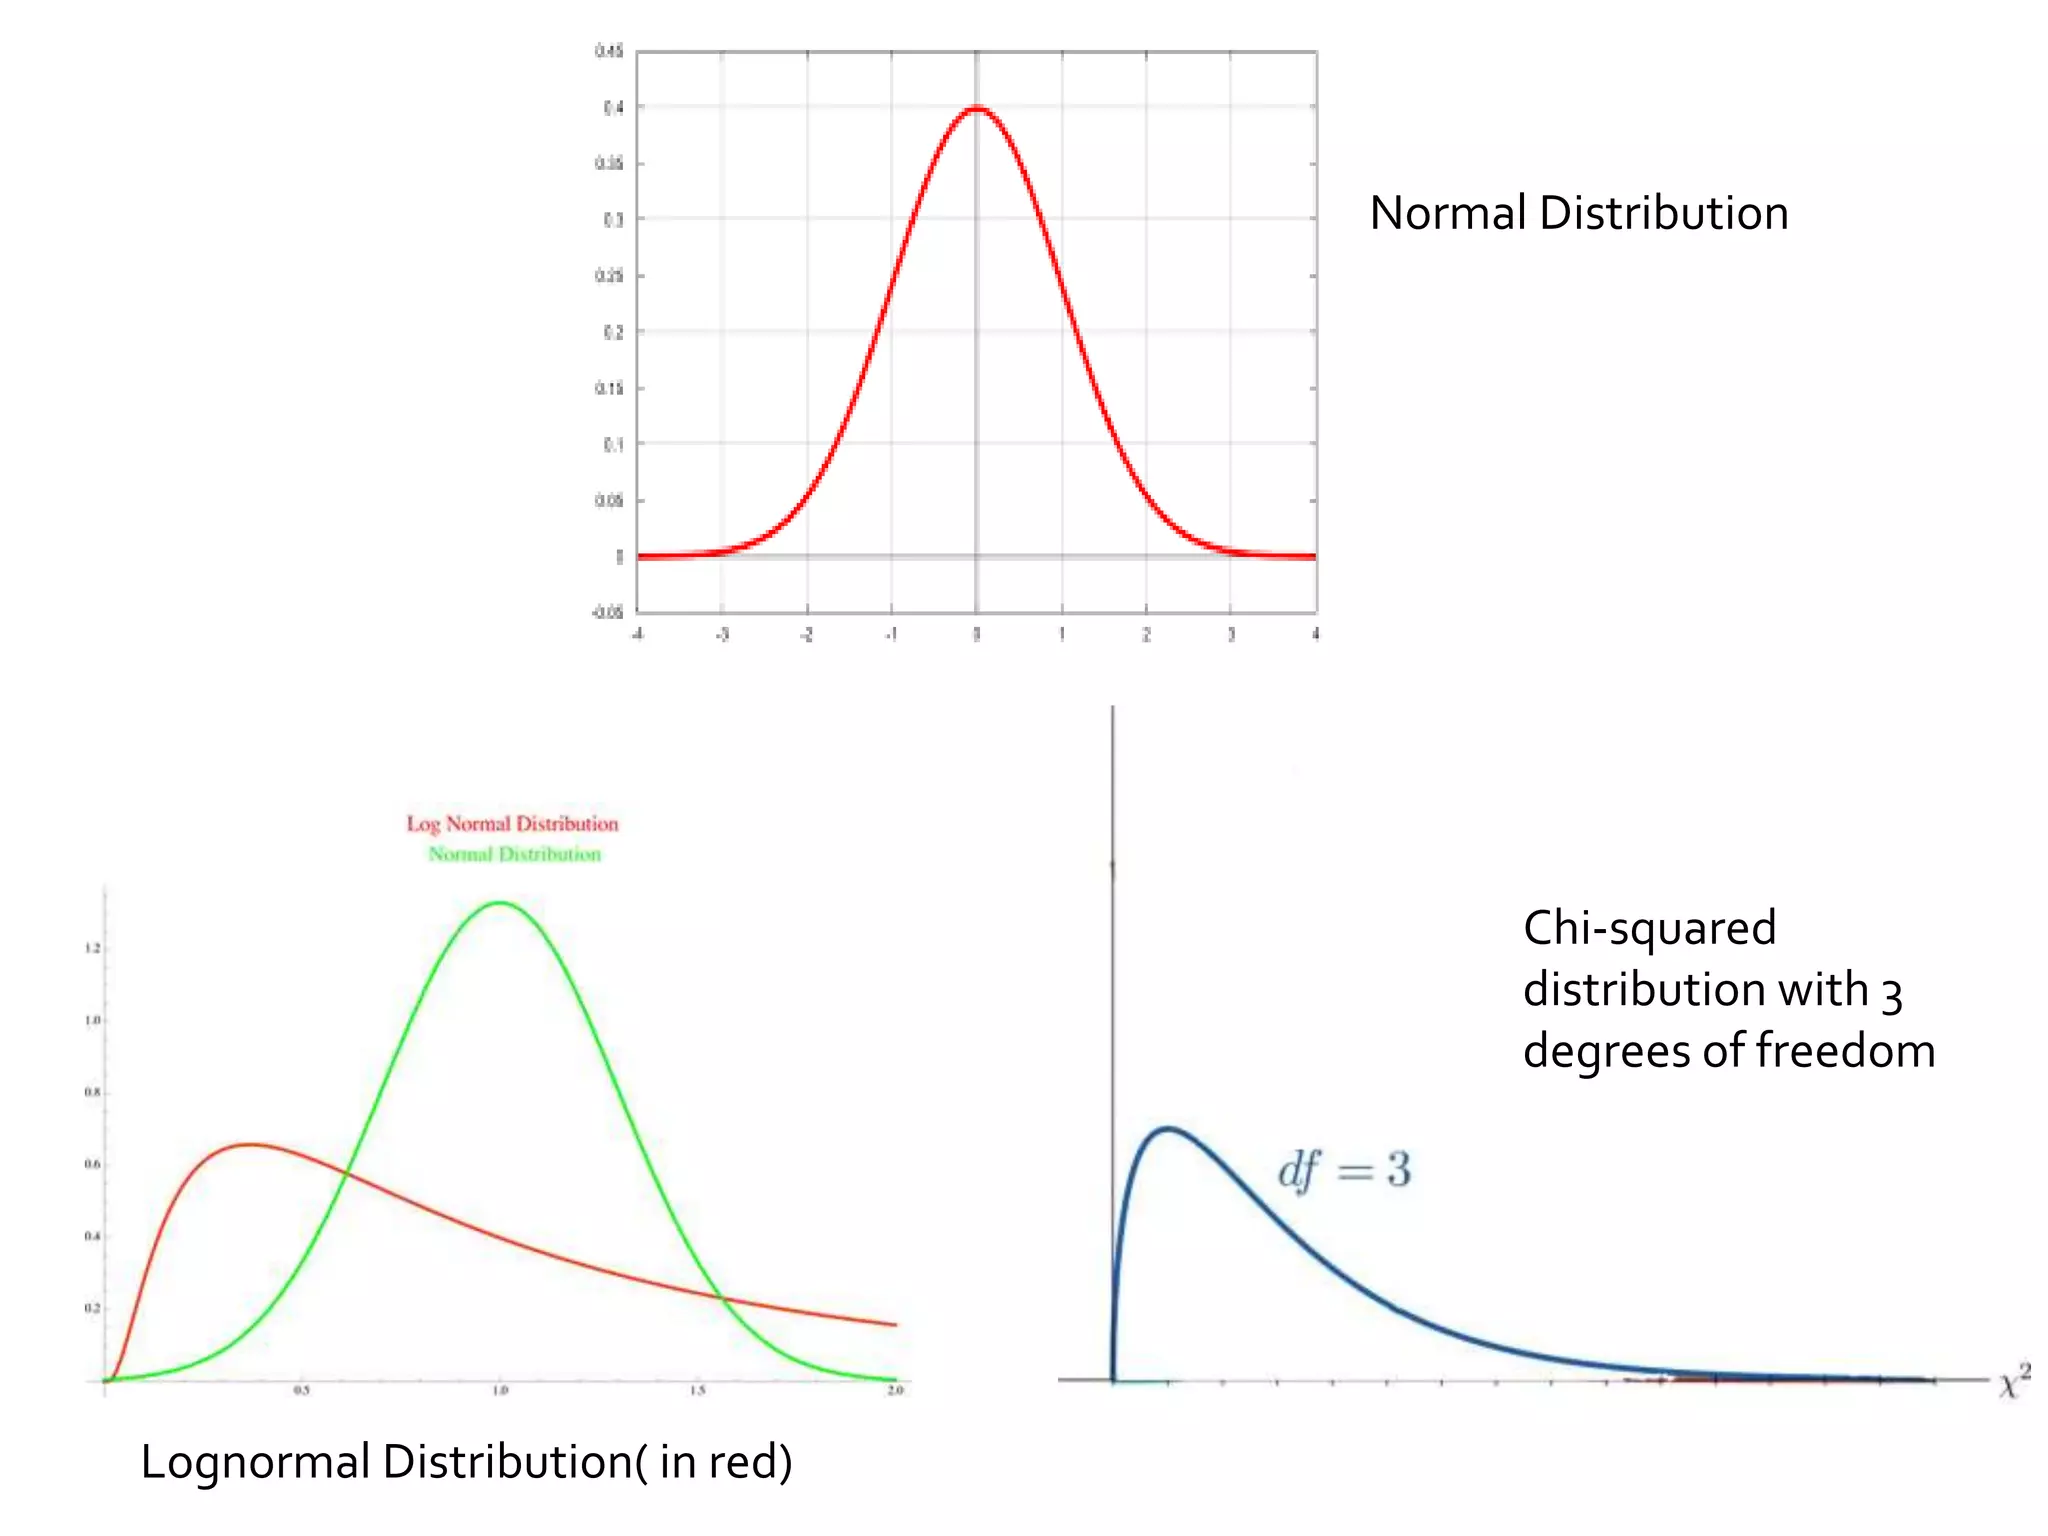
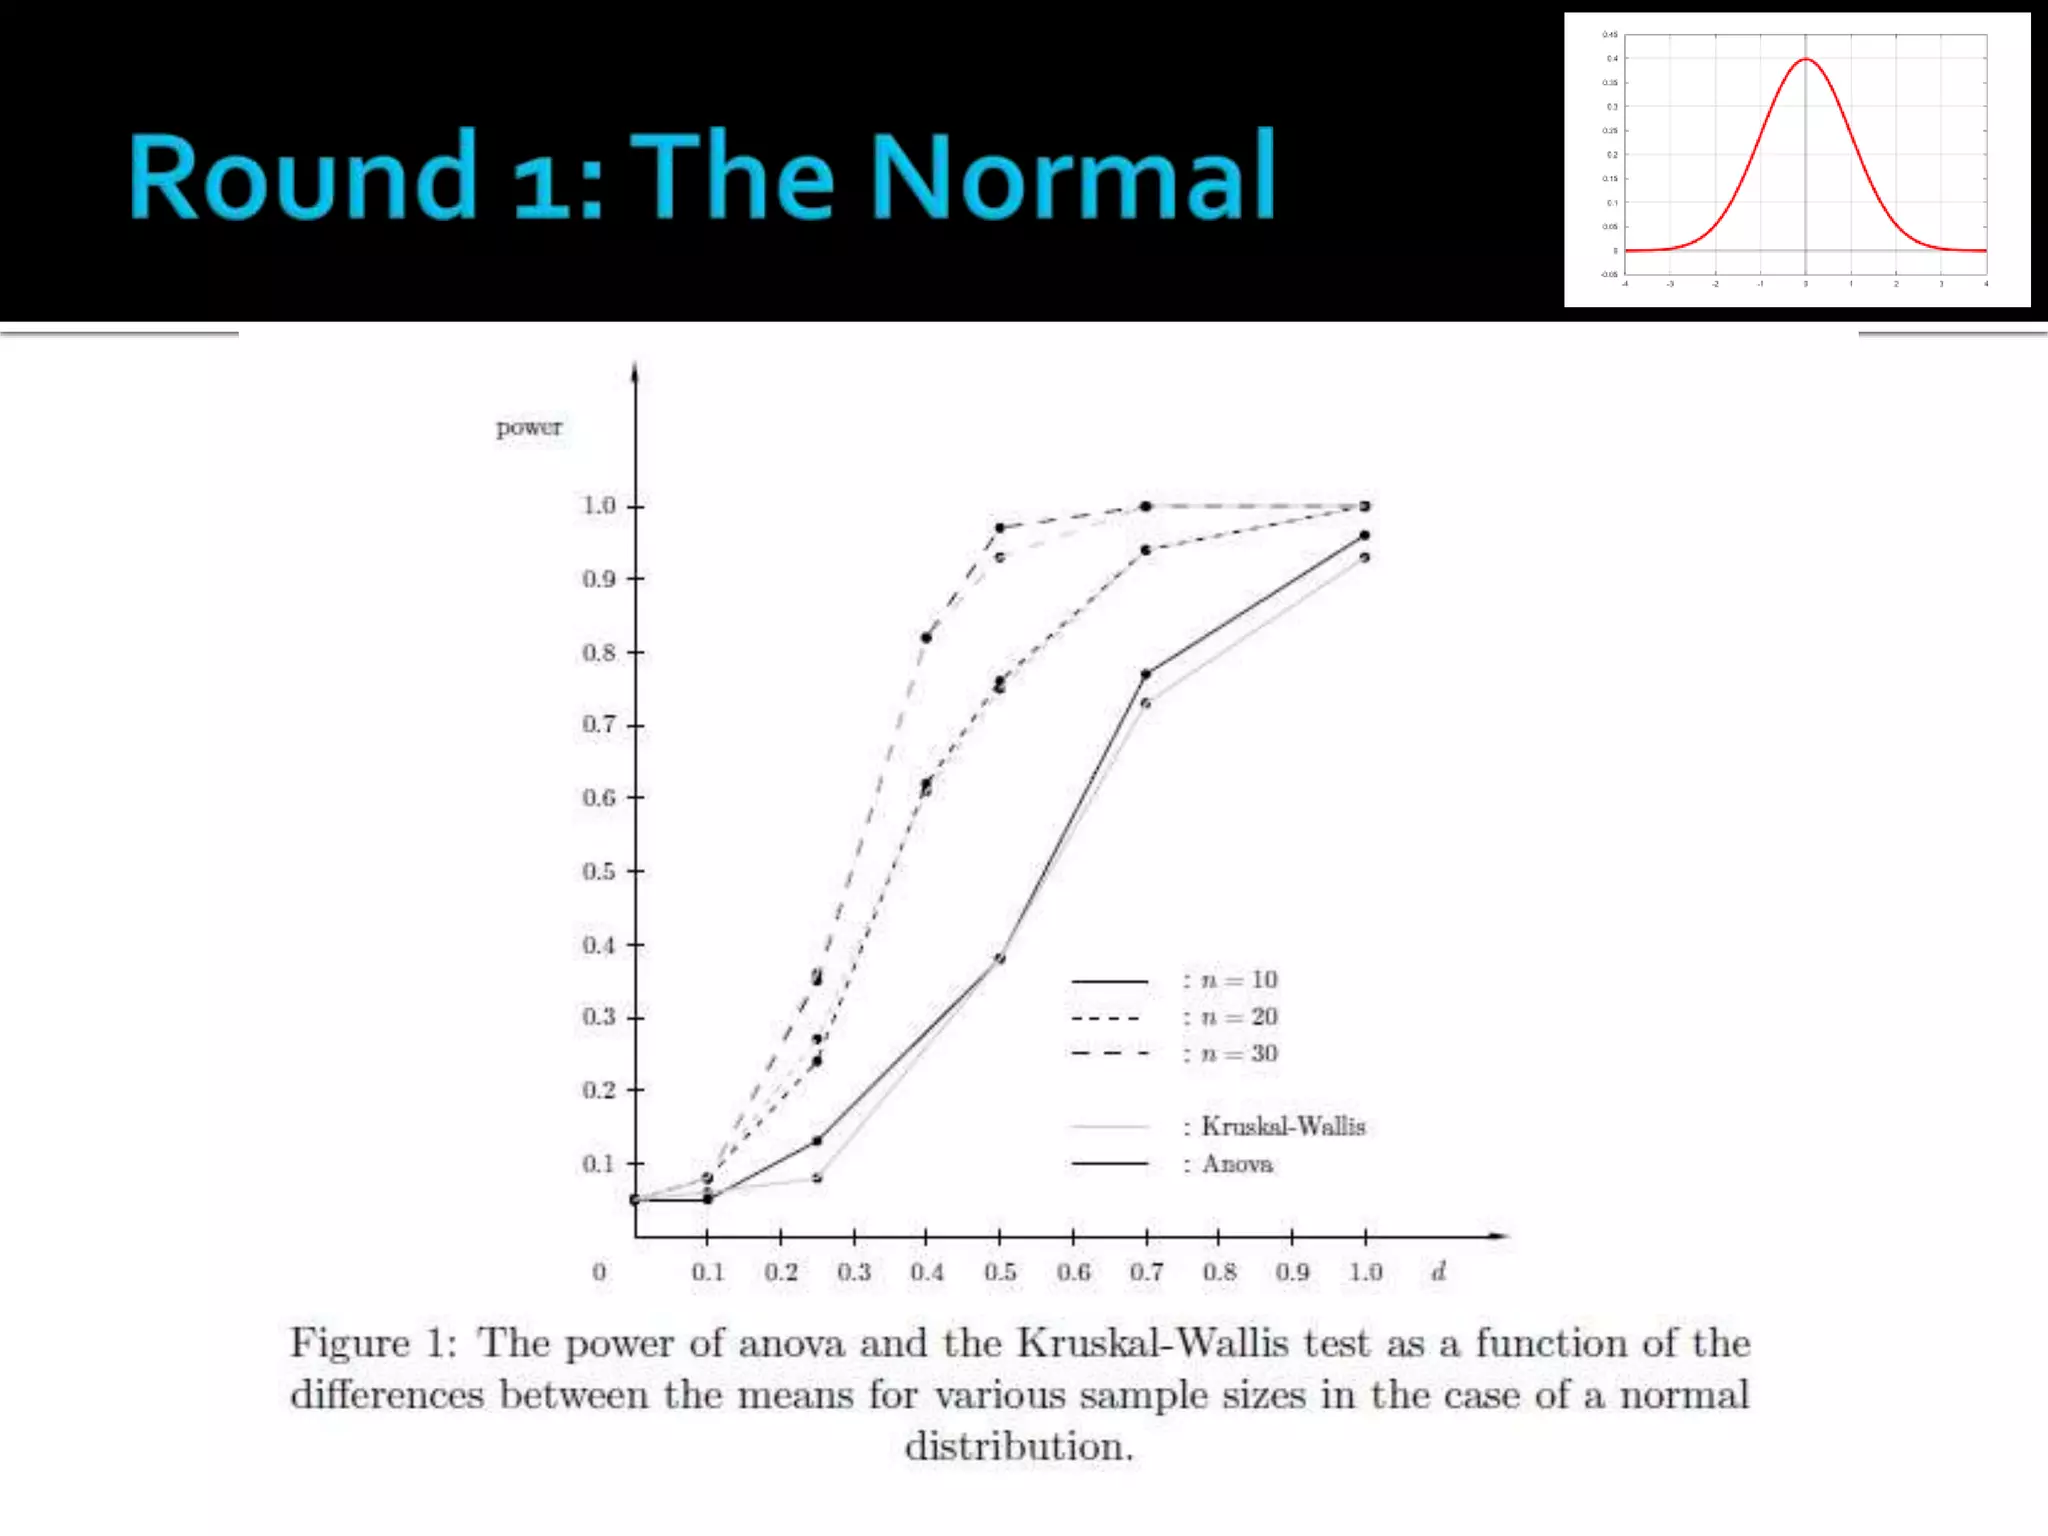
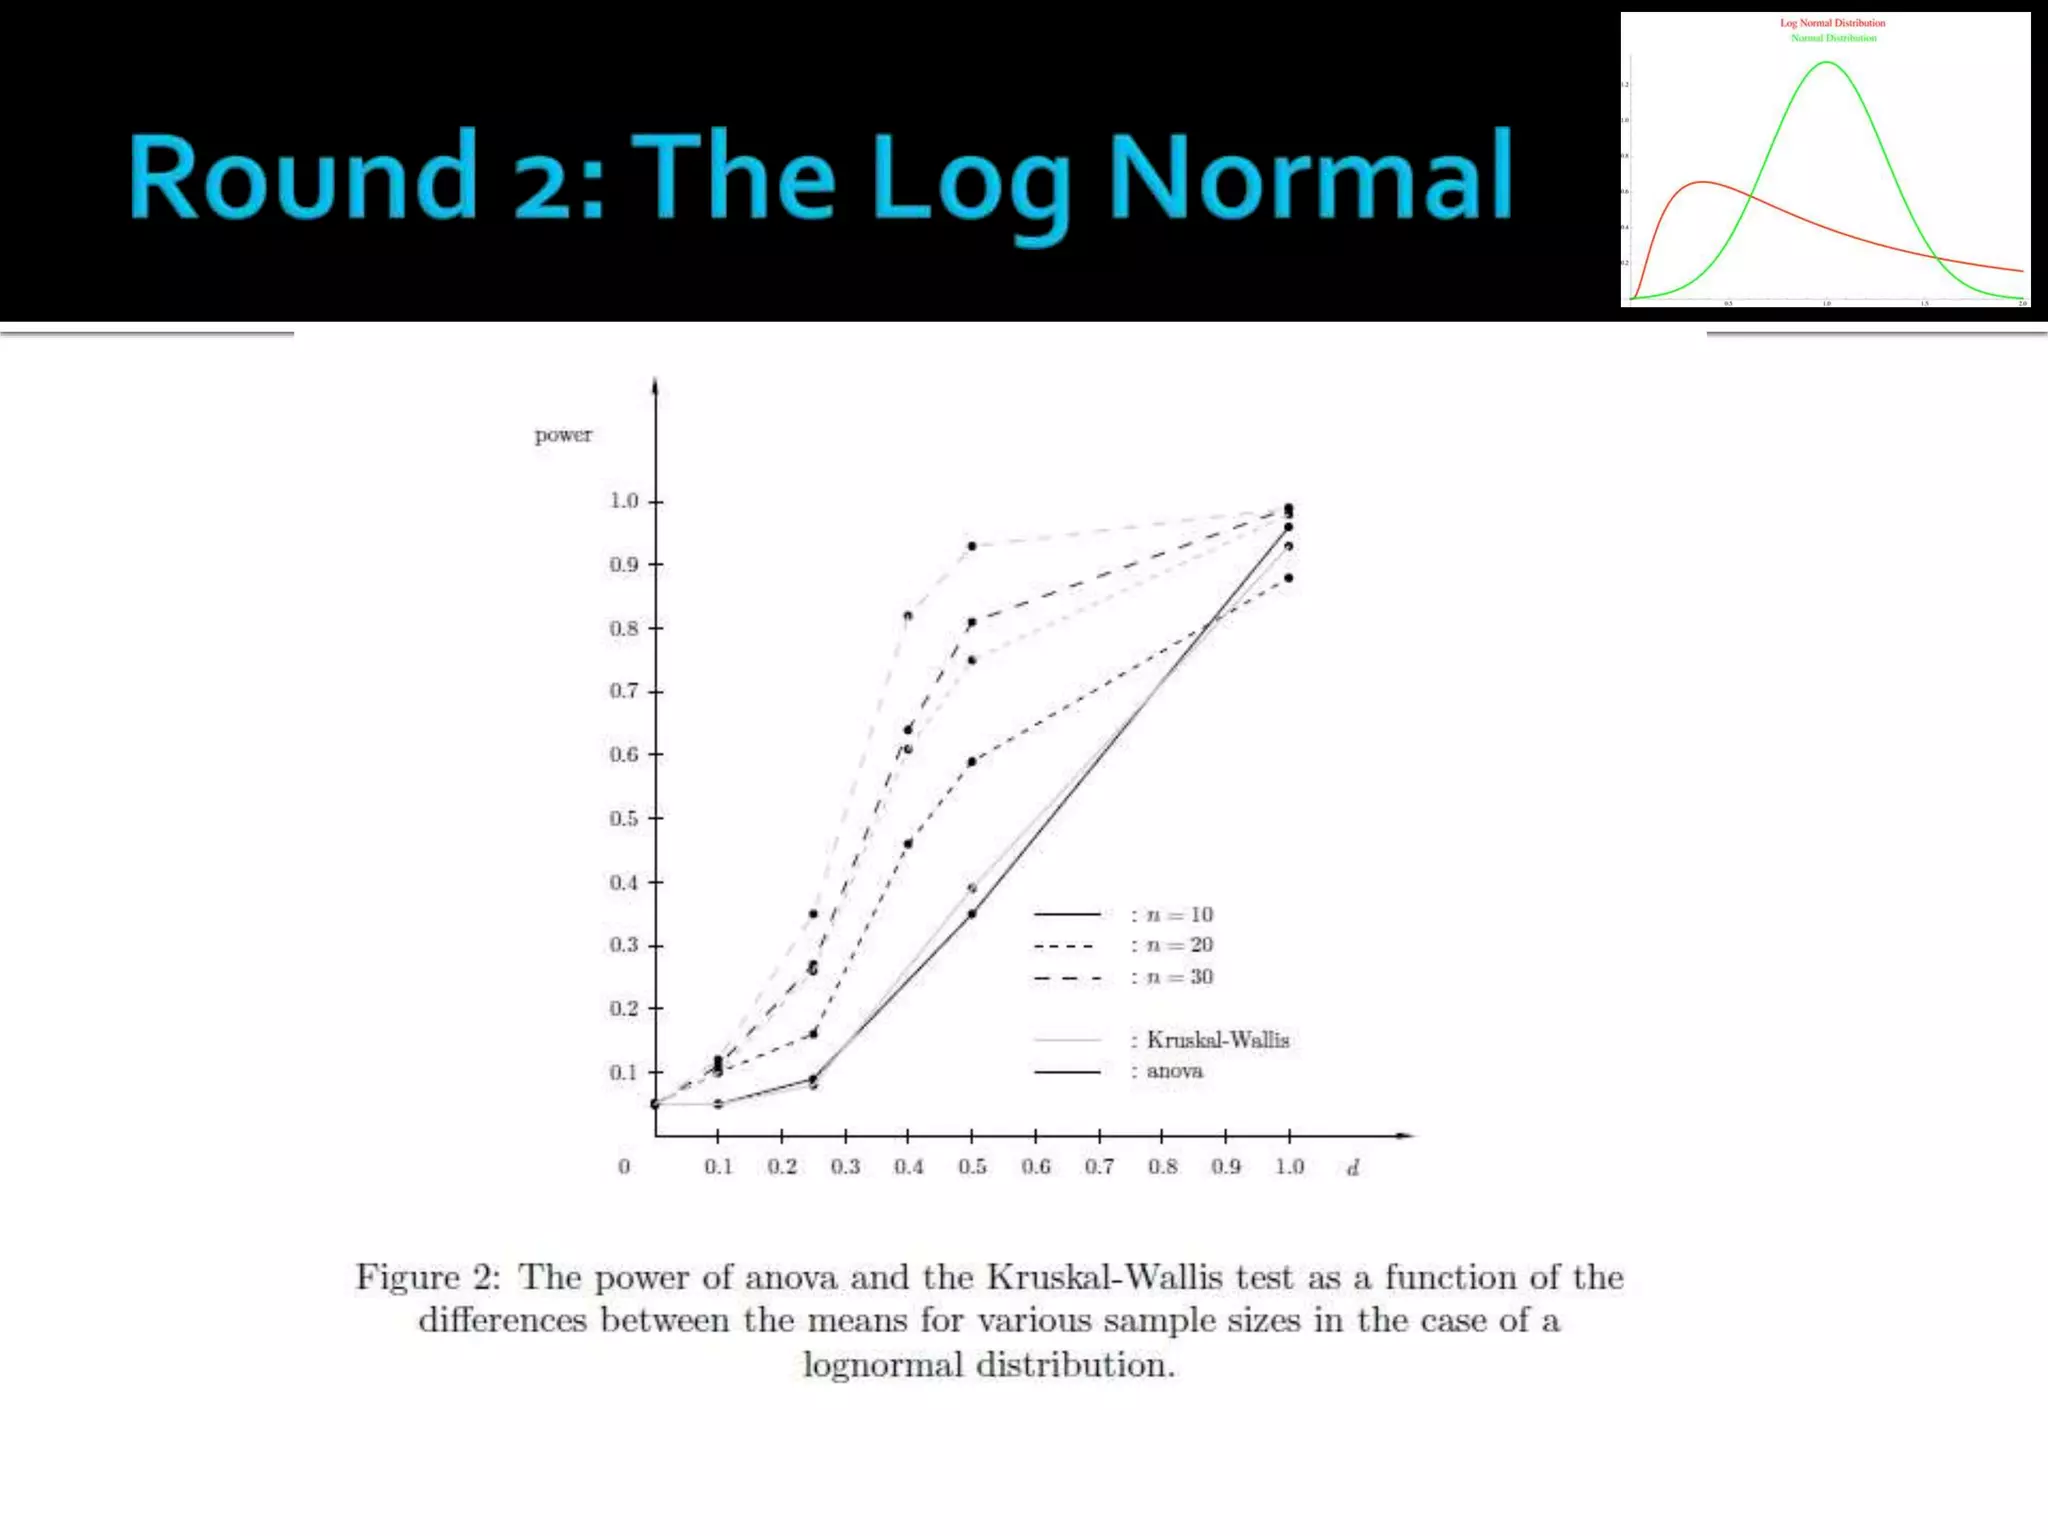
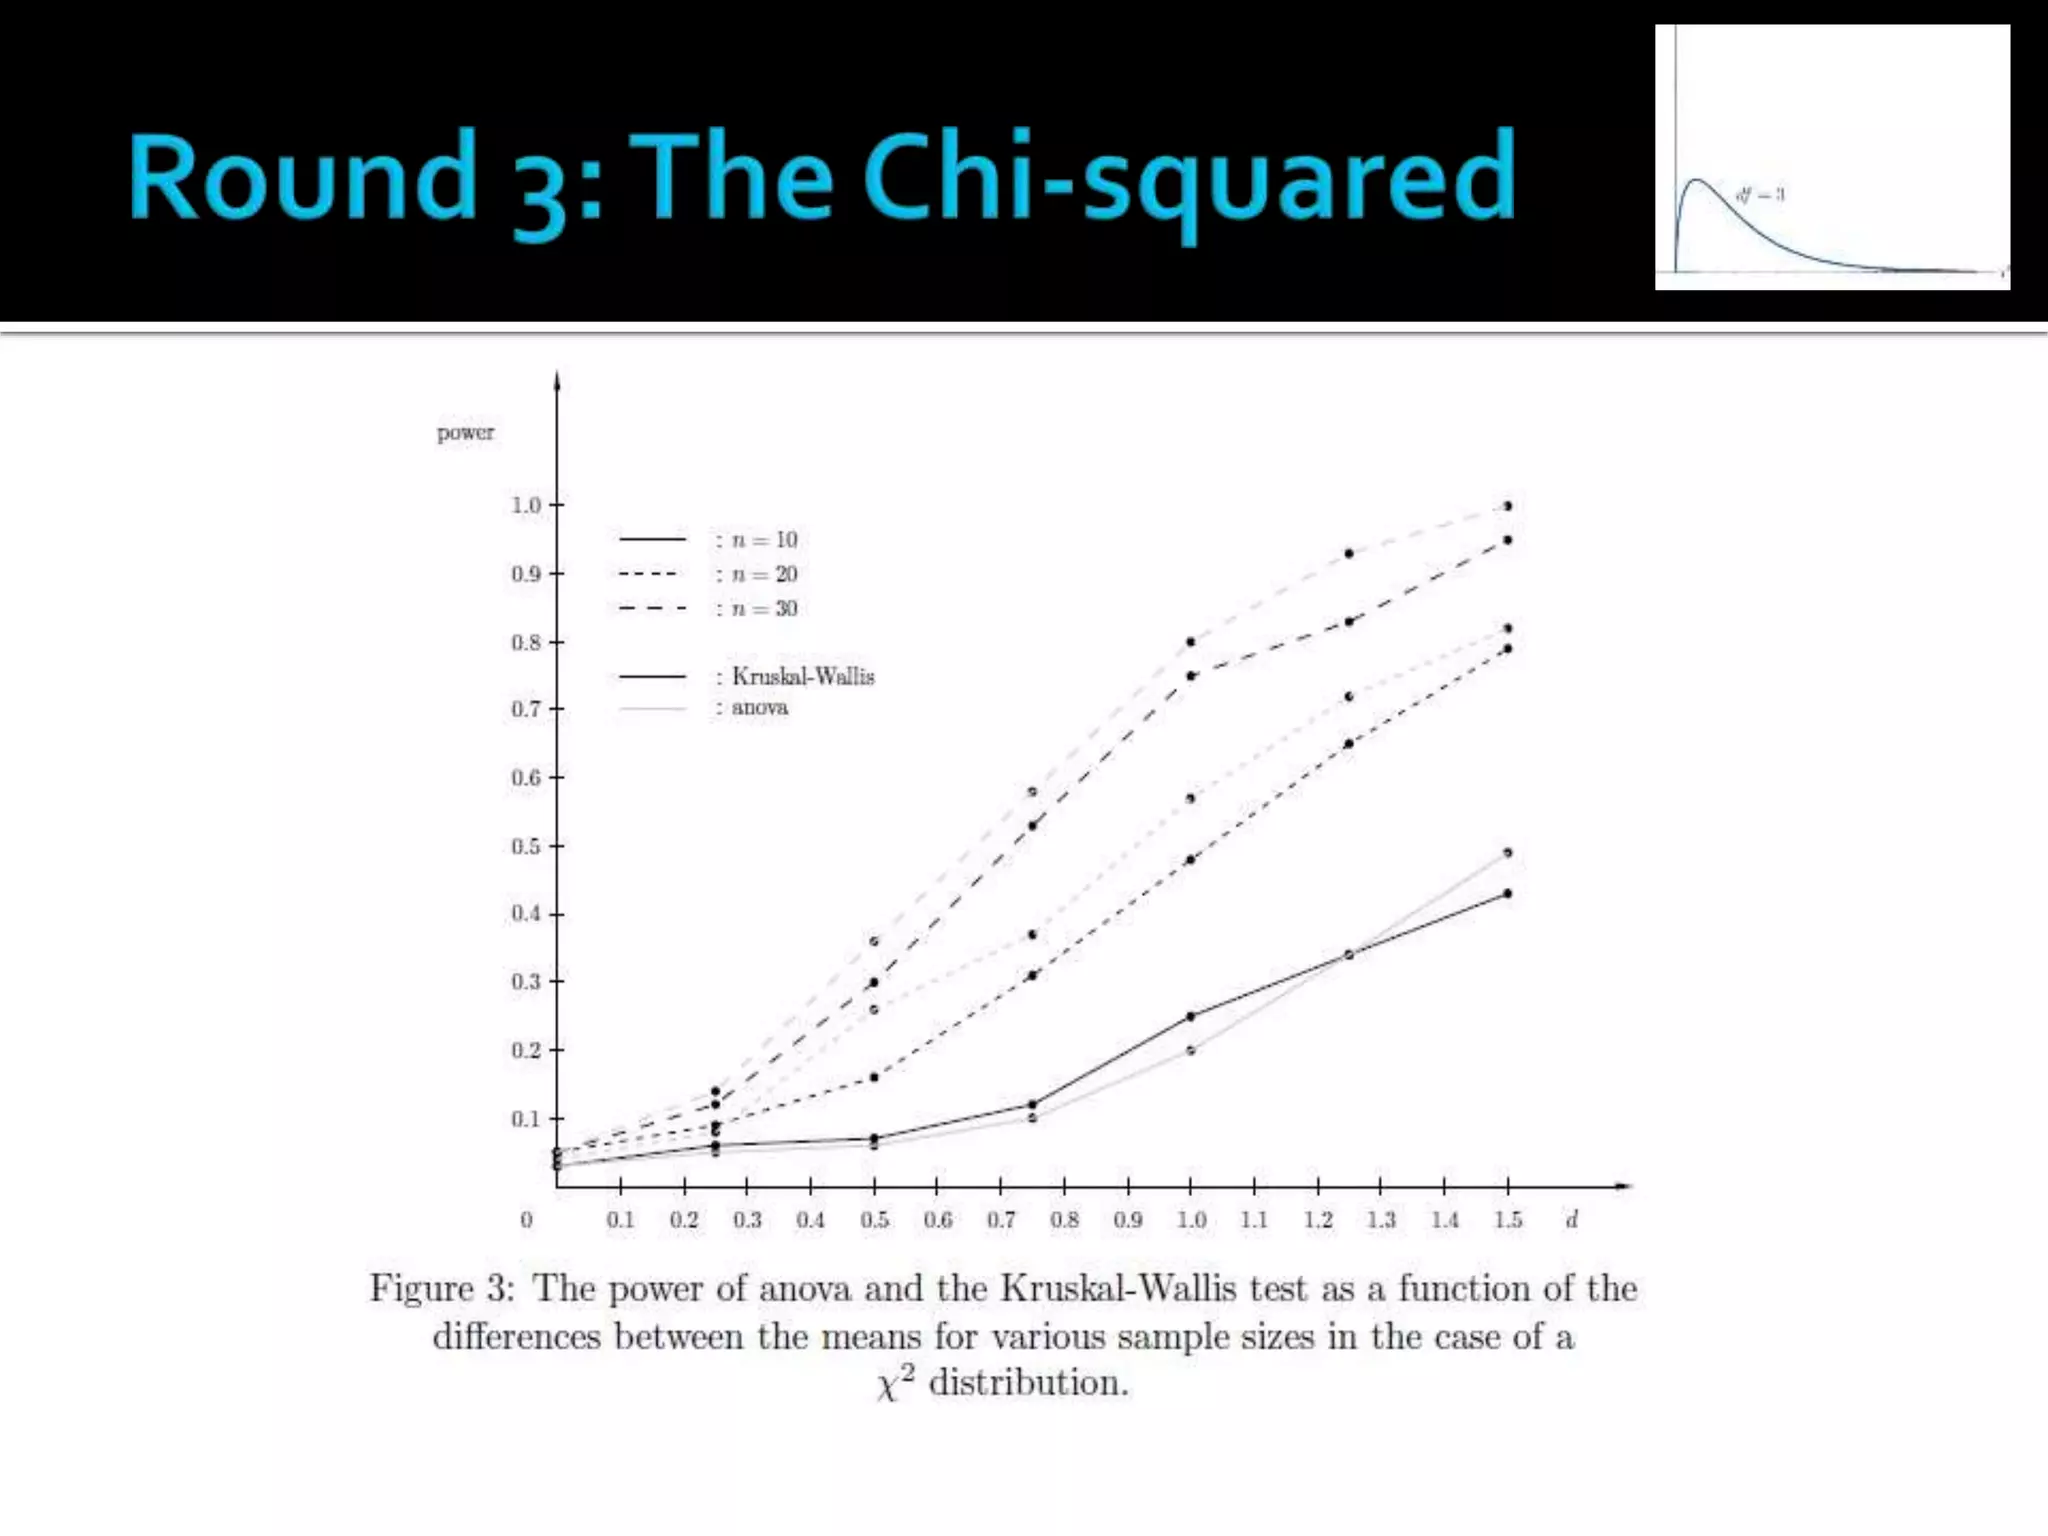
“Monday Journal Activity”
A Parametric test A Non-parametric test 
“Many-sample location parameter tests” bout
TanjaVan Hecke 
Faculty of Applied Engineering Sciences, 
Ghent University, 
Ghent ,Belgium 
Tanja.VanHecke@hogent.be 
Presented by: 
Mr. Benito Jr. B. Cuanan 
Scientific Publishing and Statistics Department 
Strategic Center for Diabetes Research 
King Saud University
Suppose levels of Patotine (a non-existing hormone) of 
different groups are being investigated. 
Suppose the groups are: “the underweight 
group” , “the normal group” and “the 
overweight group”. Once data are collected, 
how should this three groups be compared?
-----The most common approach would be to 
compare the mean or median levels of the 
different groups. 
But how? 
Take note: 
It would be very awkward if in your 
research paper, you present your data 
like this: 
“ … figures in table 1.1 are the Tukey’s 
Biweight m-estimator…”
•Consider the table on the right. 
•If we are to compare the 3 groups, what 
test statistics should we use? 
Looking at the type of data ( in this case: 
continuous) and the number of groups to be 
compared( in this case: 3 groups), our 
“textbook” will surely suggest: … 
USE: one-way ANOVA
Are you sure 
about that? 
Have you checked 
the normality? 
How about its 
scedasticity?
This paper described the comparison of the 
ANOVA and the Kruskal-Wallis test by means 
of the power when violating the assumption 
about normally distributed populations. The 
permutation method is used as a simulation 
method to determine the power of the test. It 
appears that in the case of asymmetric 
populations, the non-parametric Kruskal-Wallis 
test performs better than the parametric 
equivalent ANOVA method.
 A parametric test 
 The most commonly used test for location. 
 Used to analyze the differences between group means and 
their associated procedures. 
 It models the data as: 
yij= μi + εij , 
μi is the mean or expected response of data in 
the i-th treatment. 
εij are independent, identically 
distributed normal random errors.
The one-way ANOVA is used to test the 
equality of k (k > 2) population 
means, so the null hypothesis is: 
H0 : μ1 = μ2 = . . . = μk. 
Assumptions: 
1. The dependent variable is 
normally distributed in each group 
that is being compared. 
2. There is homogeneity of 
variances. This means that the 
population variances in each group 
are equal. 
What if the 
assumptions are 
violated? 
one-way ANOVA may yield 
inaccurate estimates of the p-value 
when the data are not 
normally distributed at all. 
If the sample sizes are equal 
or nearly equal, ANOVA is very 
robust. If not, then the true p-value 
is greater than the 
computed p-value.
This paper focused on the violation of the 
first(in our list) assumption of ANOVA, 
that is: violation on NORMALITY of each 
group’s distribution.
 A Non-parametric test 
 The “analogue” of ANOVA in testing for location. 
 Used to compare the medians of 3 or more independent 
groups. 
 It models the data as: 
yij = ηi + φij , 
ηi is the median response of data in the i-th 
treatment. 
φij are independent, identically 
distributed continuous random errors
 Unlike the ANOVA, this test does not make assumptions 
about normality. However, it assumes that each group have 
approximately the same shape. 
 Like most non-parametric tests, it is performed on the ranks 
of the measurement observations. 
 The null hypothesis of the Kruskal-Wallis test states that the 
samples are from identical populations. 
 When rejecting the null hypothesis of the Kruskal-Wallis test, 
then at least one of sample stochastically dominates at least 
one other sample.
POWER: 
 Statistical power is defined as the probability that the test 
correctly rejects the null hypothesis when the null hypothesis 
is false. 
 It is the “sensitivity” of the test. 
 In this paper, empirical power were calculated.
PERMUTATION TEST: 
The steps for a multiple-treatment permutation test: 
• Compute the F-value of the given samples, called Fobs. 
• Re-arrange the k n observations in k samples of size n. 
• For each permutation of the data, compare the F-value with the Fobs 
For the upper tailed test, compute the p-value as 
p =#(F >Fobs)/ntot 
If the p-value is less than or equal to the predetermined level of 
significance α, then we reject H0. 
 if we have 3 groups with 20 observations each, there are (60!)(20!)-3 
possible different permutations of those observations into three 
groups. 
 That’s equivalent to 577,831,814,478,475,823,831,865,900
The Monte Carlo simulation was used. 
 random data from a specified distribution with given 
parameters were generated. 
 ANOVA and Kruskal-Wallis test were then conducted. 
 2500 samples from chosen distributions were tested 
at α = 0.05.
 The following hypotheses were considered: 
Ho : μ1 = μ2 = μ3 
and 
H1 : μ1 + d = μ2 and μ1 + 2d = μ3 
Ex. @d=0.3: 
if μ1 = 1 , then μ2 =1.3 and μ3 =1.6 
 The two tests were compared in 3 distribution types, 
namely: Normal, Lognormal, and Chi-squared 
distribution.
Normal Distribution 
Chi-squared 
distribution with 3 
degrees of freedom 
Lognormal Distribution( in red)
 For non-symmetrical distributions, the non-parametrical 
Kruskal-Wallis test results in a higher 
power compared to the classical one-way anova. 
 The results of the simulations show that an 
analysis of the data is needed before a test on 
differences in central tendencies is conducted. 
 Although the literature and textbooks state that 
the F-test is robust under the violations of 
assumptions, these results show that the power 
suffers a significant decrease.

Power study: 1-way anova vs kruskall wallis

  • 1.
  • 2.
    A Parametric testA Non-parametric test “Many-sample location parameter tests” bout
  • 3.
    TanjaVan Hecke Facultyof Applied Engineering Sciences, Ghent University, Ghent ,Belgium Tanja.VanHecke@hogent.be Presented by: Mr. Benito Jr. B. Cuanan Scientific Publishing and Statistics Department Strategic Center for Diabetes Research King Saud University
  • 4.
    Suppose levels ofPatotine (a non-existing hormone) of different groups are being investigated. Suppose the groups are: “the underweight group” , “the normal group” and “the overweight group”. Once data are collected, how should this three groups be compared?
  • 5.
    -----The most commonapproach would be to compare the mean or median levels of the different groups. But how? Take note: It would be very awkward if in your research paper, you present your data like this: “ … figures in table 1.1 are the Tukey’s Biweight m-estimator…”
  • 6.
    •Consider the tableon the right. •If we are to compare the 3 groups, what test statistics should we use? Looking at the type of data ( in this case: continuous) and the number of groups to be compared( in this case: 3 groups), our “textbook” will surely suggest: … USE: one-way ANOVA
  • 7.
    Are you sure about that? Have you checked the normality? How about its scedasticity?
  • 8.
    This paper describedthe comparison of the ANOVA and the Kruskal-Wallis test by means of the power when violating the assumption about normally distributed populations. The permutation method is used as a simulation method to determine the power of the test. It appears that in the case of asymmetric populations, the non-parametric Kruskal-Wallis test performs better than the parametric equivalent ANOVA method.
  • 9.
     A parametrictest  The most commonly used test for location.  Used to analyze the differences between group means and their associated procedures.  It models the data as: yij= μi + εij , μi is the mean or expected response of data in the i-th treatment. εij are independent, identically distributed normal random errors.
  • 10.
    The one-way ANOVAis used to test the equality of k (k > 2) population means, so the null hypothesis is: H0 : μ1 = μ2 = . . . = μk. Assumptions: 1. The dependent variable is normally distributed in each group that is being compared. 2. There is homogeneity of variances. This means that the population variances in each group are equal. What if the assumptions are violated? one-way ANOVA may yield inaccurate estimates of the p-value when the data are not normally distributed at all. If the sample sizes are equal or nearly equal, ANOVA is very robust. If not, then the true p-value is greater than the computed p-value.
  • 11.
    This paper focusedon the violation of the first(in our list) assumption of ANOVA, that is: violation on NORMALITY of each group’s distribution.
  • 12.
     A Non-parametrictest  The “analogue” of ANOVA in testing for location.  Used to compare the medians of 3 or more independent groups.  It models the data as: yij = ηi + φij , ηi is the median response of data in the i-th treatment. φij are independent, identically distributed continuous random errors
  • 13.
     Unlike theANOVA, this test does not make assumptions about normality. However, it assumes that each group have approximately the same shape.  Like most non-parametric tests, it is performed on the ranks of the measurement observations.  The null hypothesis of the Kruskal-Wallis test states that the samples are from identical populations.  When rejecting the null hypothesis of the Kruskal-Wallis test, then at least one of sample stochastically dominates at least one other sample.
  • 14.
    POWER:  Statisticalpower is defined as the probability that the test correctly rejects the null hypothesis when the null hypothesis is false.  It is the “sensitivity” of the test.  In this paper, empirical power were calculated.
  • 15.
    PERMUTATION TEST: Thesteps for a multiple-treatment permutation test: • Compute the F-value of the given samples, called Fobs. • Re-arrange the k n observations in k samples of size n. • For each permutation of the data, compare the F-value with the Fobs For the upper tailed test, compute the p-value as p =#(F >Fobs)/ntot If the p-value is less than or equal to the predetermined level of significance α, then we reject H0.  if we have 3 groups with 20 observations each, there are (60!)(20!)-3 possible different permutations of those observations into three groups.  That’s equivalent to 577,831,814,478,475,823,831,865,900
  • 16.
    The Monte Carlosimulation was used.  random data from a specified distribution with given parameters were generated.  ANOVA and Kruskal-Wallis test were then conducted.  2500 samples from chosen distributions were tested at α = 0.05.
  • 17.
     The followinghypotheses were considered: Ho : μ1 = μ2 = μ3 and H1 : μ1 + d = μ2 and μ1 + 2d = μ3 Ex. @d=0.3: if μ1 = 1 , then μ2 =1.3 and μ3 =1.6  The two tests were compared in 3 distribution types, namely: Normal, Lognormal, and Chi-squared distribution.
  • 18.
    Normal Distribution Chi-squared distribution with 3 degrees of freedom Lognormal Distribution( in red)
  • 22.
     For non-symmetricaldistributions, the non-parametrical Kruskal-Wallis test results in a higher power compared to the classical one-way anova.  The results of the simulations show that an analysis of the data is needed before a test on differences in central tendencies is conducted.  Although the literature and textbooks state that the F-test is robust under the violations of assumptions, these results show that the power suffers a significant decrease.

Editor's Notes

  • #5 Or generally speaking, compare the “location” of the different samples.
  • #7 Or generally speaking, compare the “location” of the different samples.
  • #8 Or generally speaking, compare the “location” of the different samples.