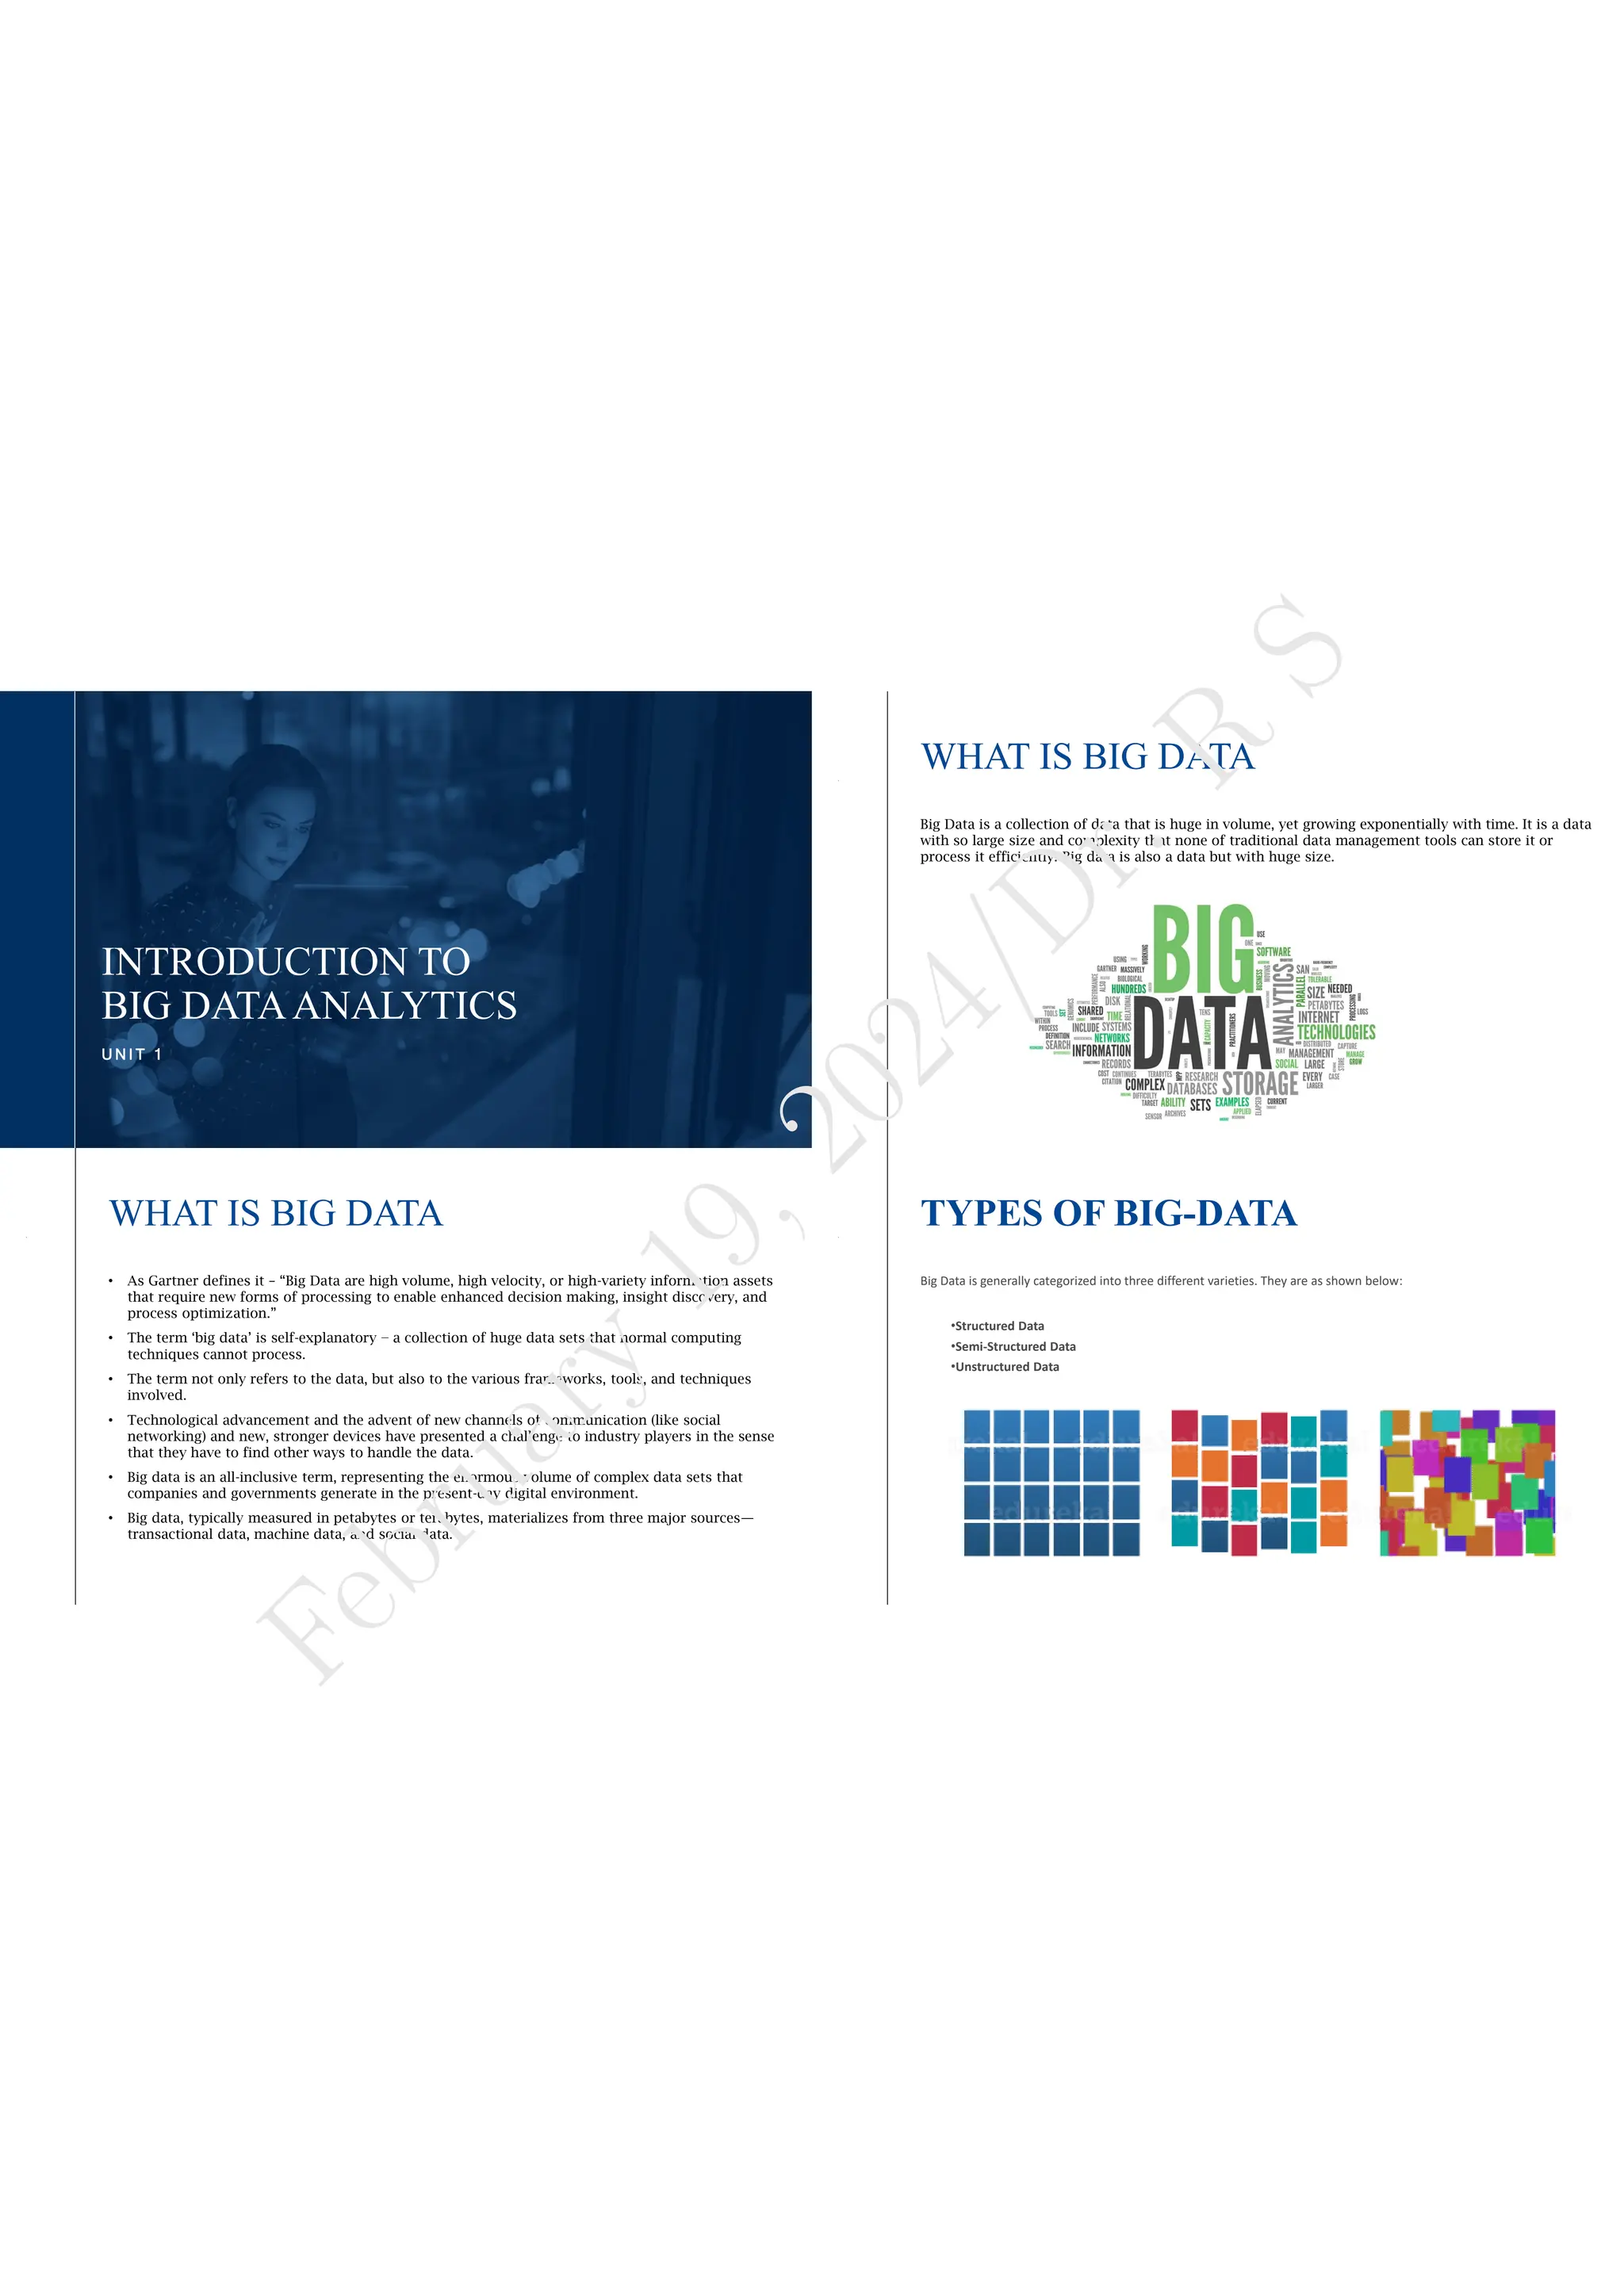
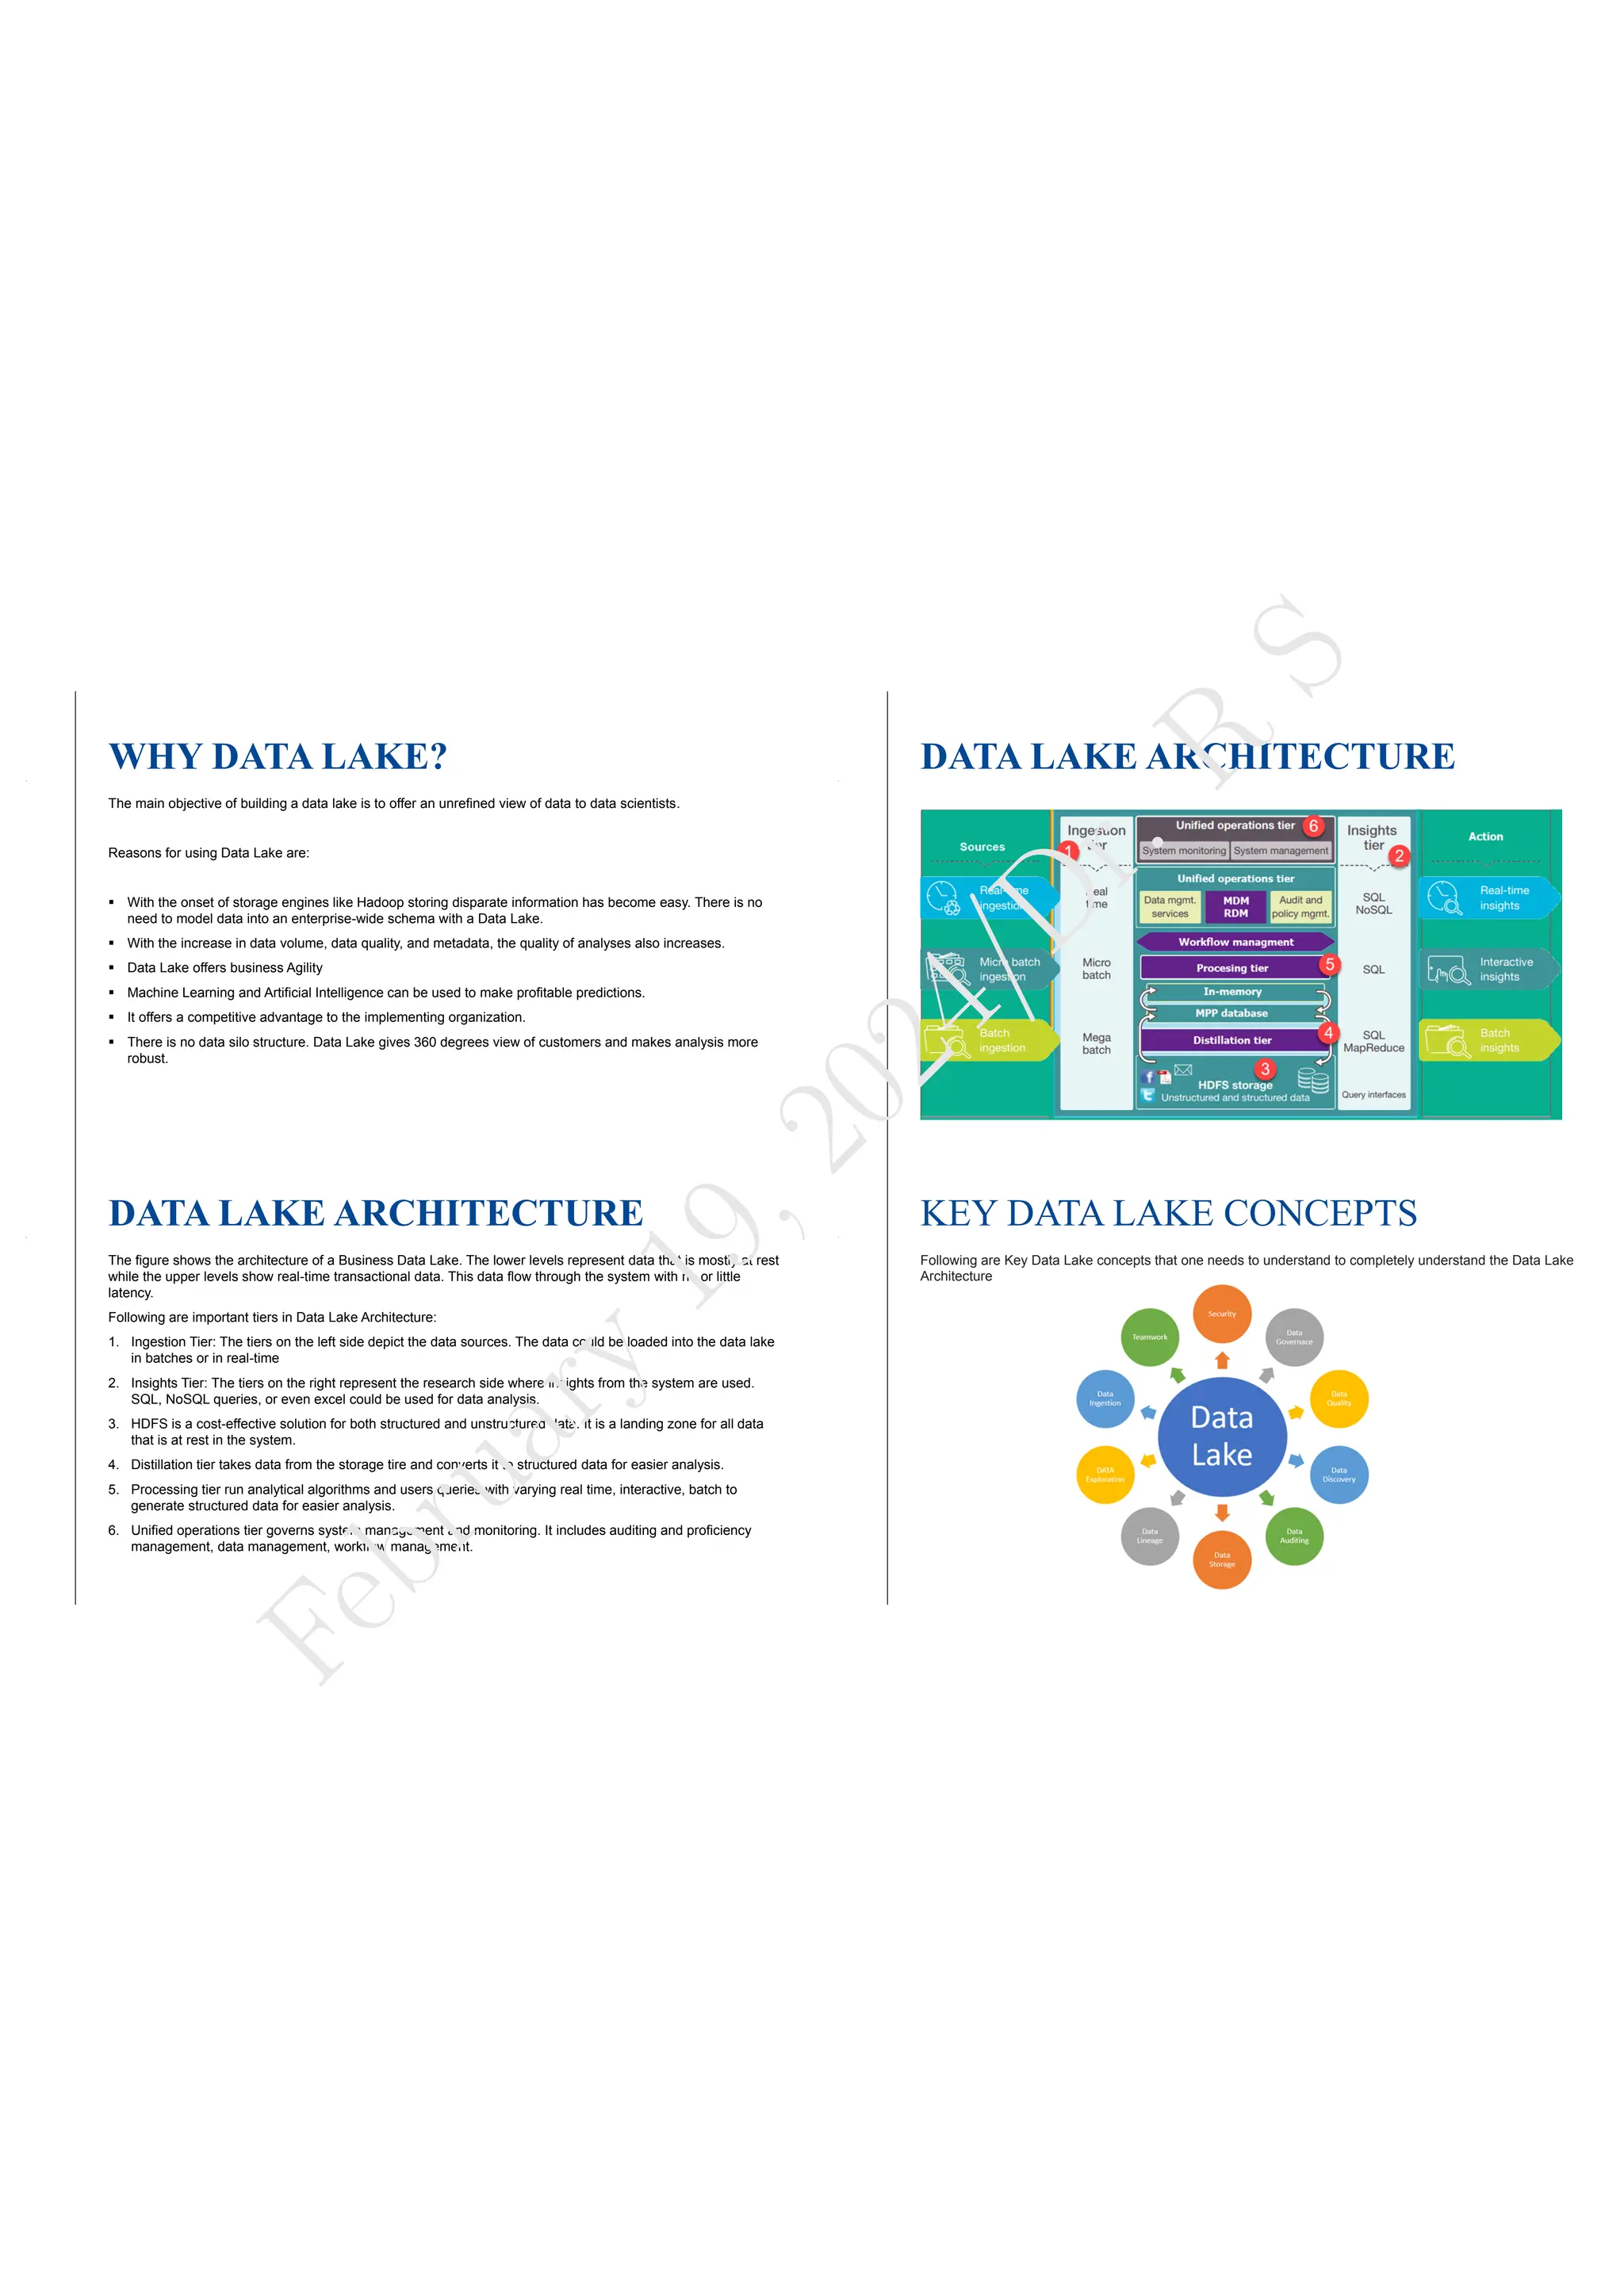
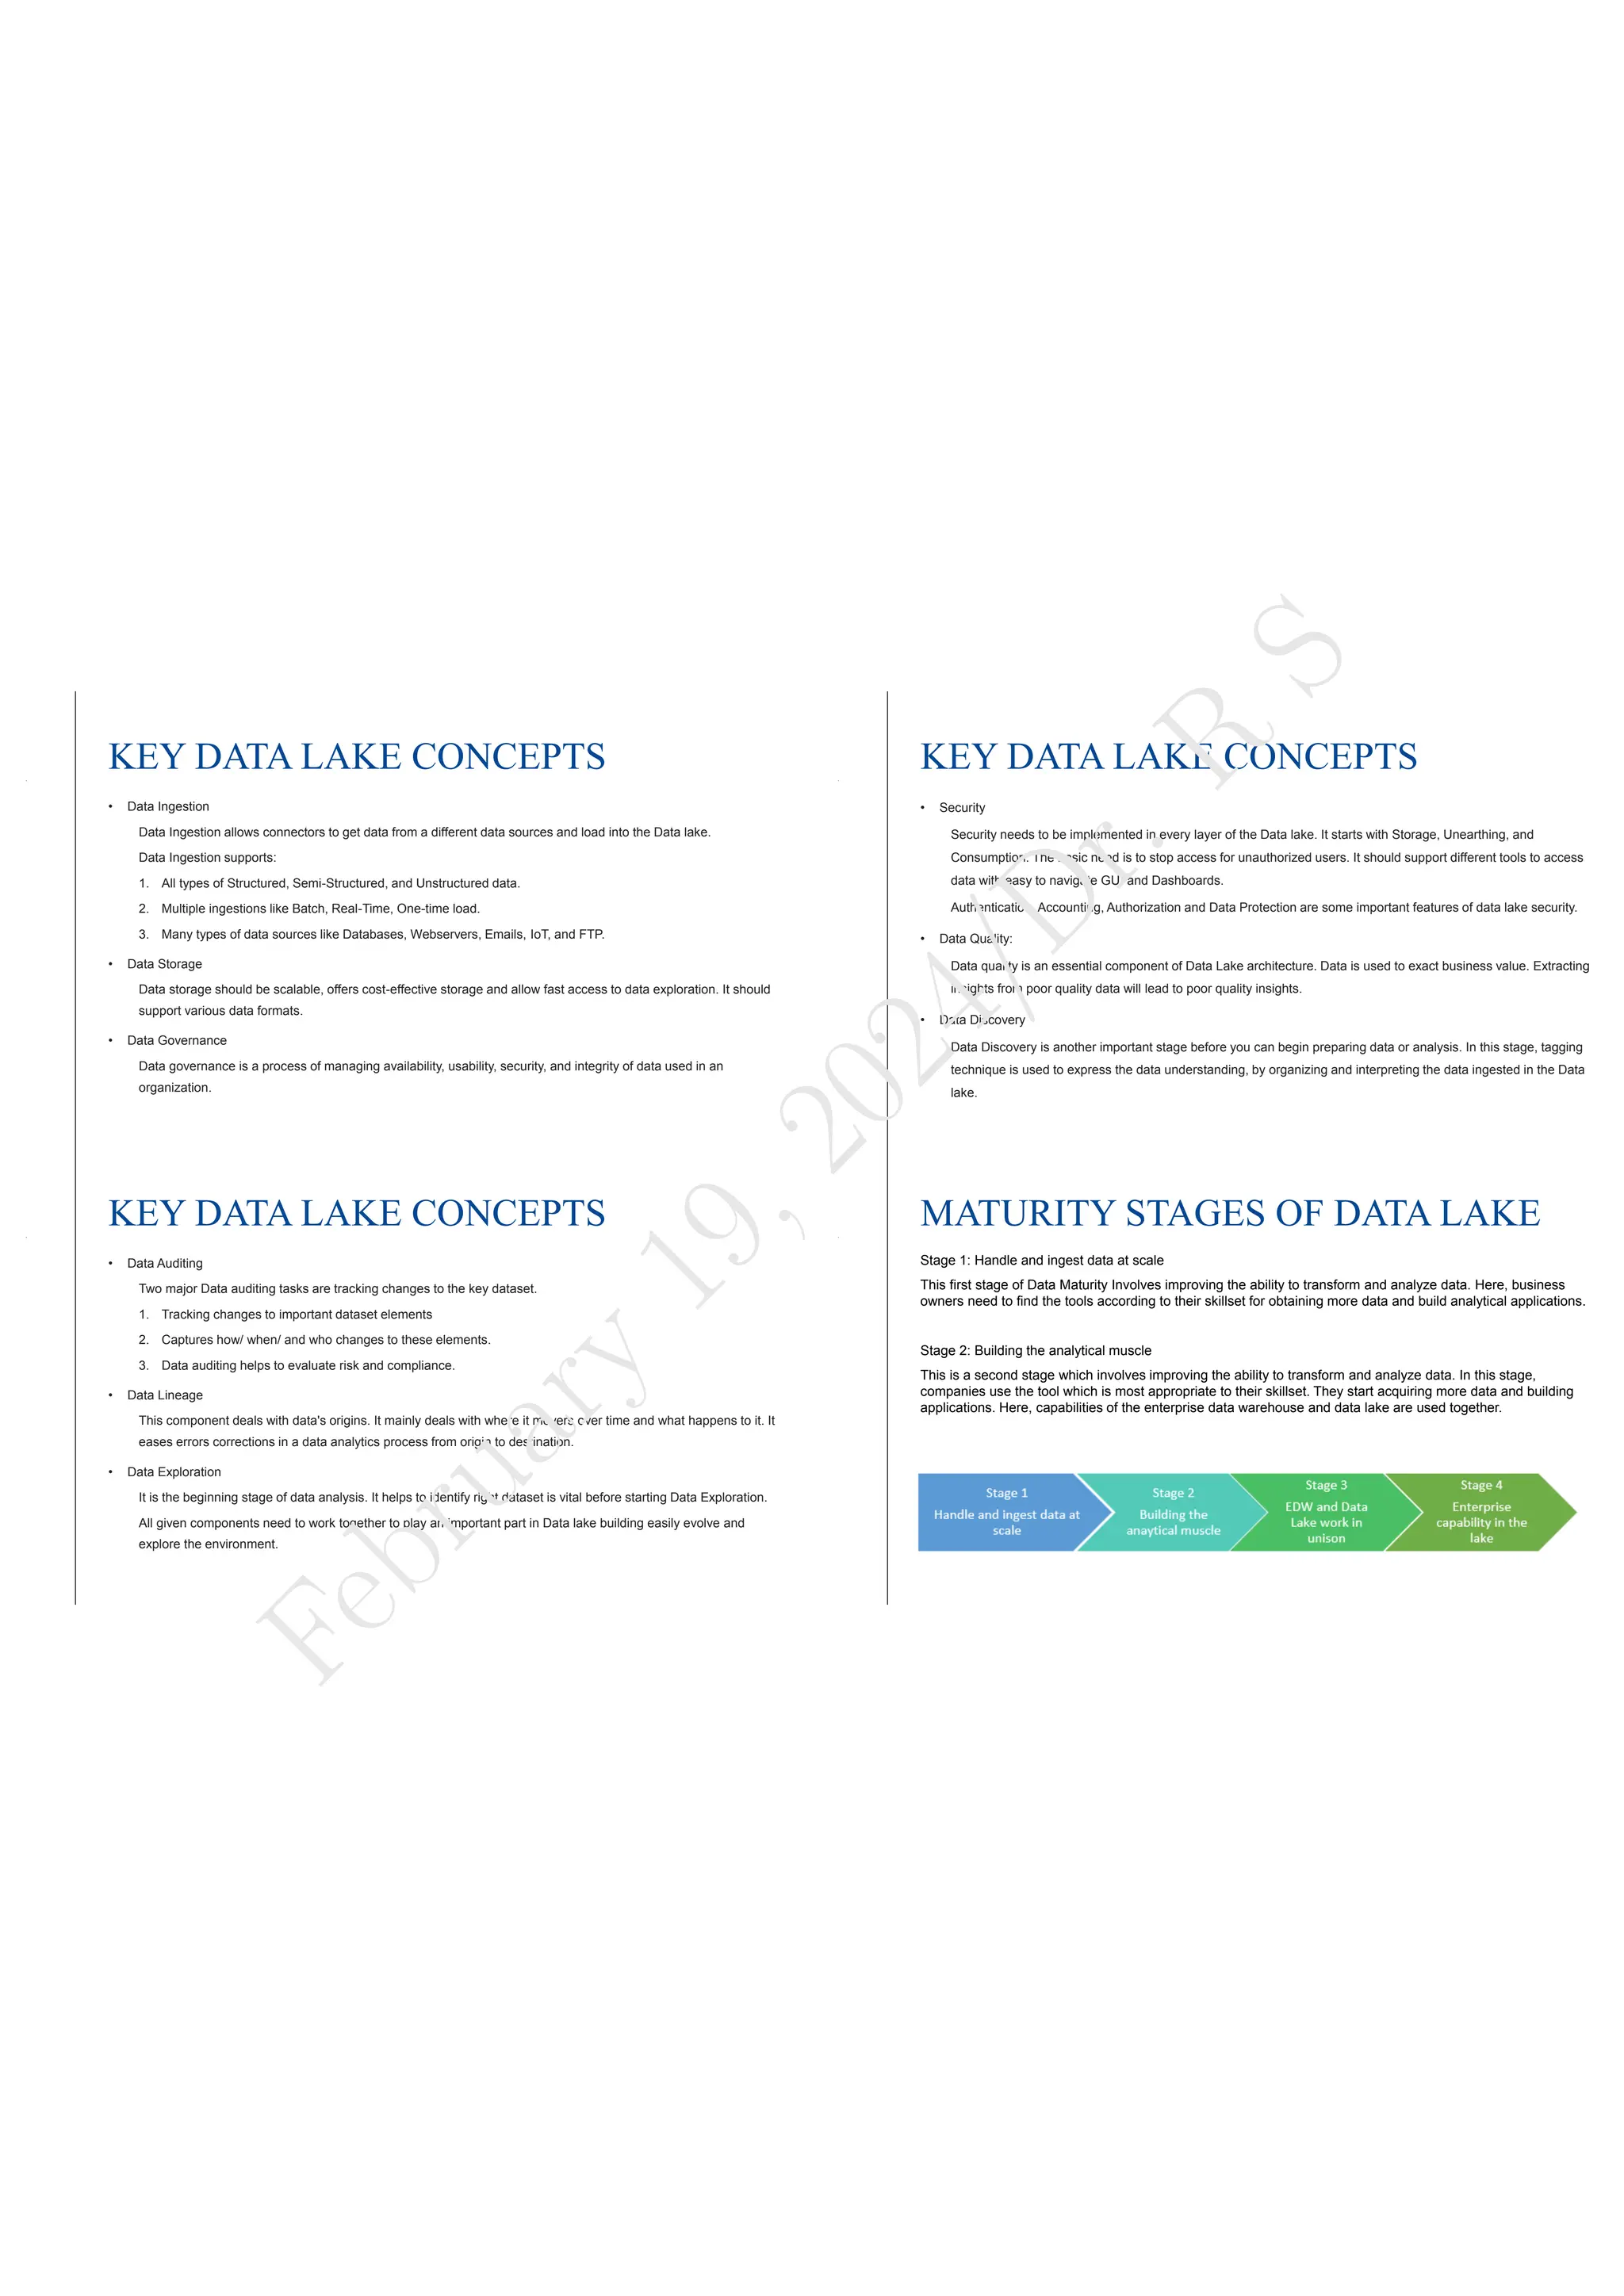
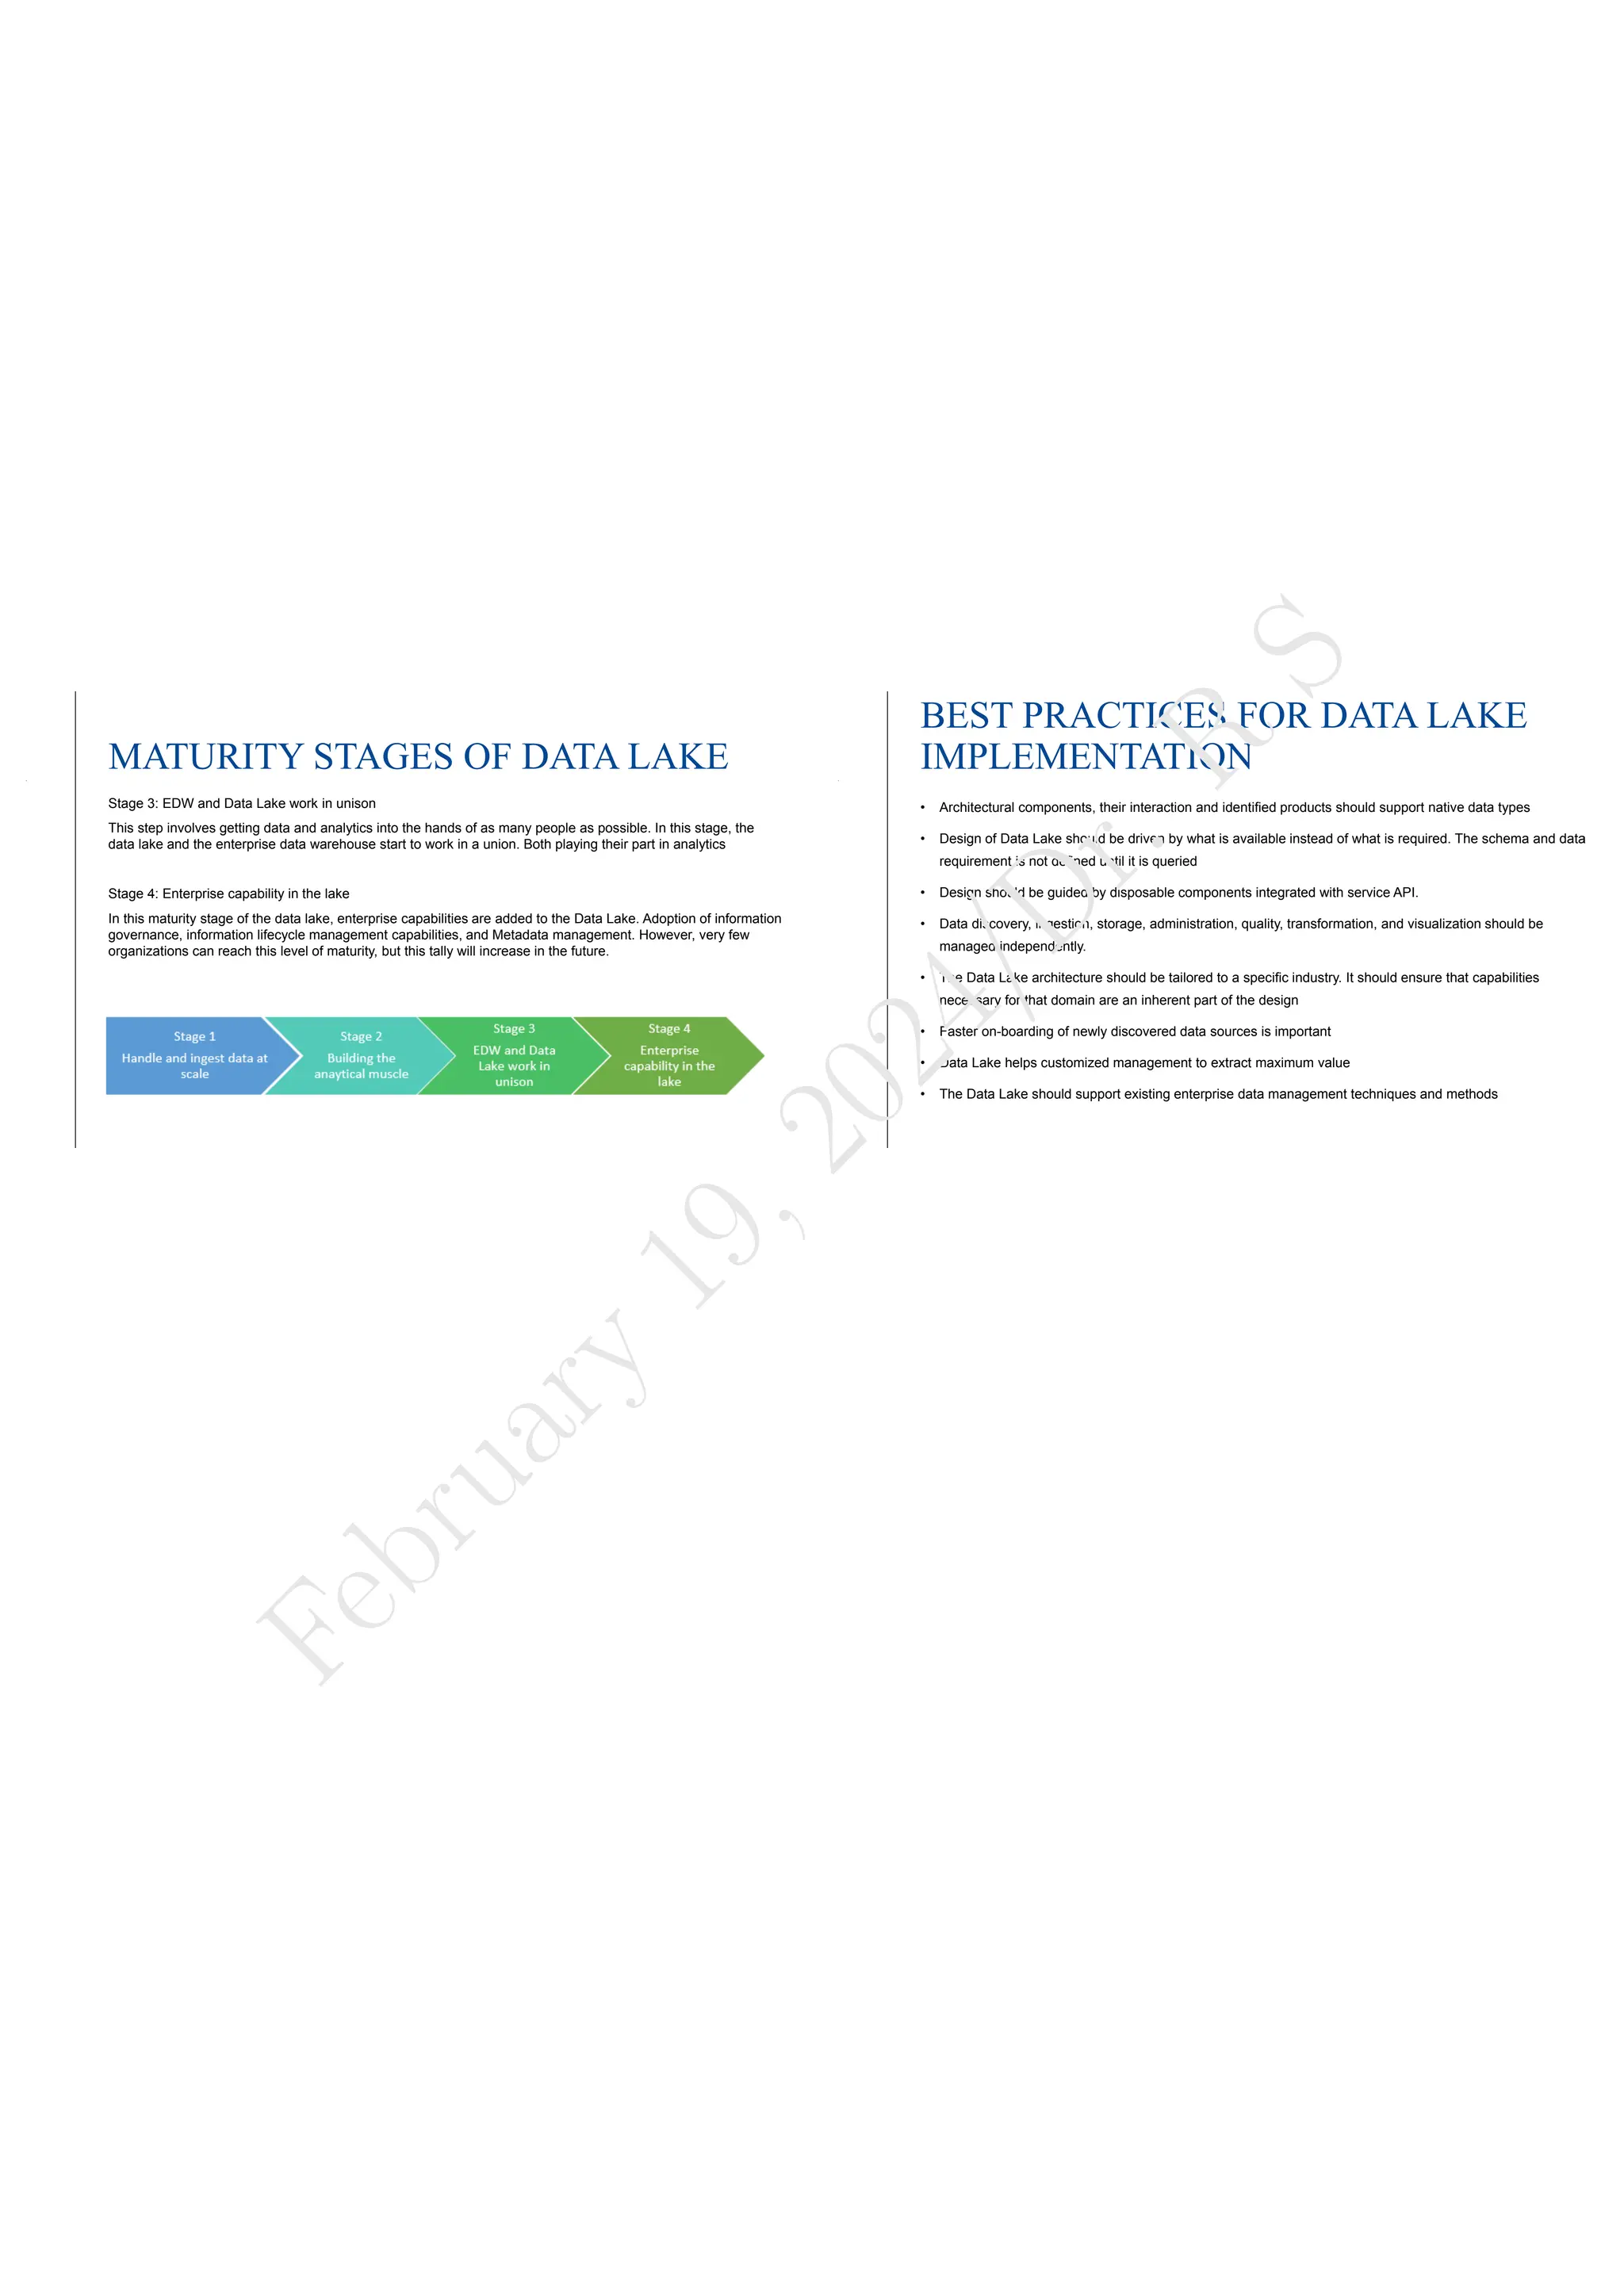
The document provides an overview of data analytics and big data concepts. It discusses the characteristics of big data, including the four V's of volume, velocity, variety and veracity. It also describes different types of data like structured, semi-structured and unstructured data. The document then introduces big data platforms and tools like Hadoop, Spark and Cassandra. Finally, it discusses the need for data analytics in business, including enabling better decision making and improving efficiency.
![F
e
b
r
u
a
r
y
1
9
,
2
0
2
4
/
D
r
.
R
S
Part-I: Introduction to Data Analytics
1 Introduction To Big Data
What Is Big Data?
ˆ Big Data is often described as extremely large data sets that have grown beyond the ability to manage
and analyze them with traditional data processing tools.
ˆ Big Data defines a situation in which data sets have grown to such enormous sizes that conventional
information technologies can no longer effectively handle either the size of the data set or the scale and
growth of the data set.
ˆ In other words, the data set has grown so large that it is difficult to manage and even harder to garner
value out of it.
ˆ The primary difficulties are the acquisition, storage, searching, sharing, analytics, and visual-
ization of data.
ˆ Big Data has its roots in the scientific and medical communities, where the complex analysis of massive
amounts of data has been done for drug development, physics modeling, and other forms of research,
all of which involve large data sets.
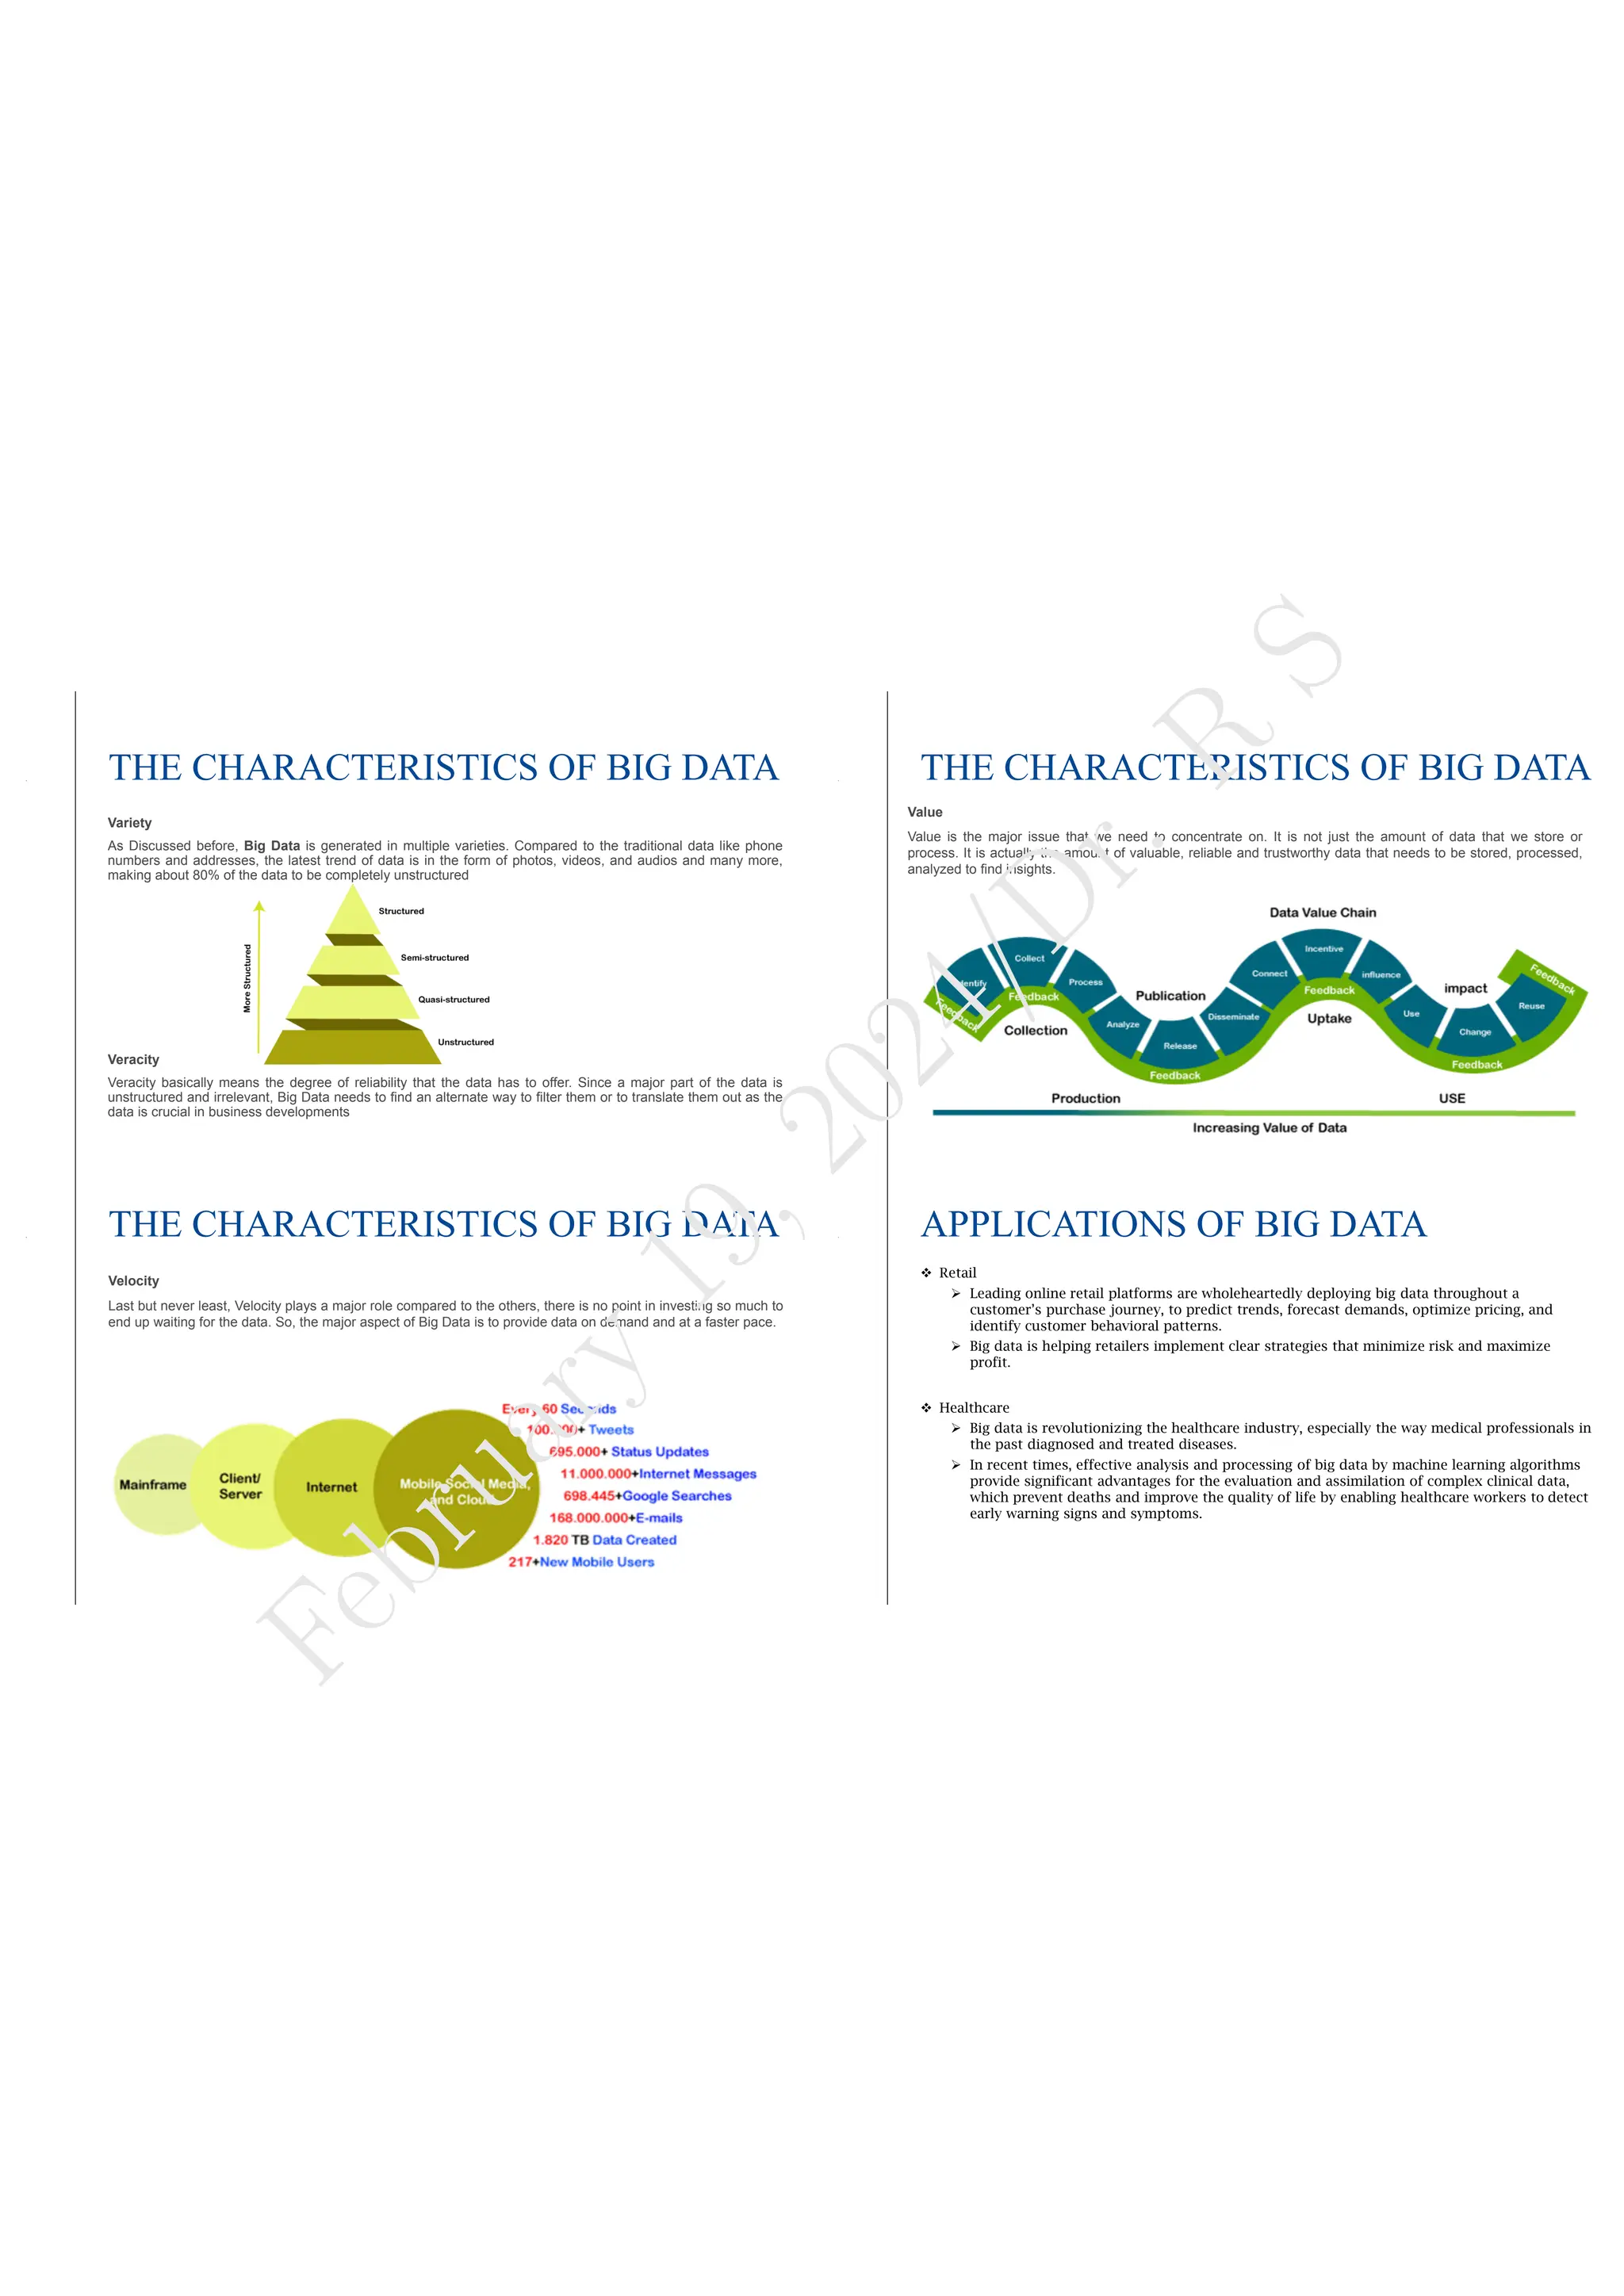
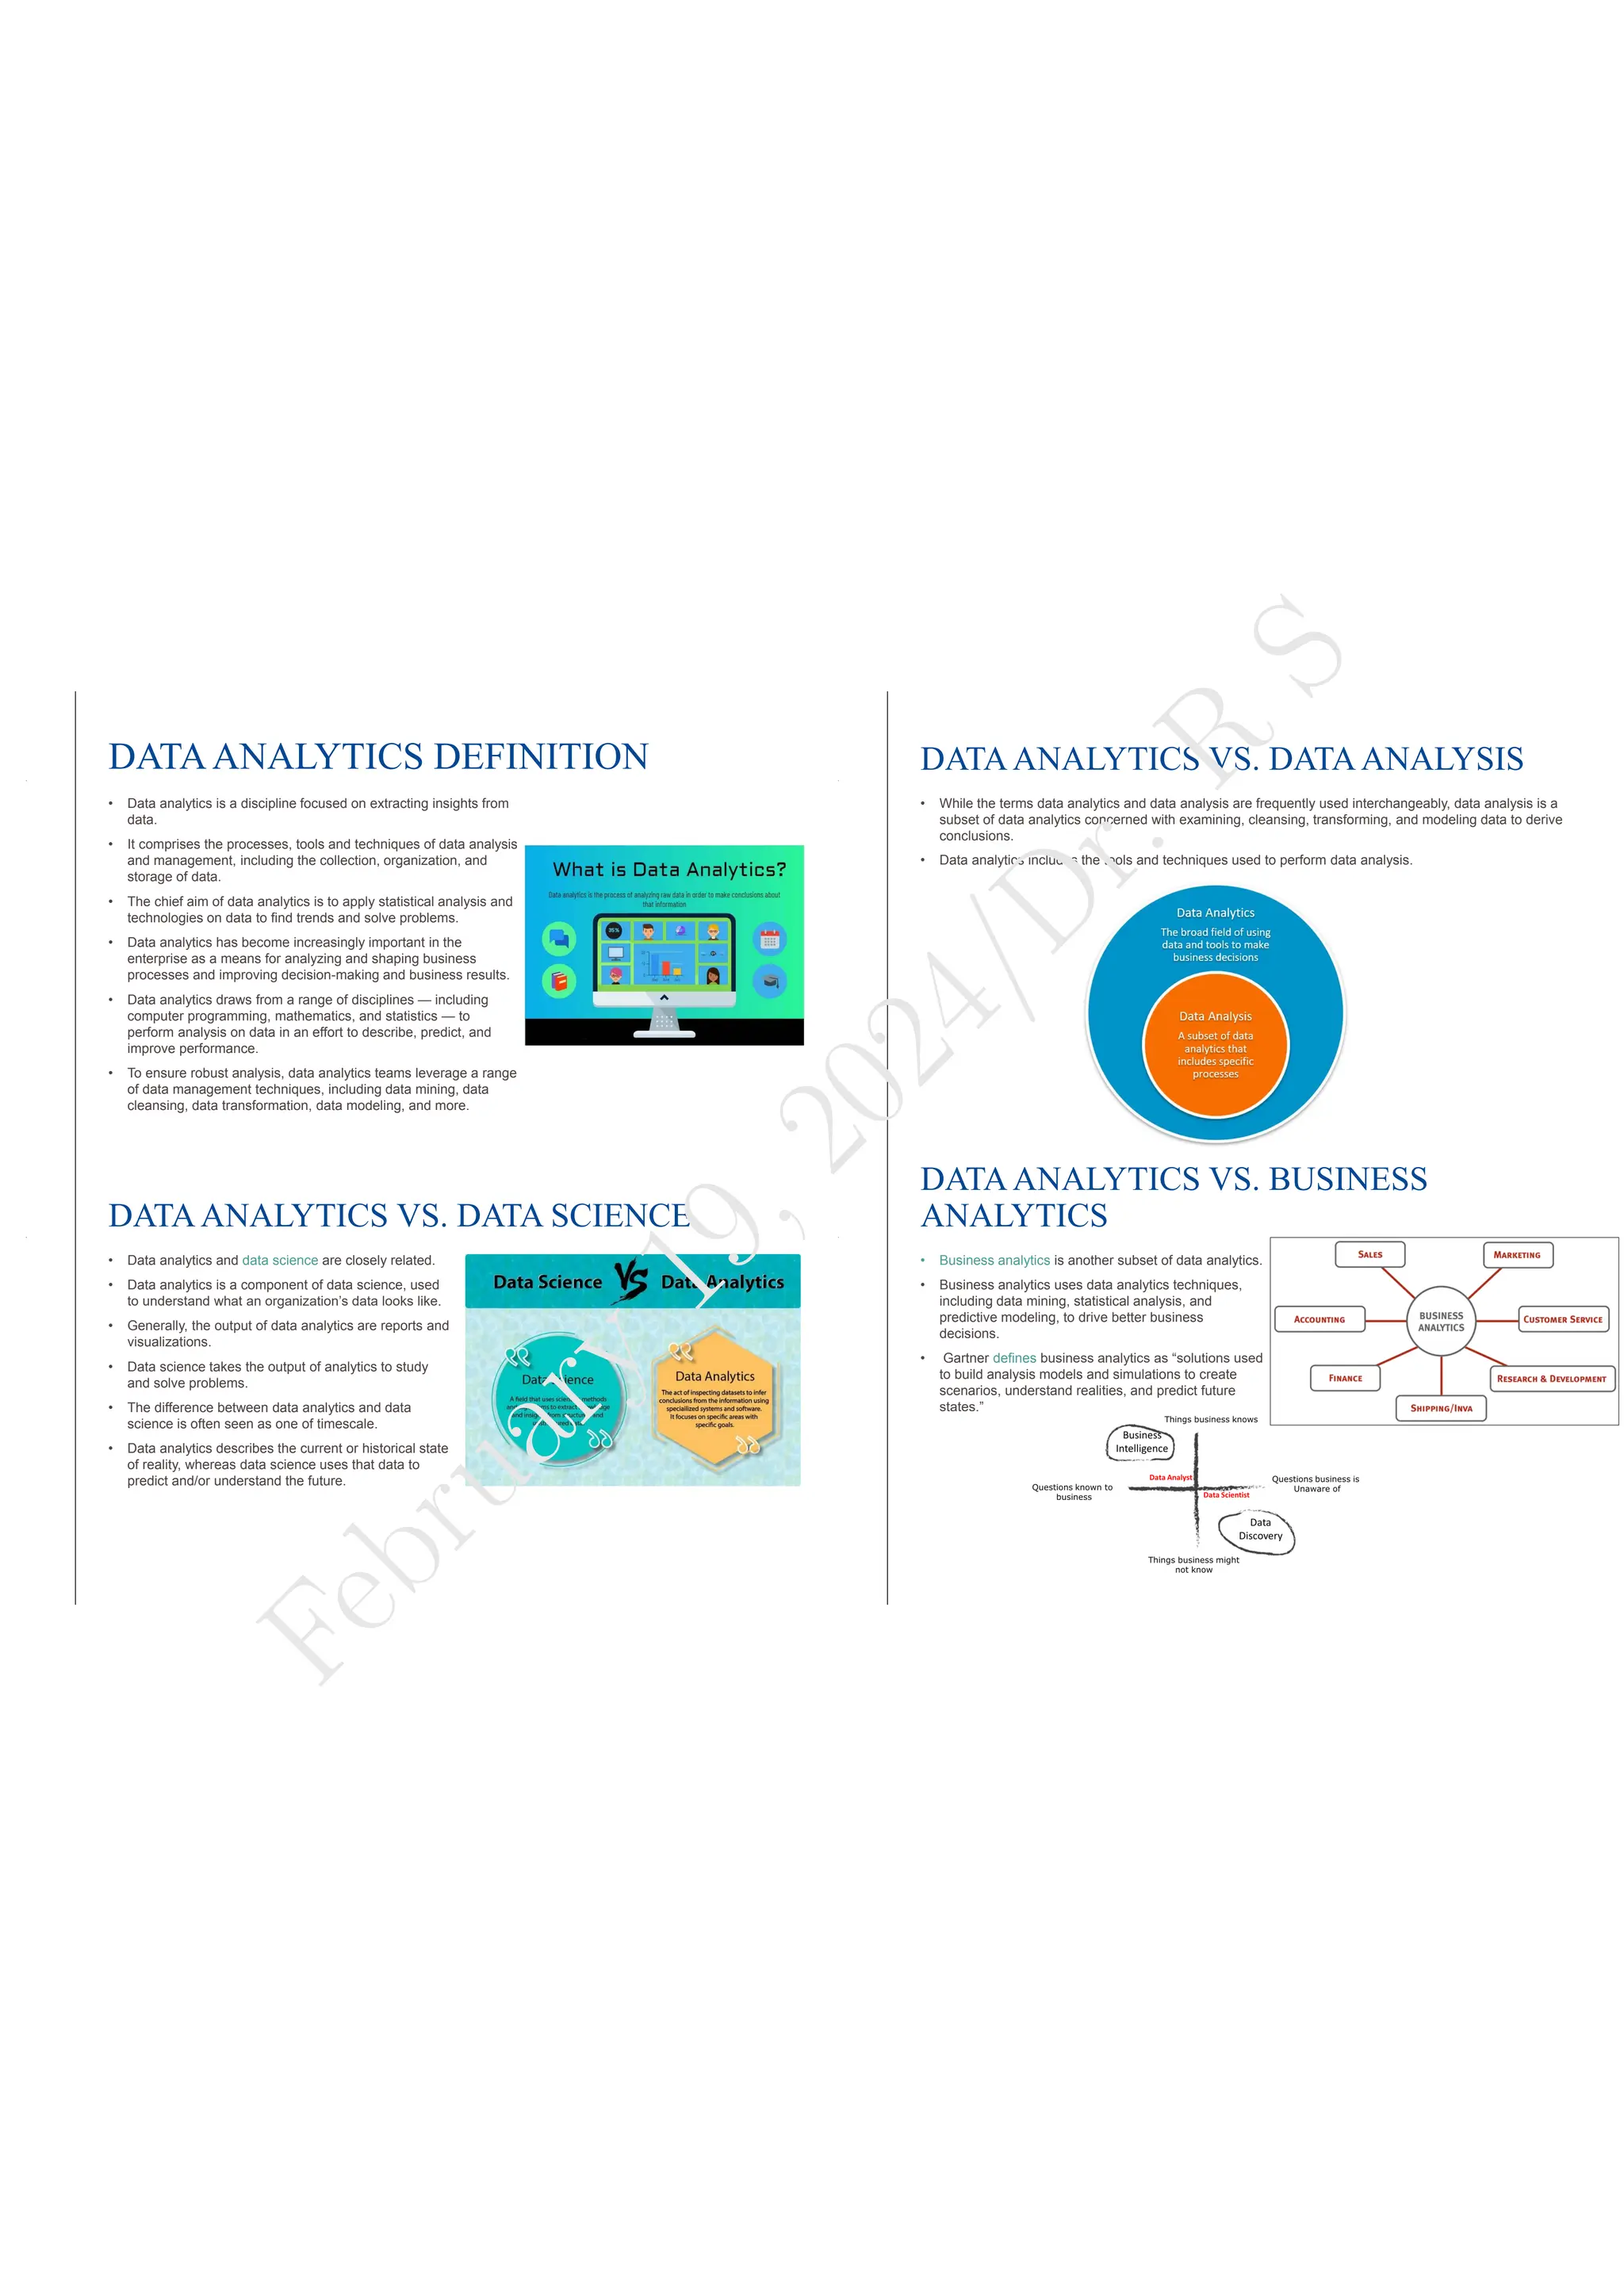
These 4Vs (See Figure 1) [13] 1
of Big Data lay out the path to analytics, with each having intrinsic value
in the process of discovering value. Nevertheless, the complexity of Big Data does not end with just four
1Volume—Organizations collect data from a variety of sources, including transactions, smart (IoT) devices, industrial
equipment, videos, images, audio, social media and more. In the past, storing all that data would have been too costly – but
cheaper storage using data lakes, Hadoop and the cloud have eased the burden.
Velocity—With the growth in the Internet of Things, data streams into businesses at an unprecedented speed and must be
handled in a timely manner. RFID tags, sensors and smart meters are driving the need to deal with these torrents of data in
near-real time.
Variety—Data comes in all types of formats – from structured, numeric data in traditional databases to unstructured text
documents, emails, videos, audios, stock ticker data and financial transactions.
Veracity—Veracity refers to the quality of data. Because data comes from so many different sources, it’s difficult to link,
match, cleanse and transform data across systems. Businesses need to connect and correlate relationships, hierarchies and
multiple data linkages. Otherwise, their data can quickly spiral out of control.
Value—This refers to the value that the big data can provide and it relates directly to what organizations can do with that
collected data. It is often quantified as the potential social or economic value that the data might create.
3](https://image.slidesharecdn.com/kit-601-l-unit-1-240219102731-858108ce/75/Introduction-to-Data-Analytics-and-data-analytics-life-cycle-3-2048.jpg)
![F
e
b
r
u
a
r
y
1
9
,
2
0
2
4
/
D
r
.
R
S
Figure 1: Illustration of Big Data [14].
dimensions. There are other factors at work as well: the processes that Big Data drives. These processes
are a conglomeration of technologies and analytics that are used to define the value of data sources, which
translates to actionable elements that move businesses forward.
Many of those technologies or concepts are not new but have come to fall under the umbrella of Big
Volatility—It deals with “How long the data is valid?”
Validity—It refers to accuracy and correctness of data. Any data picked up for analysis needs to be accurate.
Variability—In addition to the increasing velocities and varieties of data, data flows are unpredictable – changing often and
varying greatly. It’s challenging, but businesses need to know when something is trending in social media, and how to manage
daily, seasonal and event-triggered peak data loads.
4](https://image.slidesharecdn.com/kit-601-l-unit-1-240219102731-858108ce/75/Introduction-to-Data-Analytics-and-data-analytics-life-cycle-4-2048.jpg)
![F
e
b
r
u
a
r
y
1
9
,
2
0
2
4
/
D
r
.
R
S
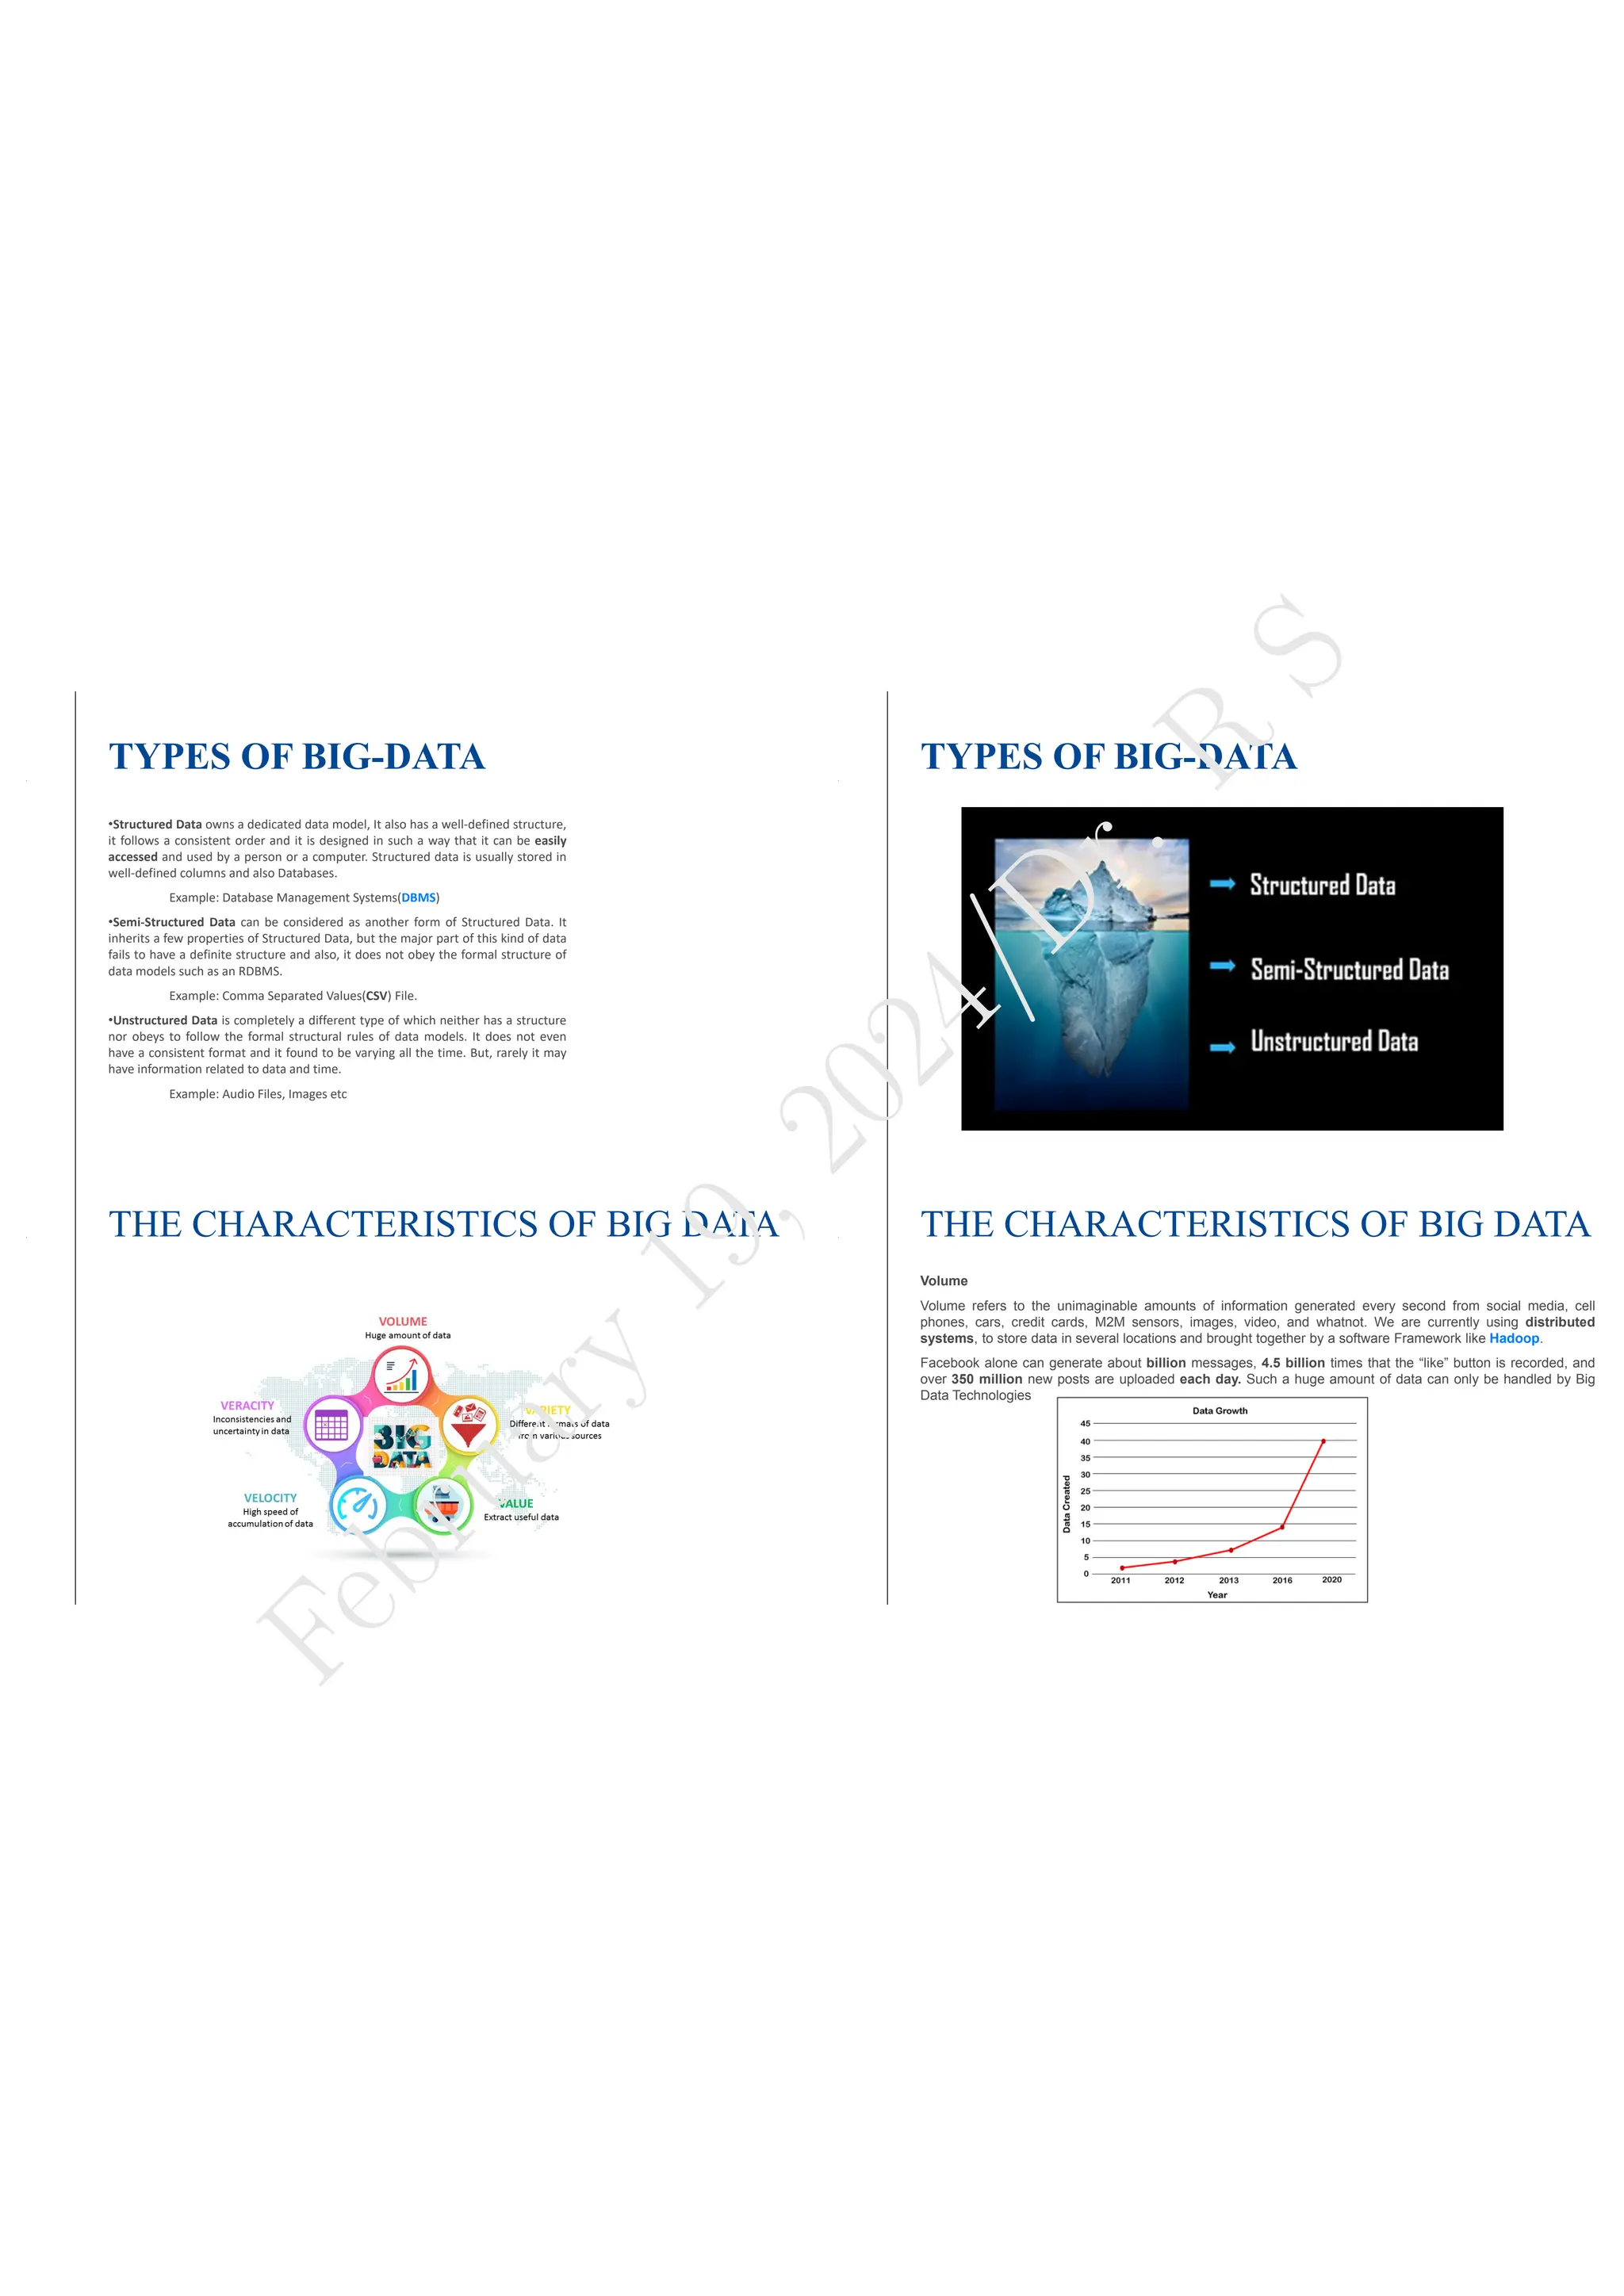
2. Semi-structured data:—Sem-istructured data fall between unstructured and structured data. Semi-
structured data do not have a formal structure like a database with tables and relationships. However,
unlike unstructured data, semi-structured data have tags or other markers to separate the elements
and provide a hierarchy of records and fields, which define the data. For example, XML, JSON, E-mail,
etc.
3. Unstructured data:—unstructured data, in contrast, normally have no BI behind them. Unstruc-
tured data are not organized into tables and cannot be natively used by applications or interpreted
by a database. A good example of unstructured data would be a collection of binary image files.
For example, memos, chat-rooms, PowerPoint presentations, images, videos, letters, researches, white
papers, body of an email, etc.
4 Introduction to Big Data Platform
Big data platforms refer to software technologies that are designed to manage and process large volumes of
data, often in real-time or near-real-time. These platforms are typically used by businesses and organizations
that generate or collect massive amounts of data, such as social media companies, financial institutions, and
healthcare providers.
There are several key components of big data platforms, including:
ˆ Data storage: Big data platforms provide large-scale data storage capabilities, often utilizing dis-
tributed file systems or NoSQL 2
databases to accommodate large amounts of data.
ˆ Data processing: Big data platforms offer powerful data processing capabilities, often utilizing par-
allel processing, distributed computing, and real-time streaming processing to analyze and transform
data.
ˆ Data analytics: Big data platforms provide advanced analytics capabilities, often utilizing machine
learning algorithms, statistical models, and visualization tools to extract insights from large datasets.
ˆ Data integration: Big data platforms allow for integration with other data sources, such as databases,
APIs, and streaming data sources, to provide a unified view of data.
2To overcome the rigidity of normalized RDBMS schemas, big data system accepts NoSQL. NOSQL is a method to manage
and store unstructured and non-relational data, also known as “Not Only SQL” [15], for example, HBase database.
8](https://image.slidesharecdn.com/kit-601-l-unit-1-240219102731-858108ce/75/Introduction-to-Data-Analytics-and-data-analytics-life-cycle-8-2048.jpg)
![F
e
b
r
u
a
r
y
1
9
,
2
0
2
4
/
D
r
.
R
S
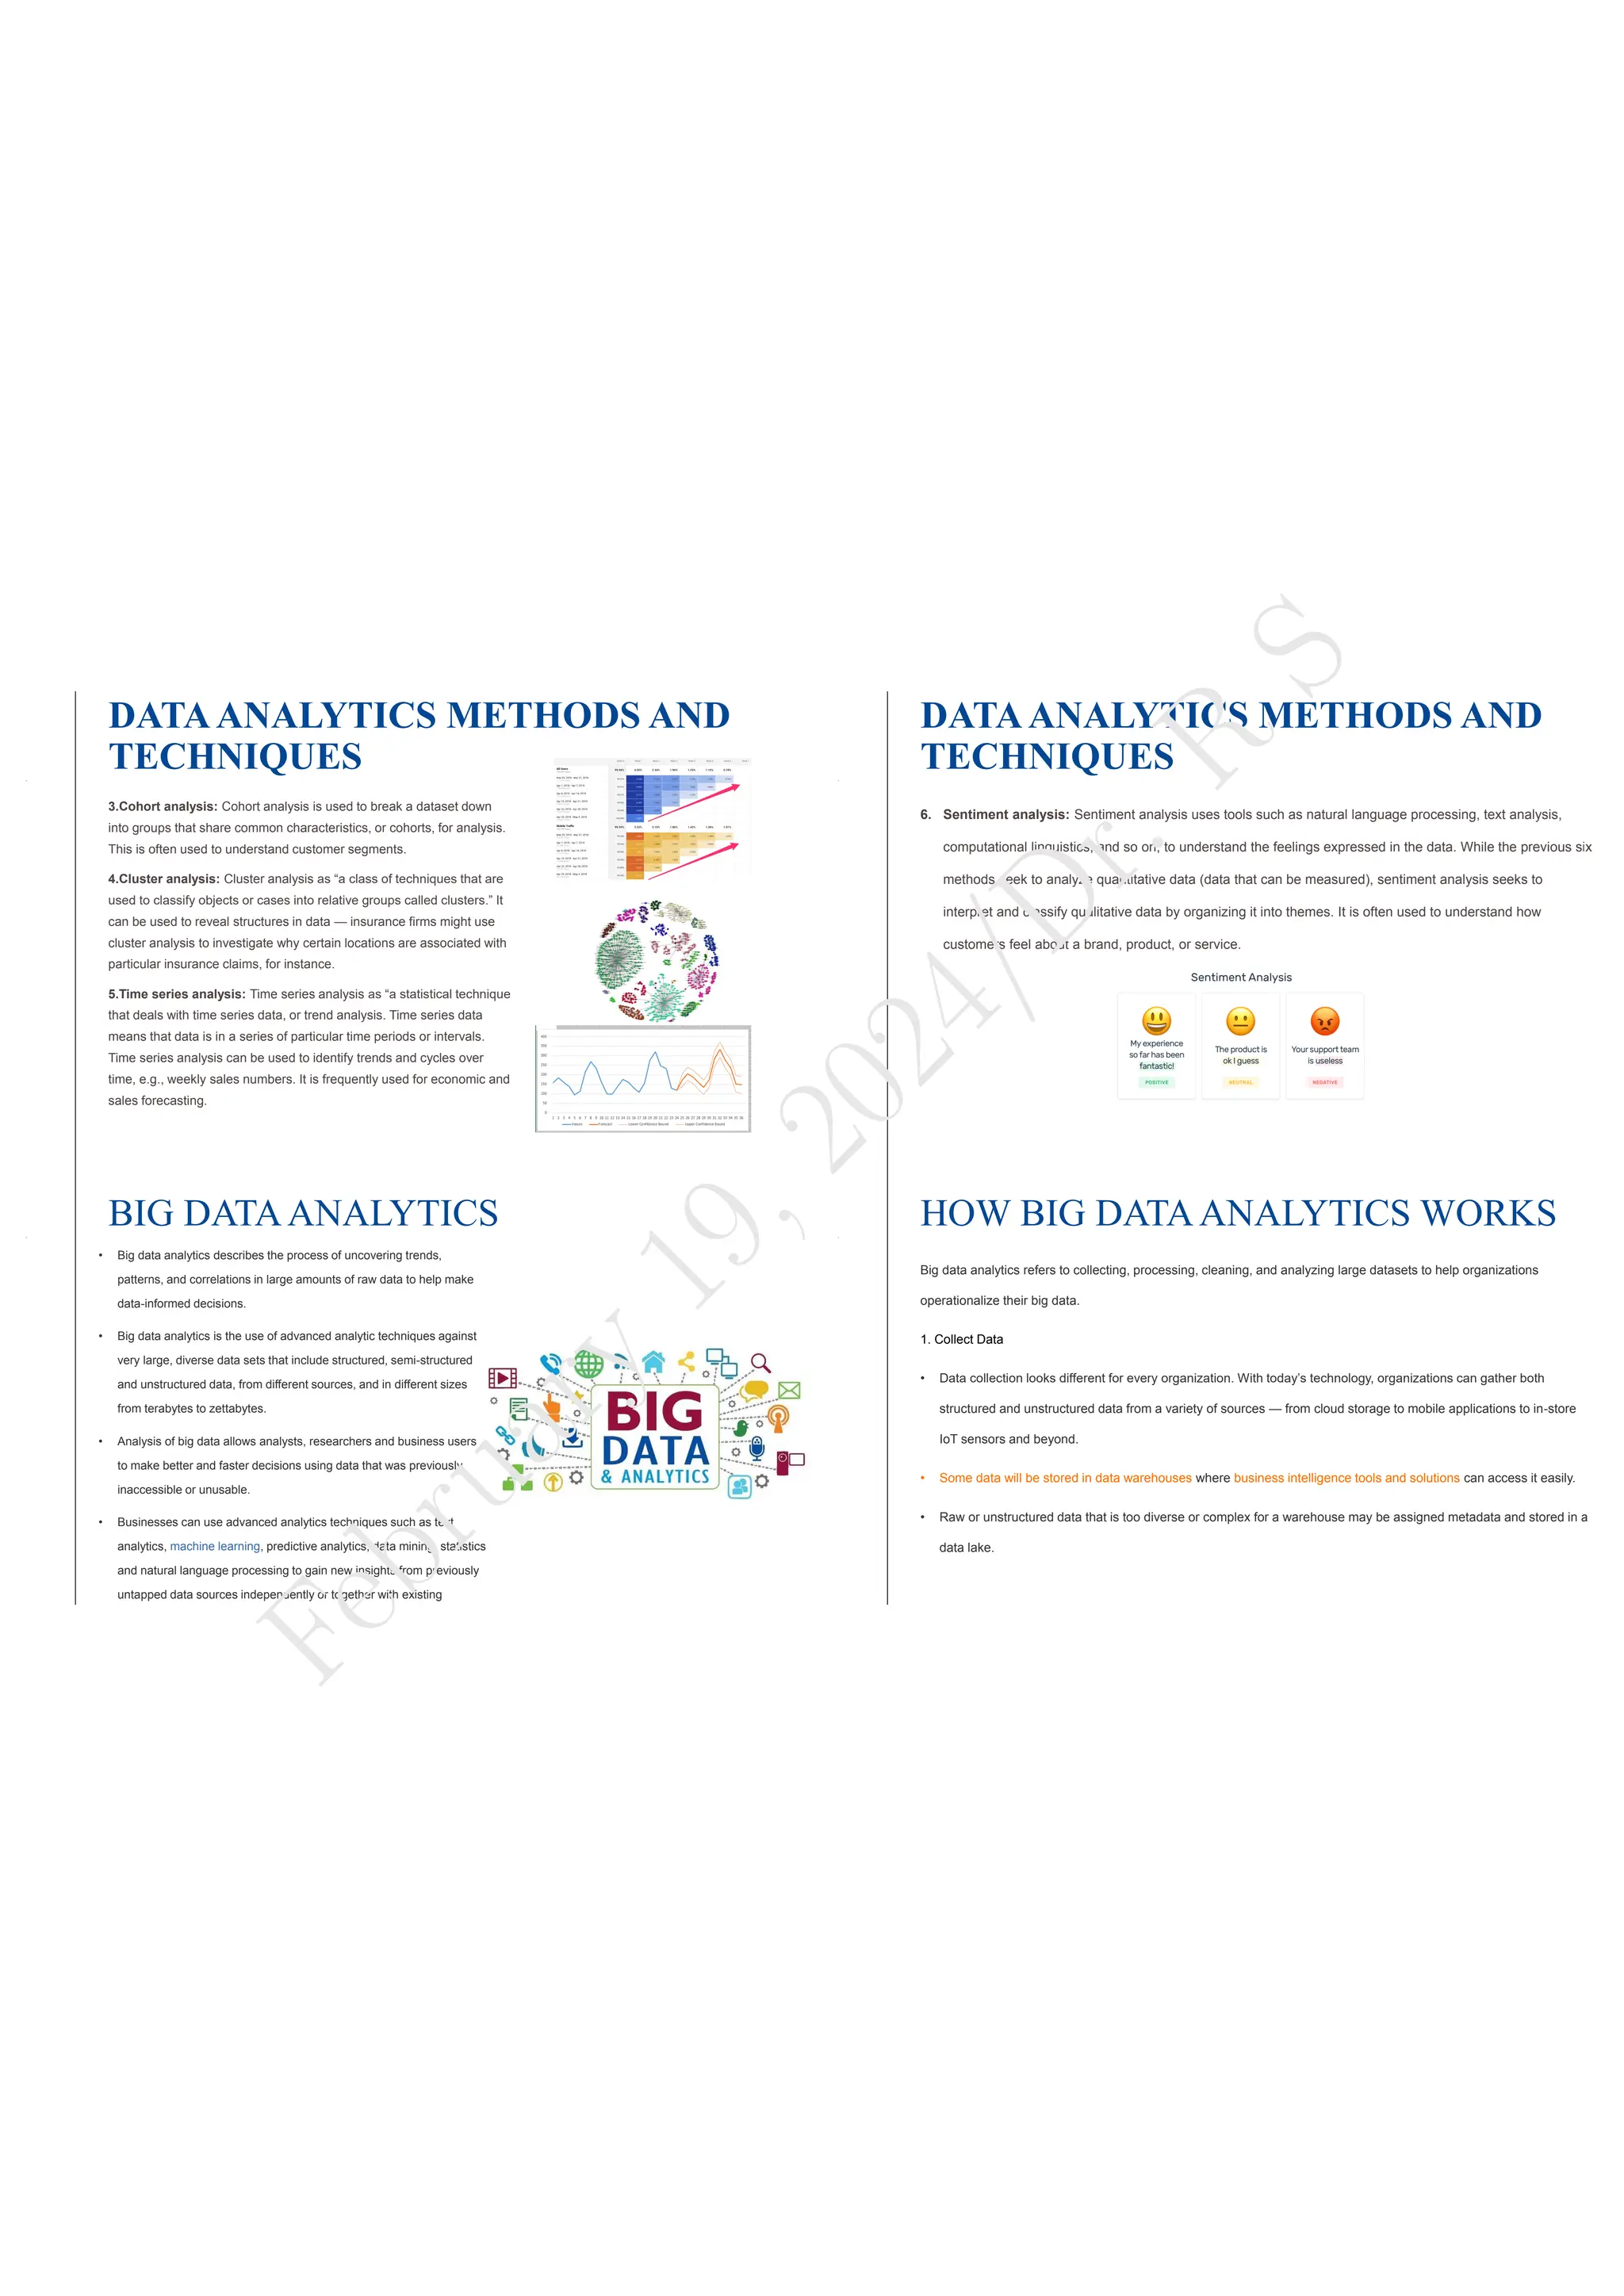
Figure 3: Illustration of phases of data analytics lifecycle [12].
1.3.1 Phase 1: Data Discovery
This phase is all about defining the data’s purpose and how to achieve it by the end of the data analytics
lifecycle. The stage consists of identifying critical objectives a business is trying to discover by mapping out
the data. During this process, the team learns about the business domain and checks whether the business
unit or organization has worked on similar projects to refer to any learnings.
The team also evaluates technology, people, data, and time in this phase. For example, the team can
use Excel while dealing with a small dataset. However, heftier tasks demand more rigid tools for data
preparation and exploration. The team will need to use Python, R, Tableau Desktop or Tableau Prep, and
other data-cleaning tools in such scenarios.
This phase’s critical activities include framing the business problem, formulating initial hypotheses to
test, and beginning data learning.
18](https://image.slidesharecdn.com/kit-601-l-unit-1-240219102731-858108ce/75/Introduction-to-Data-Analytics-and-data-analytics-life-cycle-18-2048.jpg)

![F
e
b
r
u
a
r
y
1
9
,
2
0
2
4
/
D
r
.
R
S
2 Reference
[1] https://www.jigsawacademy.com/blogs/hr-analytics/data-analytics-lifecycle/
[2] https://statacumen.com/teach/ADA1/ADA1_notes_F14.pdf
[3] https://www.youtube.com/watch?v=fDRa82lxzaU
[4] https://www.investopedia.com/terms/d/data-analytics.asp
[5] http://egyankosh.ac.in/bitstream/123456789/10935/1/Unit-2.pdf
[6] http://epgp.inflibnet.ac.in/epgpdata/uploads/epgp_content/computer_science/16._data_analytics/
03._evolution_of_analytical_scalability/et/9280_et_3_et.pdf
[7] https://bhavanakhivsara.files.wordpress.com/2018/06/data-science-and-big-data-analy-nieizv_
book.pdf
[8] https://www.researchgate.net/publication/317214679_Sentiment_Analysis_for_Effective_Stock_
Market_Prediction
[9] https://snscourseware.org/snscenew/files/1569681518.pdf
[10] http://csis.pace.edu/ctappert/cs816-19fall/books/2015DataScience&BigDataAnalytics.pdf
[11] https://www.youtube.com/watch?v=mccsmoh2_3c
[12] https://mentalmodels4life.net/2015/11/18/agile-data-science-applying-kanban-in-the-analytics-li
[13] https://www.sas.com/en_in/insights/big-data/what-is-big-data.html#:~:text=Big%20data%
20refers%20to%20data,around%20for%20a%20long%20time.
[14] https://www.javatpoint.com/big-data-characteristics
[15] Liu, S., Wang, M., Zhan, Y., & Shi, J. (2009). Daily work stress and alcohol use: Testing the cross-
level moderation effects of neuroticism and job involvement. Personnel Psychology,62(3), 575–597.
http://dx.doi.org/10.1111/j.1744-6570.2009.01149.x
********************
35](https://image.slidesharecdn.com/kit-601-l-unit-1-240219102731-858108ce/75/Introduction-to-Data-Analytics-and-data-analytics-life-cycle-35-2048.jpg)