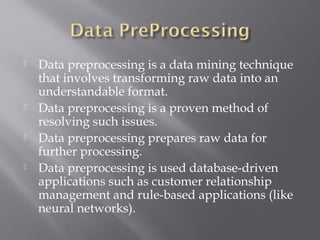
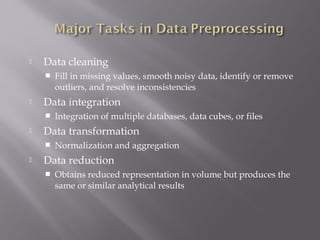
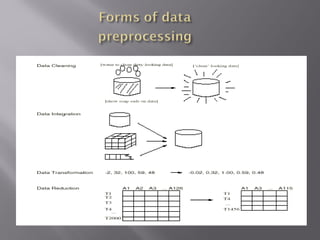
Data preprocessing involves transforming raw data into a clean and understandable format. It includes data cleaning, integration, transformation, and reduction. Data cleaning identifies outliers and resolves inconsistencies. Data integration combines data from multiple sources. Data transformation performs operations like normalization and aggregation. Data reduction obtains a reduced representation of data to improve mining performance without losing essential information.


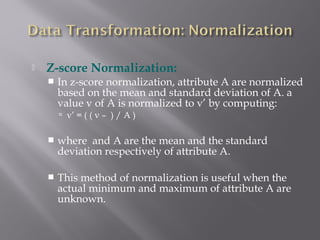
![
min-max normalization
Min-max normalization performs a linear
transformation on the original data.
Suppose that mina and maxa are the minimum and
the maximum values for attribute A. Min-max
normalization maps a value v of A to v’ in the range
[new-mina, new-maxa] by computing:
v’= ( (v-mina) / (maxa – mina) ) * (new-maxa – newmina)+
new-mina](https://image.slidesharecdn.com/new1-140223111822-phpapp02/85/Data-PreProcessing-17-320.jpg)