
![Antibiotic concentration over time
17
0.0
0.2
0.4
0.6
0.8
1.0
1.2
0 4 8 12 16 20 24 28
Aerated manure
Non-aerated manure
Aerabted biosolids
Non-aerated biosolids
[Florfenicol]/[Florfenicol]
0
Time (days)
0.0
0.2
0.4
0.6
0.8
1.0
1.2
0 4 8 12 16 20 24 28
[Sulfadimethoxine]/[Sulfadimethoxine]
0
Time (days)
0.0
0.2
0.4
0.6
0.8
1.0
1.2
0 4 8 12 16 20 24 28
[Sulfamethazine]/[Sulfamethazine]
0
Time (days)
0.0
0.2
0.4
0.6
0.8
1.0
1.2
0 4 8 12 16 20 24 28
[Tylosin]/[Tylosin]
0
Time (days)](https://image.slidesharecdn.com/barry-150504121534-conversion-gate01/85/Antibiotic-Losses-during-Thermophilic-Composting-17-320.jpg)
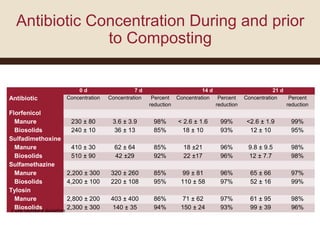
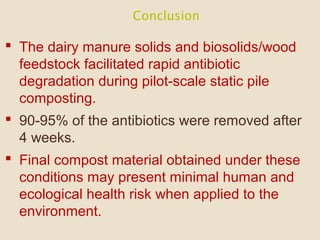


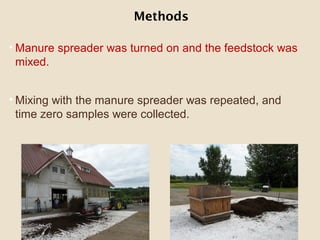
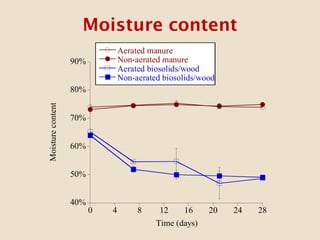
This study investigates the degradation of antibiotics during the composting of dairy manure solids and biosolids, revealing that 90-95% of antibiotics are eliminated within four weeks. Different composting treatments were tested, which showed significant reductions in concentrations of various antibiotics such as florfenicol, sulfadimethoxine, sulfamethazine, and tylosin. The findings suggest that the compost produced under these conditions poses minimal health risks when applied to the environment.


