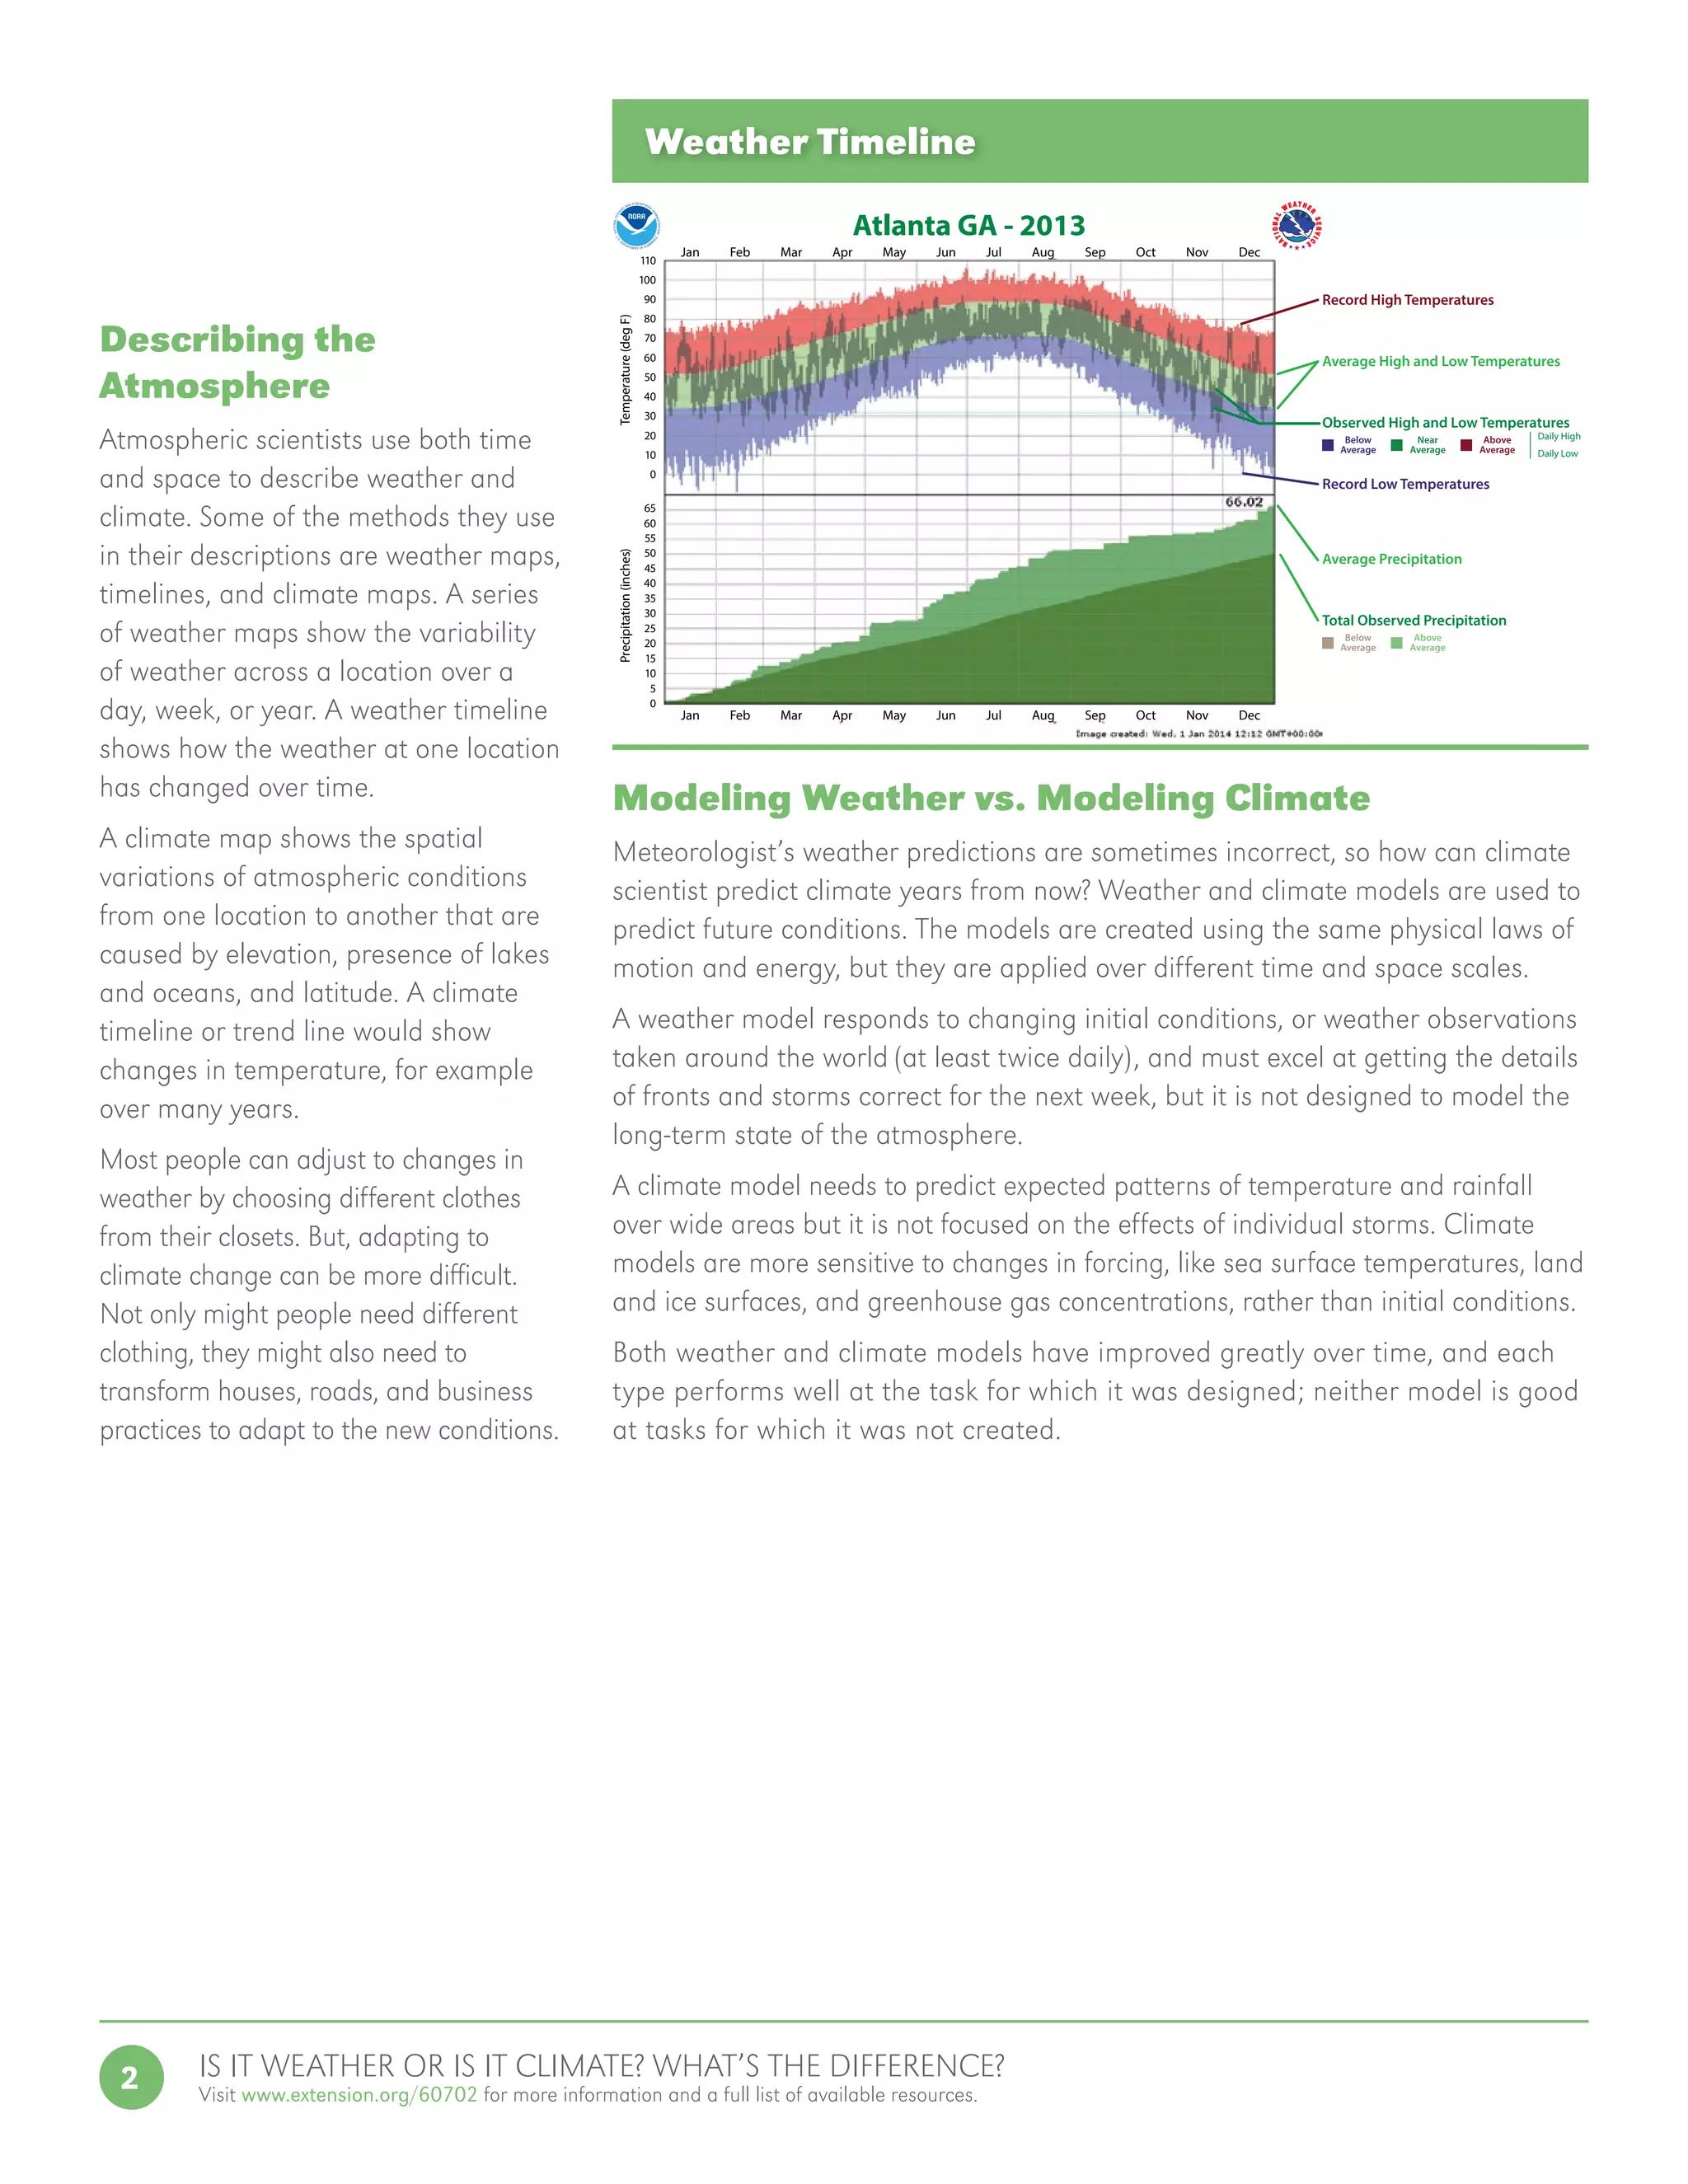
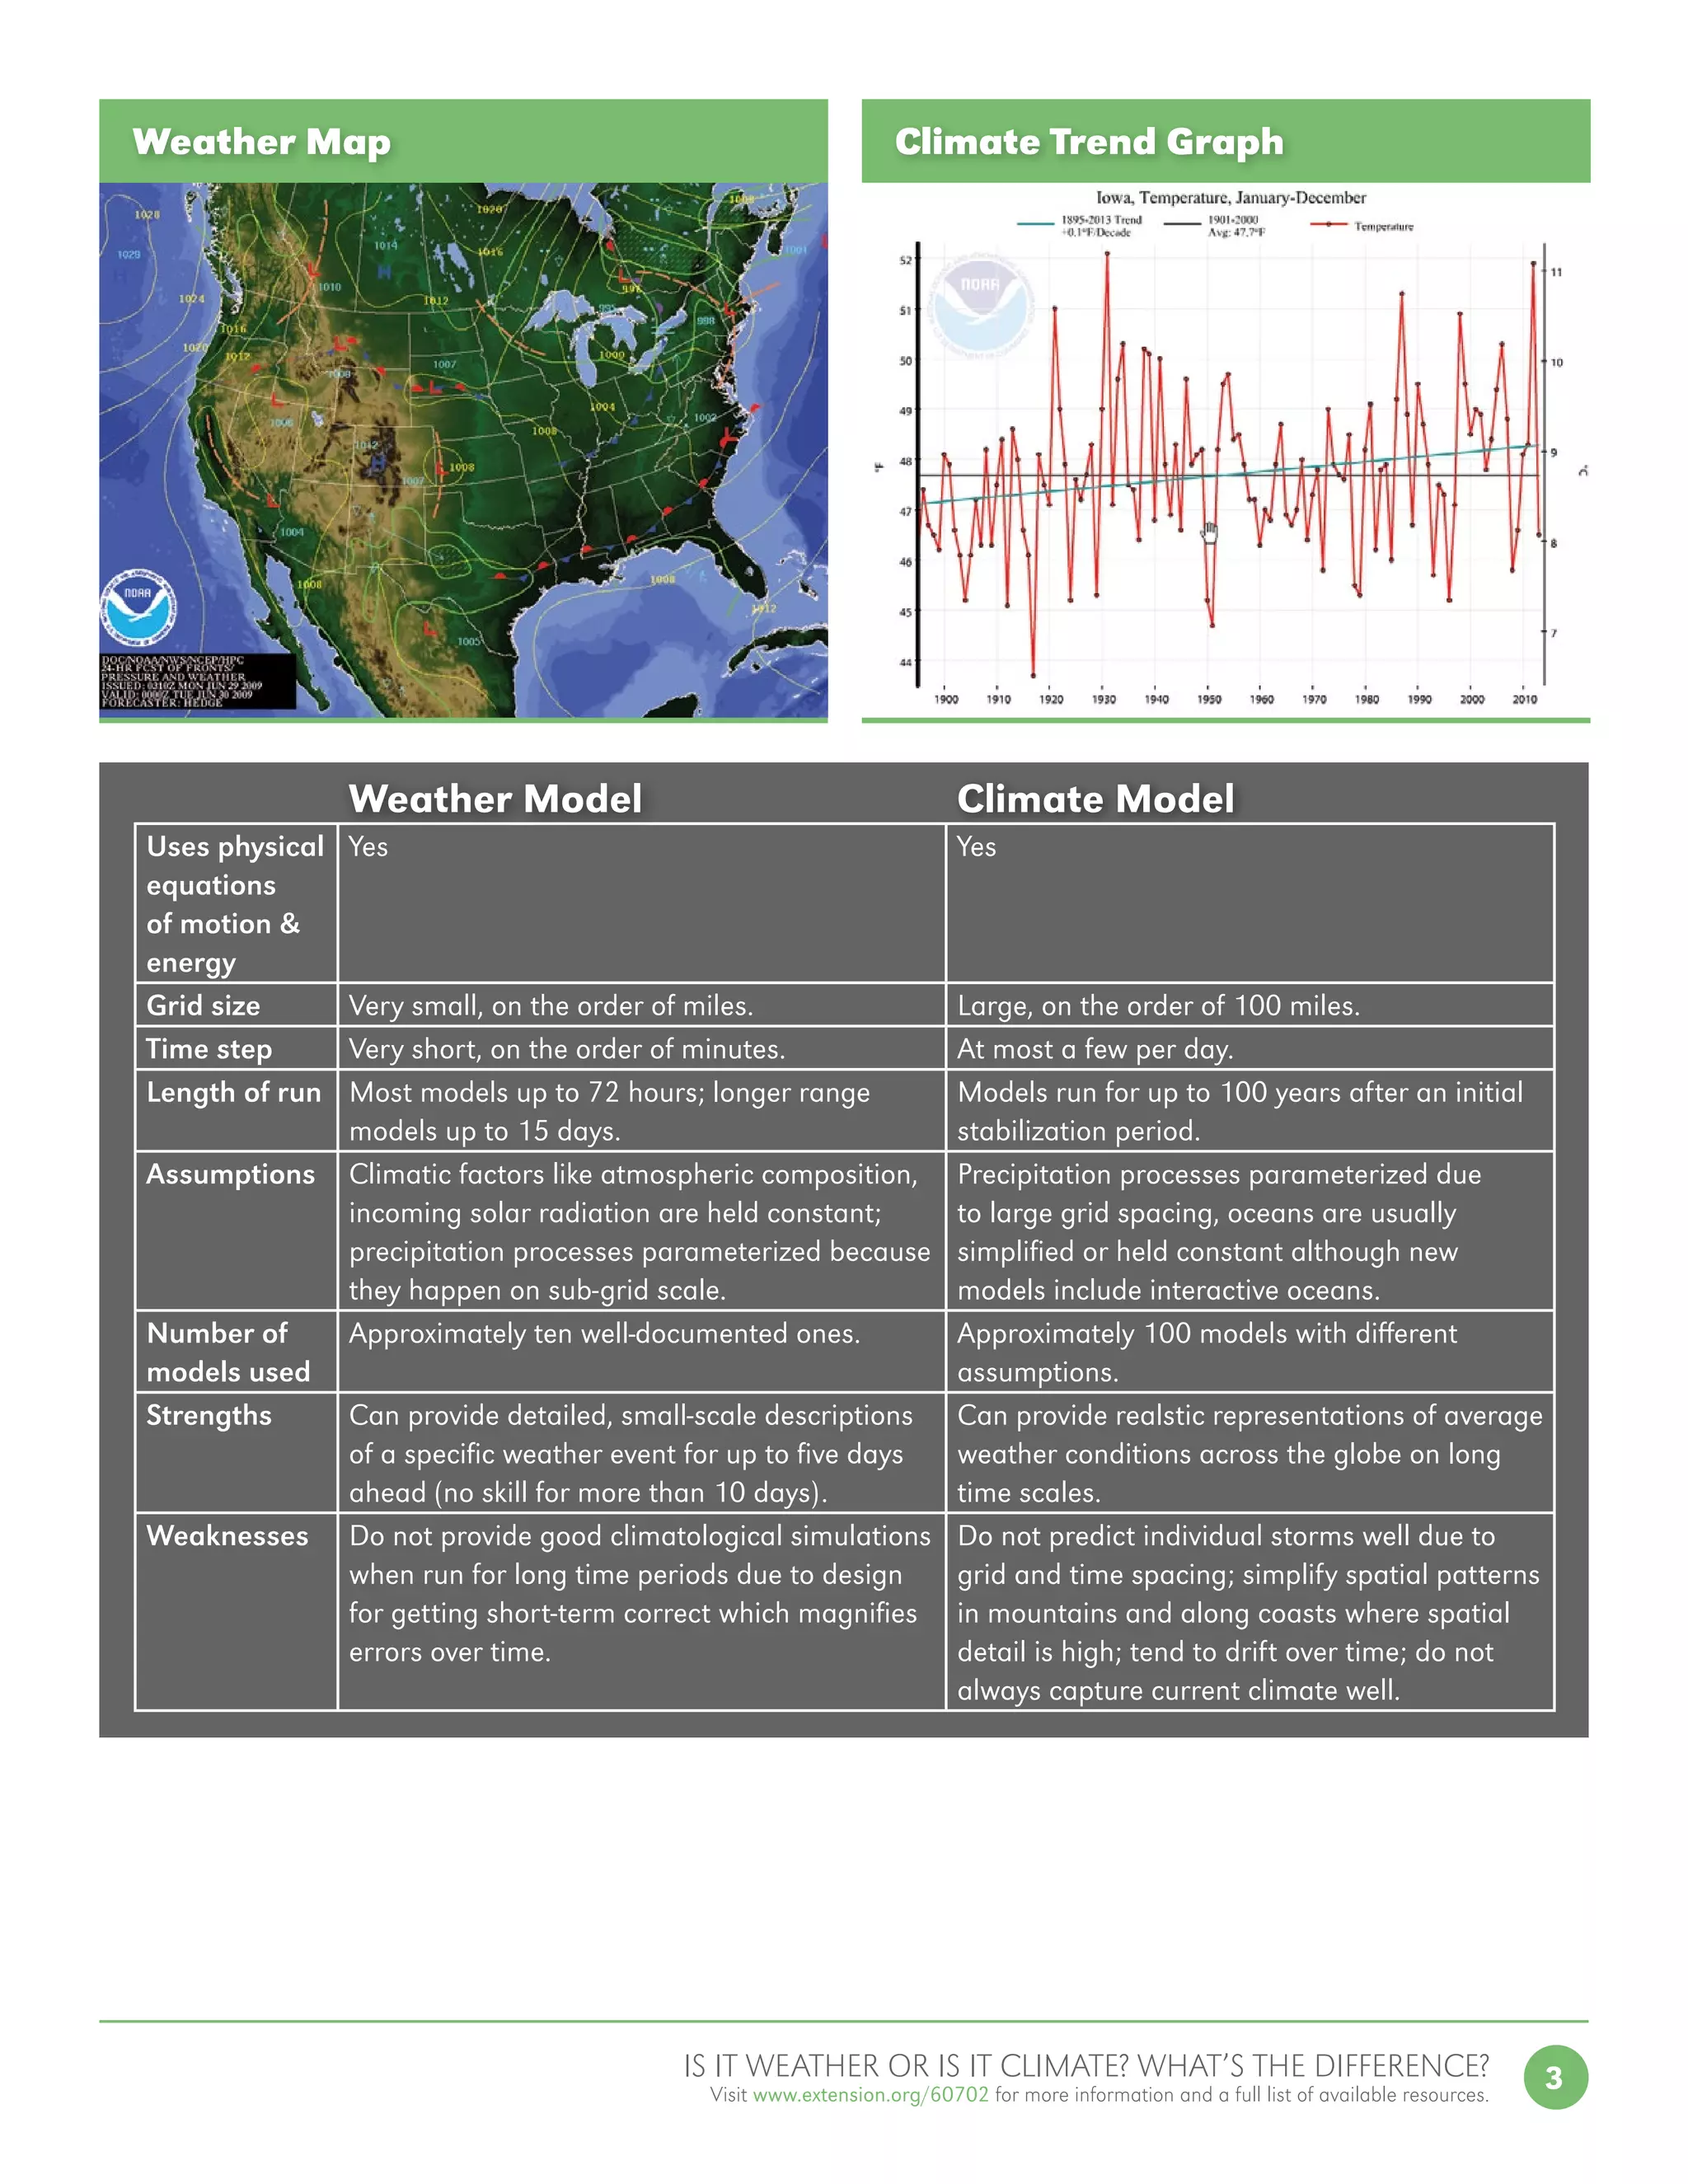
1
1
1
2
Table of Contents
Weather and Climate
Measuring the Atmosphere
Describing the Atmosphere
Modeling Weather vs.
Modeling Climate2
Key Points
Weather and Climate
Both weather and climate rely on observations of temperature, pressure, sunlight,
clouds, rain, and snow. The main difference between the two is the time scale
over which the conditions are described. Weather is generally a snapshot of
the atmosphere at a single time or over a few days. Climate generally refers to
conditions spanning months, years, and even decades. One way to remember the
difference between weather and climate is: Weather tells you what to wear on any
given day; climate tells you what wardrobe to own.
Measuring the Atmosphere
For most of us, weather and climate are two different ways of looking at
measurements of atmospheric conditions. These measurements are taken at surface
weather stations and at higher levels of the atmosphere with weather balloons.
For consistency, those measurements should be taken from standard instruments
at locations that are stable over long periods. In that respect, weather is easier to
measure consistently. Climate scientists have to be mindful of changes in the record
caused by relocation of observation sites, changes in times of observations, changes
in the instruments used to collect the measurements, or changes at the sites due to
construction, growth of trees, or expansion of cities over time.
Key Points
• Weather represents short-term and small-scale changes in the atmosphere.
• Climate describes the distribution of weather over longer periods.
This project was supported by
Agricultural and Food Research
Initiative Competitive Grant
No. 2011-67003-30206 from
the USDA National Institute of
Food and Agriculture.
Livestock and Poultry
Environmental
Learning Center
IS IT WEATHER OR
IS IT CLIMATE? WHAT’S
THE DIFFERENCE?
MAY 2014Pam Knox, Agricultural Climatologist, University of Georgia
2 IS IT WEATHER OR IS IT CLIMATE? WHAT’S THE DIFFERENCE?
Visit www.extension.org/60702 for more information and a full list of available resources.
Describing the
Atmosphere
Atmospheric scientists use both time
and space to describe weather and
climate. Some of the methods they use
in their descriptions are weather maps,
timelines, and climate maps. A series
of weather maps show the variability
of weather across a location over a
day, week, or year. A weather timeline
shows how the weather at one location
has changed over time.
A climate map shows the spatial
variations of atmospheric conditions
from one location to another that are
caused by elevation, presence of lakes
and oceans, and latitude. A climate
timeline or trend line would show
changes in temperature, for example
over many years.
Most people can adjust to changes in
weather by choosing different clothes
from their closets. But, adapting to
climate change can be more difficult.
Not only might people need different
clothing, they might also need to
transform houses, roads, and business
practices to adapt to the new conditions.
Weather Timeline
Atlanta GA - 2013
Record High Temperatures
Observed High and Low Temperatures
Record Low Temperatures
Below
Average
Near
Average
Above
Average
Average High and Low Temperatures
Total Observed Precipitation
Below
Average
Above
Average
Average Precipitation
Daily High
Daily Low
Jan Feb Mar Apr May Jun AugJul Sep Oct Nov Dec
110
100
90
80
70
60
50
40
30
20
10
0
65
Precipitation(inches)Temperature(degF)
60
55
50
45
40
35
30
25
20
15
10
5
0
Modeling Weather vs. Modeling Climate
Meteorologist’s weather predictions are sometimes incorrect, so how can climate
scientist predict climate years from now? Weather and climate models are used to
predict future conditions. The models are created using the same physical laws of
motion and energy, but they are applied over different time and space scales.
A weather model responds to changing initial conditions, or weather observations
taken around the world (at least twice daily), and must excel at getting the details
of fronts and storms correct for the next week, but it is not designed to model the
long-term state of the atmosphere.
A climate model needs to predict expected patterns of temperature and rainfall
over wide areas but it is not focused on the effects of individual storms. Climate
models are more sensitive to changes in forcing, like sea surface temperatures, land
and ice surfaces, and greenhouse gas concentrations, rather than initial conditions.
Both weather and climate models have improved greatly over time, and each
type performs well at the task for which it was designed; neither model is good
at tasks for which it was not created.
3IS IT WEATHER OR IS IT CLIMATE? WHAT’S THE DIFFERENCE?
Visit www.extension.org/60702 for more information and a full list of available resources.
Uses physical
equations
of motion 
energy
Yes Yes
Grid size Very small, on the order of miles. Large, on the order of 100 miles.
Time step Very short, on the order of minutes. At most a few per day.
Length of run Most models up to 72 hours; longer range
models up to 15 days.
Models run for up to 100 years after an initial
stabilization period.
Assumptions Climatic factors like atmospheric composition,
incoming solar radiation are held constant;
precipitation processes parameterized because
they happen on sub-grid scale.
Precipitation processes parameterized due
to large grid spacing, oceans are usually
simplified or held constant although new
models include interactive oceans.
Number of
models used
Approximately ten well-documented ones. Approximately 100 models with different
assumptions.
Strengths Can provide detailed, small-scale descriptions
of a specific weather event for up to five days
ahead (no skill for more than 10 days).
Can provide realstic representations of average
weather conditions across the globe on long
time scales.
Weaknesses Do not provide good climatological simulations
when run for long time periods due to design
for getting short-term correct which magnifies
errors over time.
Do not predict individual storms well due to
grid and time spacing; simplify spatial patterns
in mountains and along coasts where spatial
detail is high; tend to drift over time; do not
always capture current climate well.
Weather Map Climate Trend Graph
Weather Model Climate Model
4 IS IT WEATHER OR IS IT CLIMATE? WHAT’S THE DIFFERENCE?
Visit www.extension.org/60702 for more information and a full list of available resources.
Extension programs and employment are available to all
without discrimination. Evidence of noncompliance may be
reported through your local Extension office.
ThisprojectwassupportedbyAgriculturalandFoodResearch
Initiative Competitive Grant No. 2011-67003-30206 from the
USDA National Institute of Food and Agriculture.
Participating Universities
Cornell University
Texas AM University
University of Georgia
University of Minnesota
University of Nebraska–Lincoln
Washington State University
ANIMAL AGRICULTURE
CHANGING CLIMATEIN A

Is it weather or is it climate? What is the difference?

  • 1.
    1 1 1 2 Table of Contents Weatherand Climate Measuring the Atmosphere Describing the Atmosphere Modeling Weather vs. Modeling Climate2 Key Points Weather and Climate Both weather and climate rely on observations of temperature, pressure, sunlight, clouds, rain, and snow. The main difference between the two is the time scale over which the conditions are described. Weather is generally a snapshot of the atmosphere at a single time or over a few days. Climate generally refers to conditions spanning months, years, and even decades. One way to remember the difference between weather and climate is: Weather tells you what to wear on any given day; climate tells you what wardrobe to own. Measuring the Atmosphere For most of us, weather and climate are two different ways of looking at measurements of atmospheric conditions. These measurements are taken at surface weather stations and at higher levels of the atmosphere with weather balloons. For consistency, those measurements should be taken from standard instruments at locations that are stable over long periods. In that respect, weather is easier to measure consistently. Climate scientists have to be mindful of changes in the record caused by relocation of observation sites, changes in times of observations, changes in the instruments used to collect the measurements, or changes at the sites due to construction, growth of trees, or expansion of cities over time. Key Points • Weather represents short-term and small-scale changes in the atmosphere. • Climate describes the distribution of weather over longer periods. This project was supported by Agricultural and Food Research Initiative Competitive Grant No. 2011-67003-30206 from the USDA National Institute of Food and Agriculture. Livestock and Poultry Environmental Learning Center IS IT WEATHER OR IS IT CLIMATE? WHAT’S THE DIFFERENCE? MAY 2014Pam Knox, Agricultural Climatologist, University of Georgia
  • 2.
    2 IS ITWEATHER OR IS IT CLIMATE? WHAT’S THE DIFFERENCE? Visit www.extension.org/60702 for more information and a full list of available resources. Describing the Atmosphere Atmospheric scientists use both time and space to describe weather and climate. Some of the methods they use in their descriptions are weather maps, timelines, and climate maps. A series of weather maps show the variability of weather across a location over a day, week, or year. A weather timeline shows how the weather at one location has changed over time. A climate map shows the spatial variations of atmospheric conditions from one location to another that are caused by elevation, presence of lakes and oceans, and latitude. A climate timeline or trend line would show changes in temperature, for example over many years. Most people can adjust to changes in weather by choosing different clothes from their closets. But, adapting to climate change can be more difficult. Not only might people need different clothing, they might also need to transform houses, roads, and business practices to adapt to the new conditions. Weather Timeline Atlanta GA - 2013 Record High Temperatures Observed High and Low Temperatures Record Low Temperatures Below Average Near Average Above Average Average High and Low Temperatures Total Observed Precipitation Below Average Above Average Average Precipitation Daily High Daily Low Jan Feb Mar Apr May Jun AugJul Sep Oct Nov Dec Jan Feb Mar Apr May Jun AugJul Sep Oct Nov Dec 110 100 90 80 70 60 50 40 30 20 10 0 65 Precipitation(inches)Temperature(degF) 60 55 50 45 40 35 30 25 20 15 10 5 0 Modeling Weather vs. Modeling Climate Meteorologist’s weather predictions are sometimes incorrect, so how can climate scientist predict climate years from now? Weather and climate models are used to predict future conditions. The models are created using the same physical laws of motion and energy, but they are applied over different time and space scales. A weather model responds to changing initial conditions, or weather observations taken around the world (at least twice daily), and must excel at getting the details of fronts and storms correct for the next week, but it is not designed to model the long-term state of the atmosphere. A climate model needs to predict expected patterns of temperature and rainfall over wide areas but it is not focused on the effects of individual storms. Climate models are more sensitive to changes in forcing, like sea surface temperatures, land and ice surfaces, and greenhouse gas concentrations, rather than initial conditions. Both weather and climate models have improved greatly over time, and each type performs well at the task for which it was designed; neither model is good at tasks for which it was not created.
  • 3.
    3IS IT WEATHEROR IS IT CLIMATE? WHAT’S THE DIFFERENCE? Visit www.extension.org/60702 for more information and a full list of available resources. Uses physical equations of motion energy Yes Yes Grid size Very small, on the order of miles. Large, on the order of 100 miles. Time step Very short, on the order of minutes. At most a few per day. Length of run Most models up to 72 hours; longer range models up to 15 days. Models run for up to 100 years after an initial stabilization period. Assumptions Climatic factors like atmospheric composition, incoming solar radiation are held constant; precipitation processes parameterized because they happen on sub-grid scale. Precipitation processes parameterized due to large grid spacing, oceans are usually simplified or held constant although new models include interactive oceans. Number of models used Approximately ten well-documented ones. Approximately 100 models with different assumptions. Strengths Can provide detailed, small-scale descriptions of a specific weather event for up to five days ahead (no skill for more than 10 days). Can provide realstic representations of average weather conditions across the globe on long time scales. Weaknesses Do not provide good climatological simulations when run for long time periods due to design for getting short-term correct which magnifies errors over time. Do not predict individual storms well due to grid and time spacing; simplify spatial patterns in mountains and along coasts where spatial detail is high; tend to drift over time; do not always capture current climate well. Weather Map Climate Trend Graph Weather Model Climate Model
  • 4.
    4 IS ITWEATHER OR IS IT CLIMATE? WHAT’S THE DIFFERENCE? Visit www.extension.org/60702 for more information and a full list of available resources. Extension programs and employment are available to all without discrimination. Evidence of noncompliance may be reported through your local Extension office. ThisprojectwassupportedbyAgriculturalandFoodResearch Initiative Competitive Grant No. 2011-67003-30206 from the USDA National Institute of Food and Agriculture. Participating Universities Cornell University Texas AM University University of Georgia University of Minnesota University of Nebraska–Lincoln Washington State University ANIMAL AGRICULTURE CHANGING CLIMATEIN A