Download to read offline

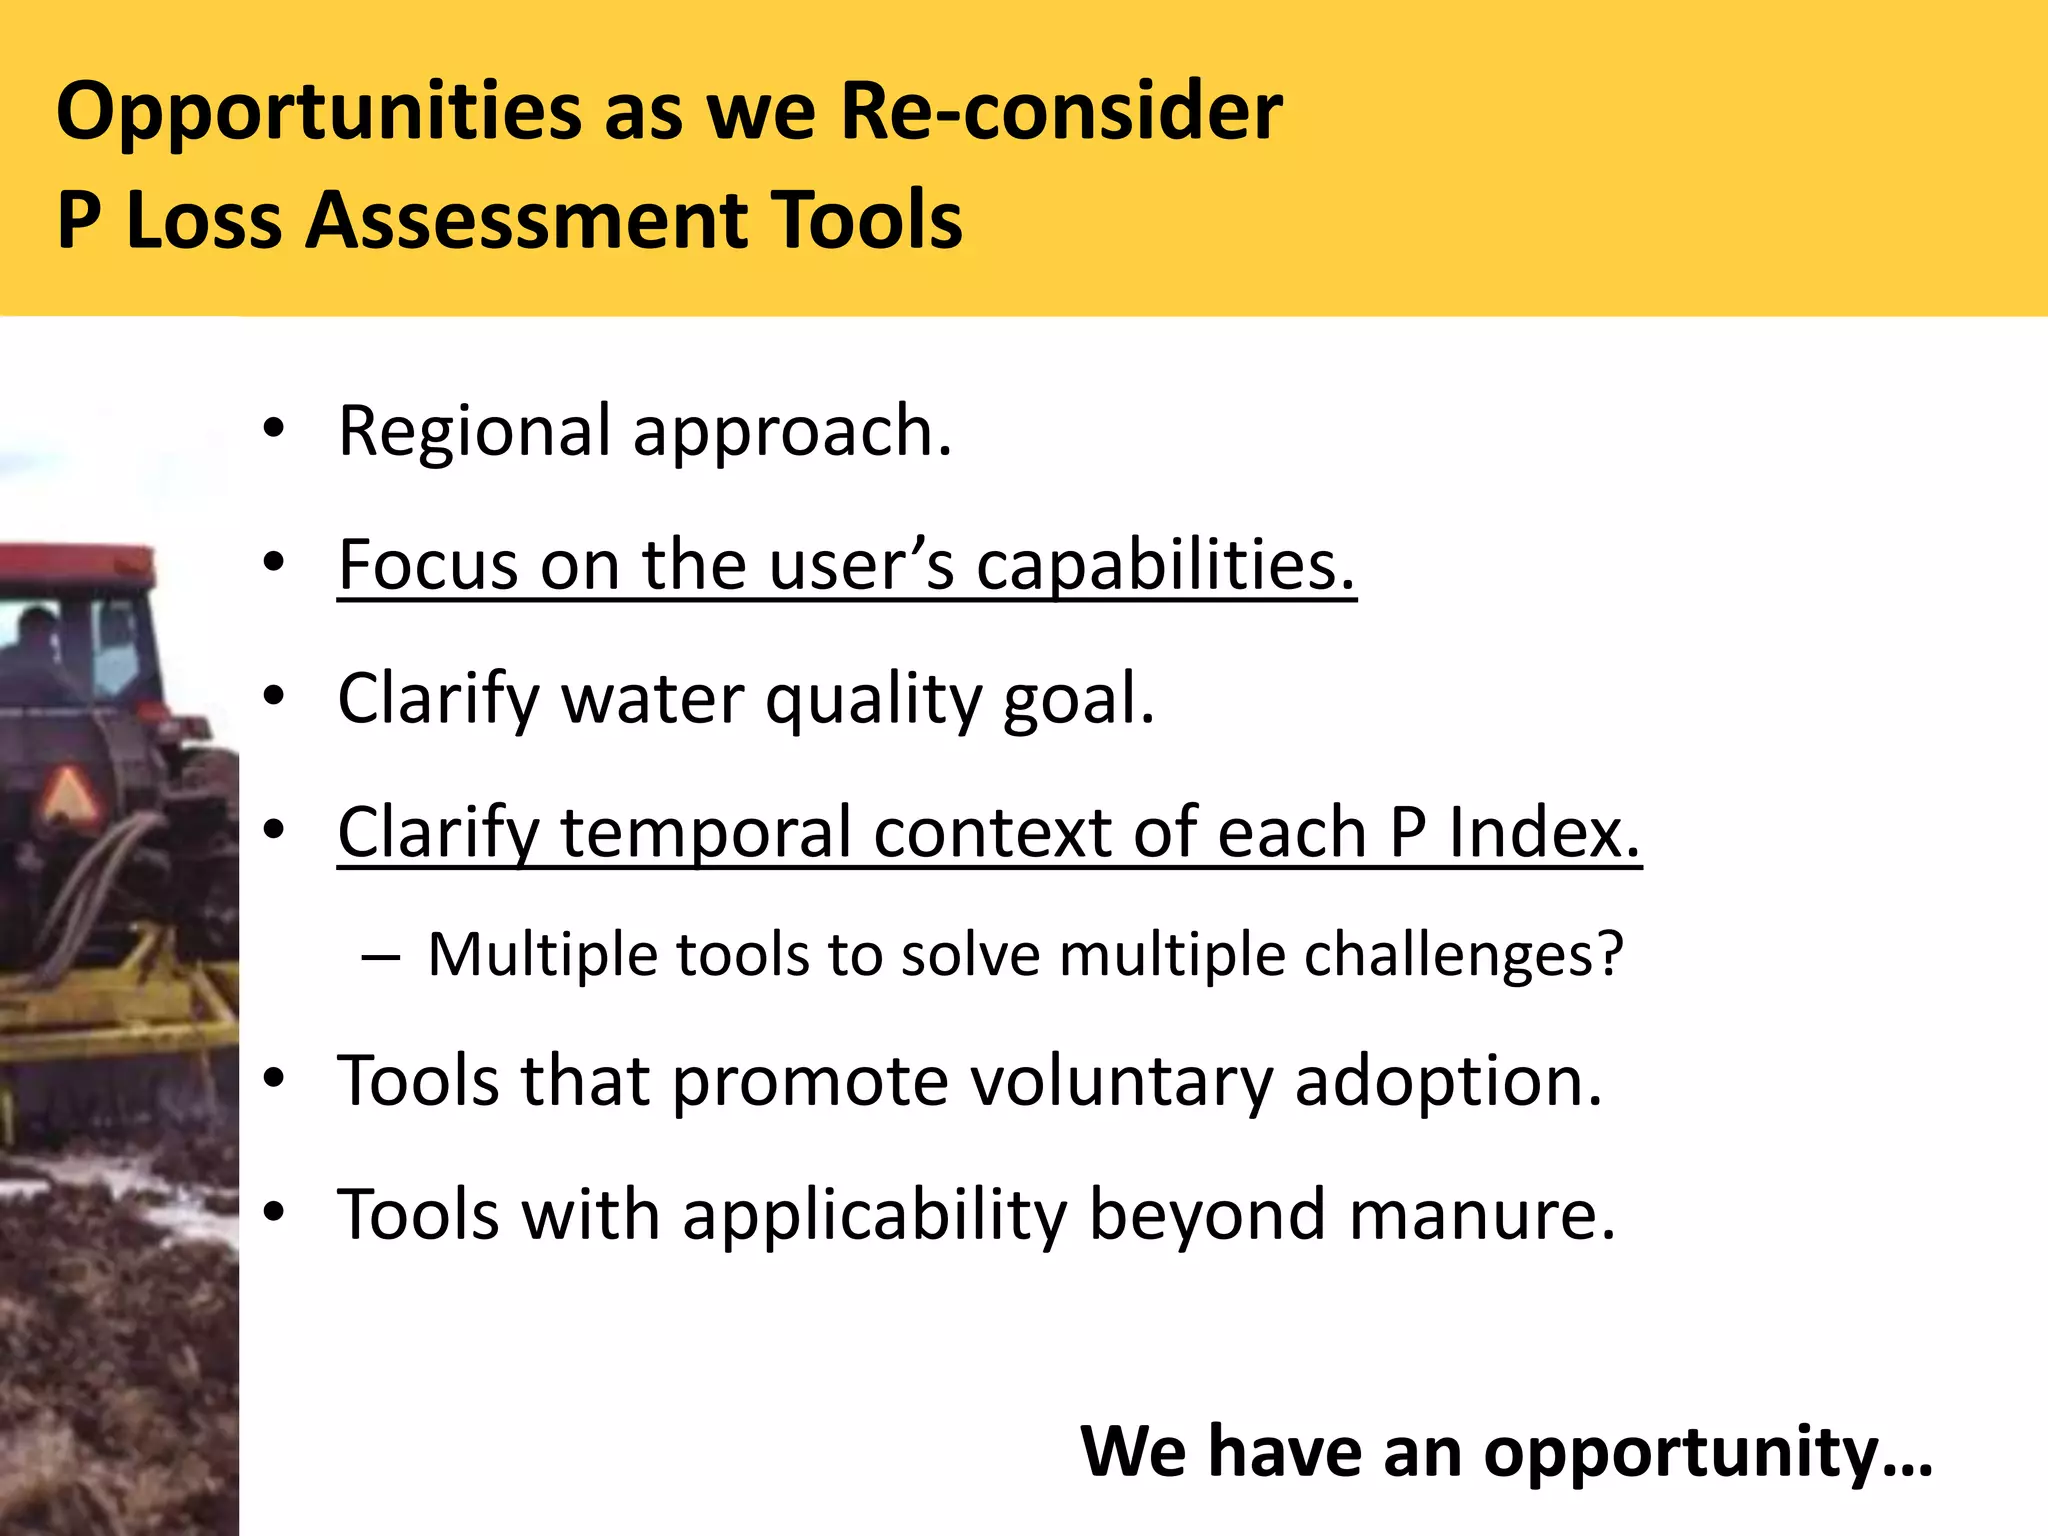
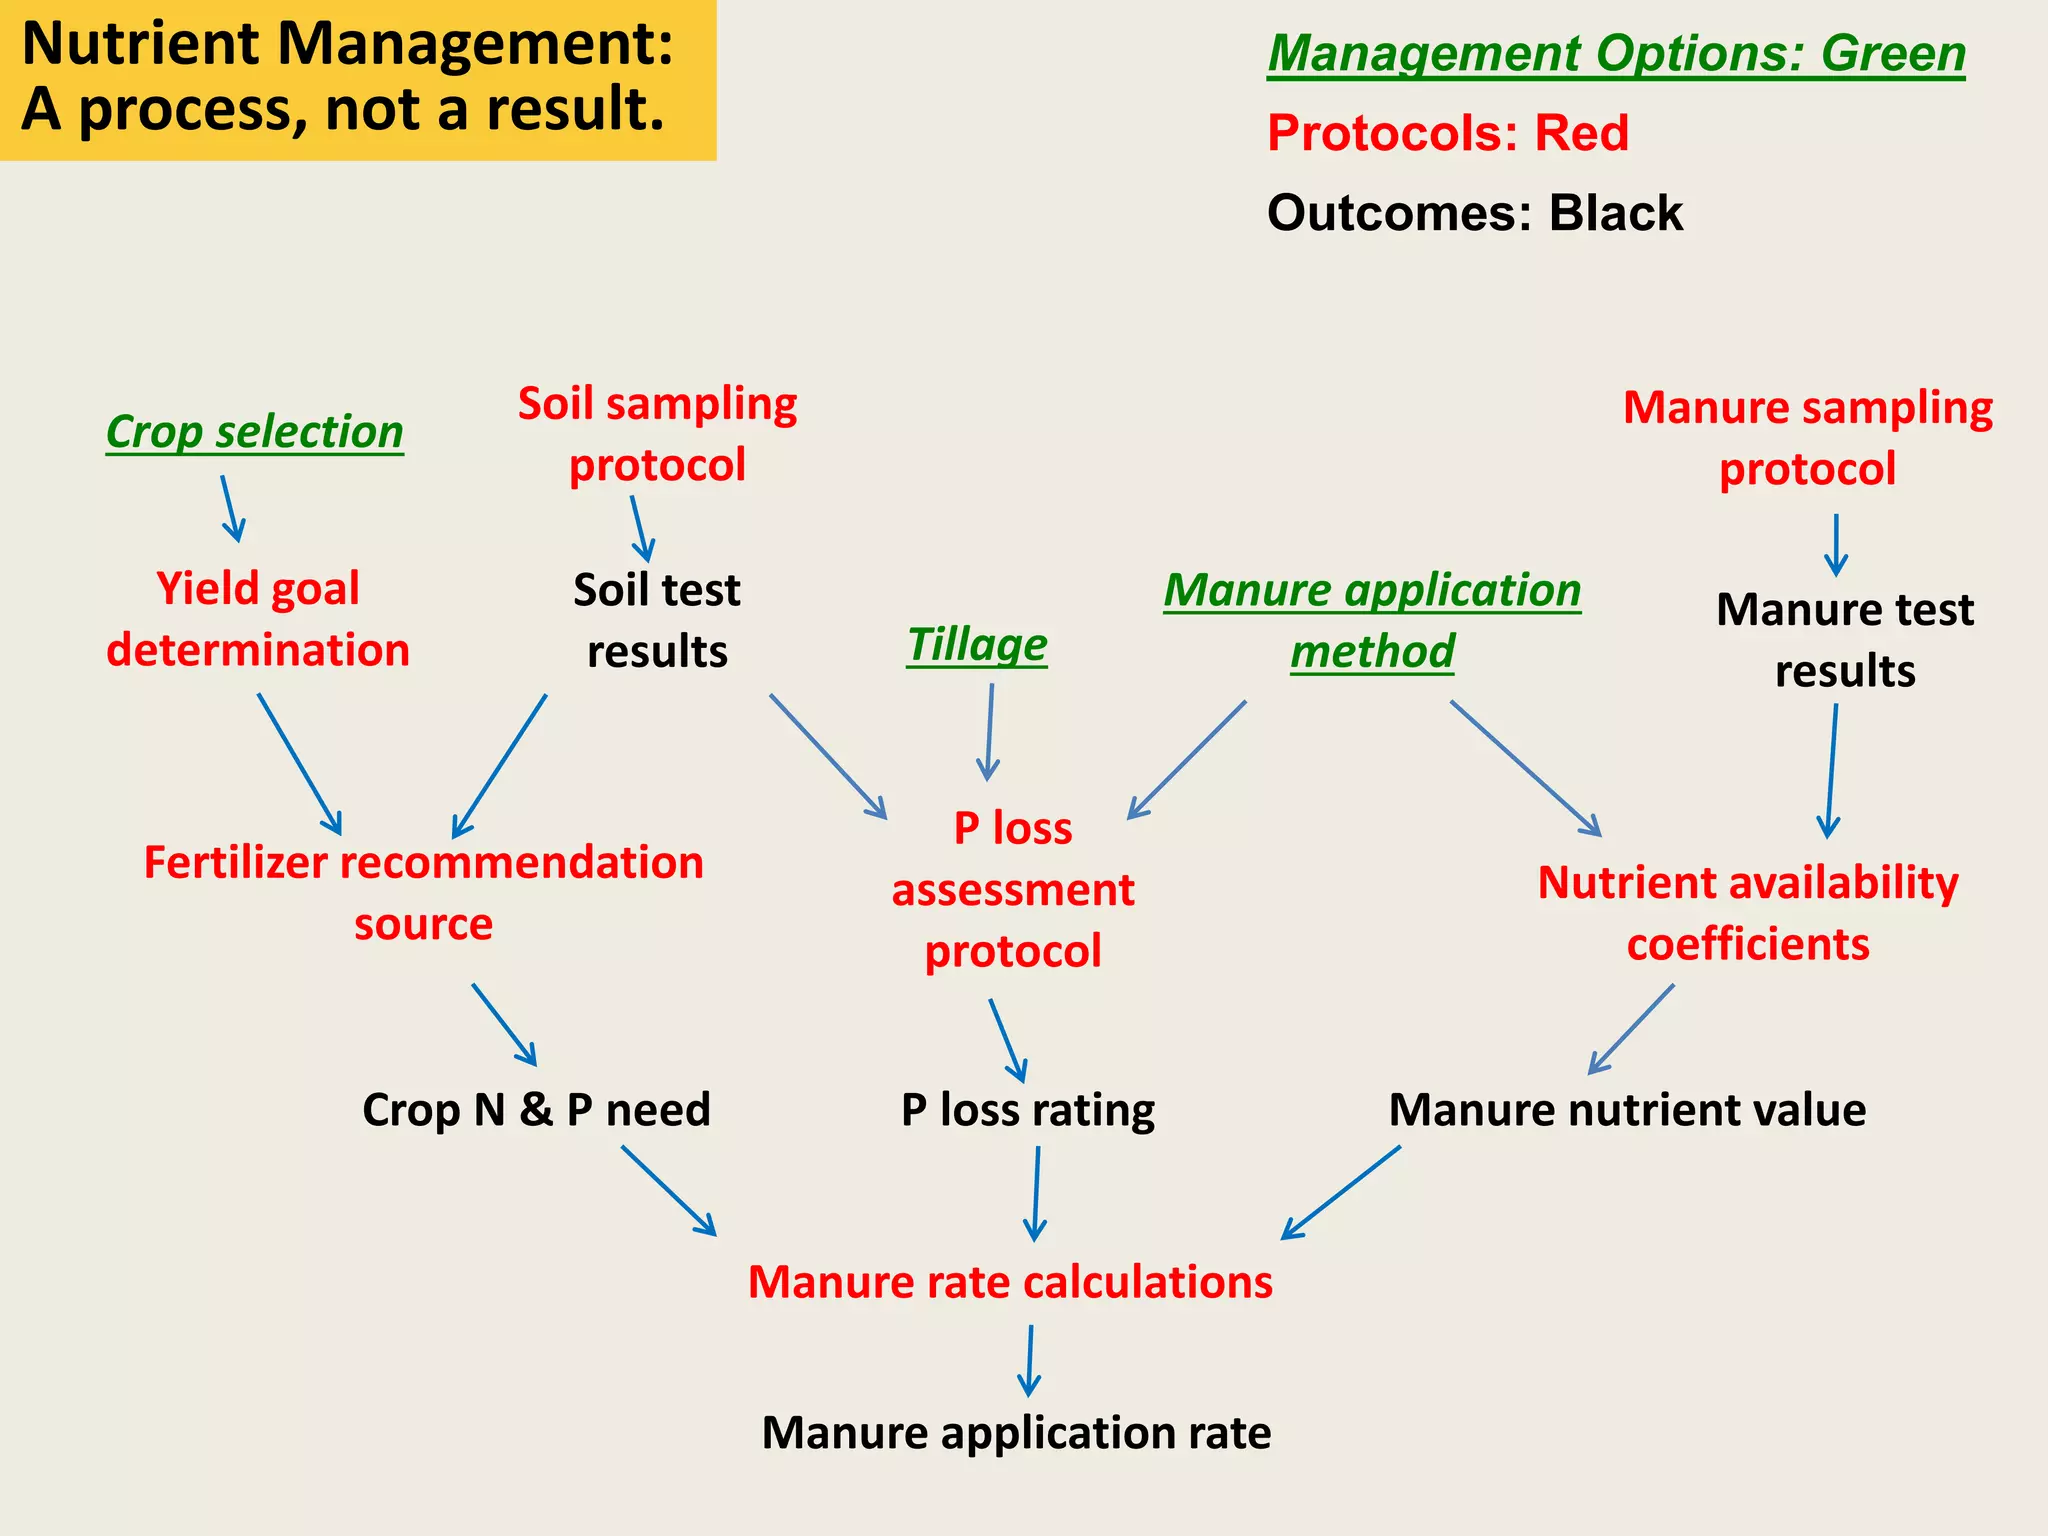
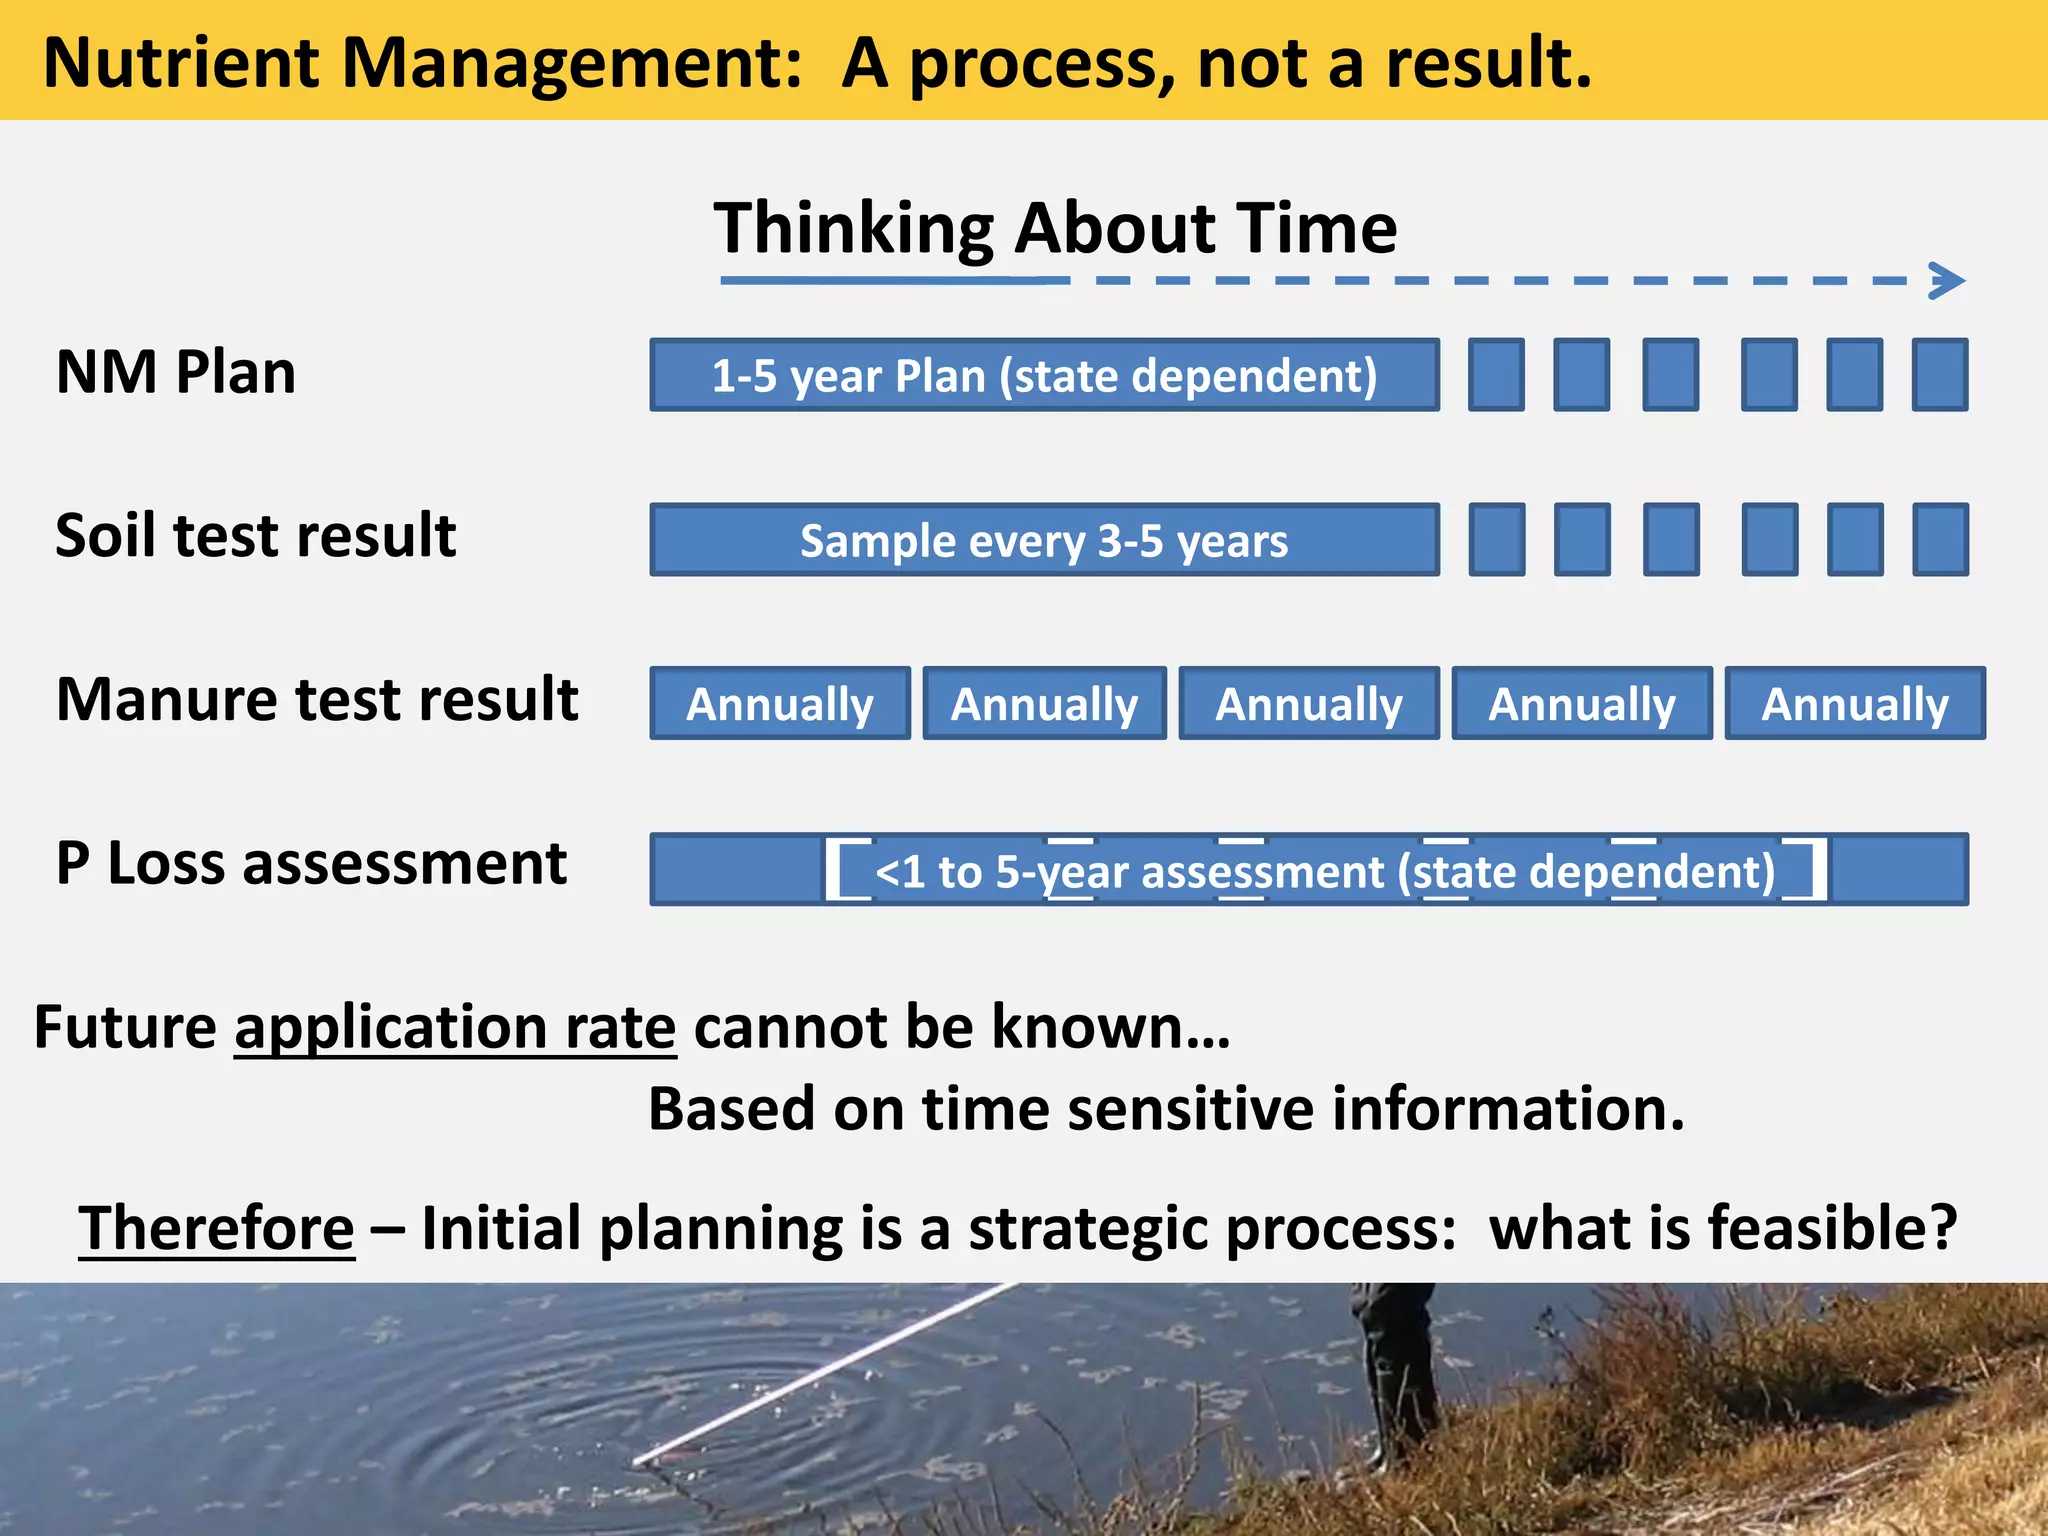
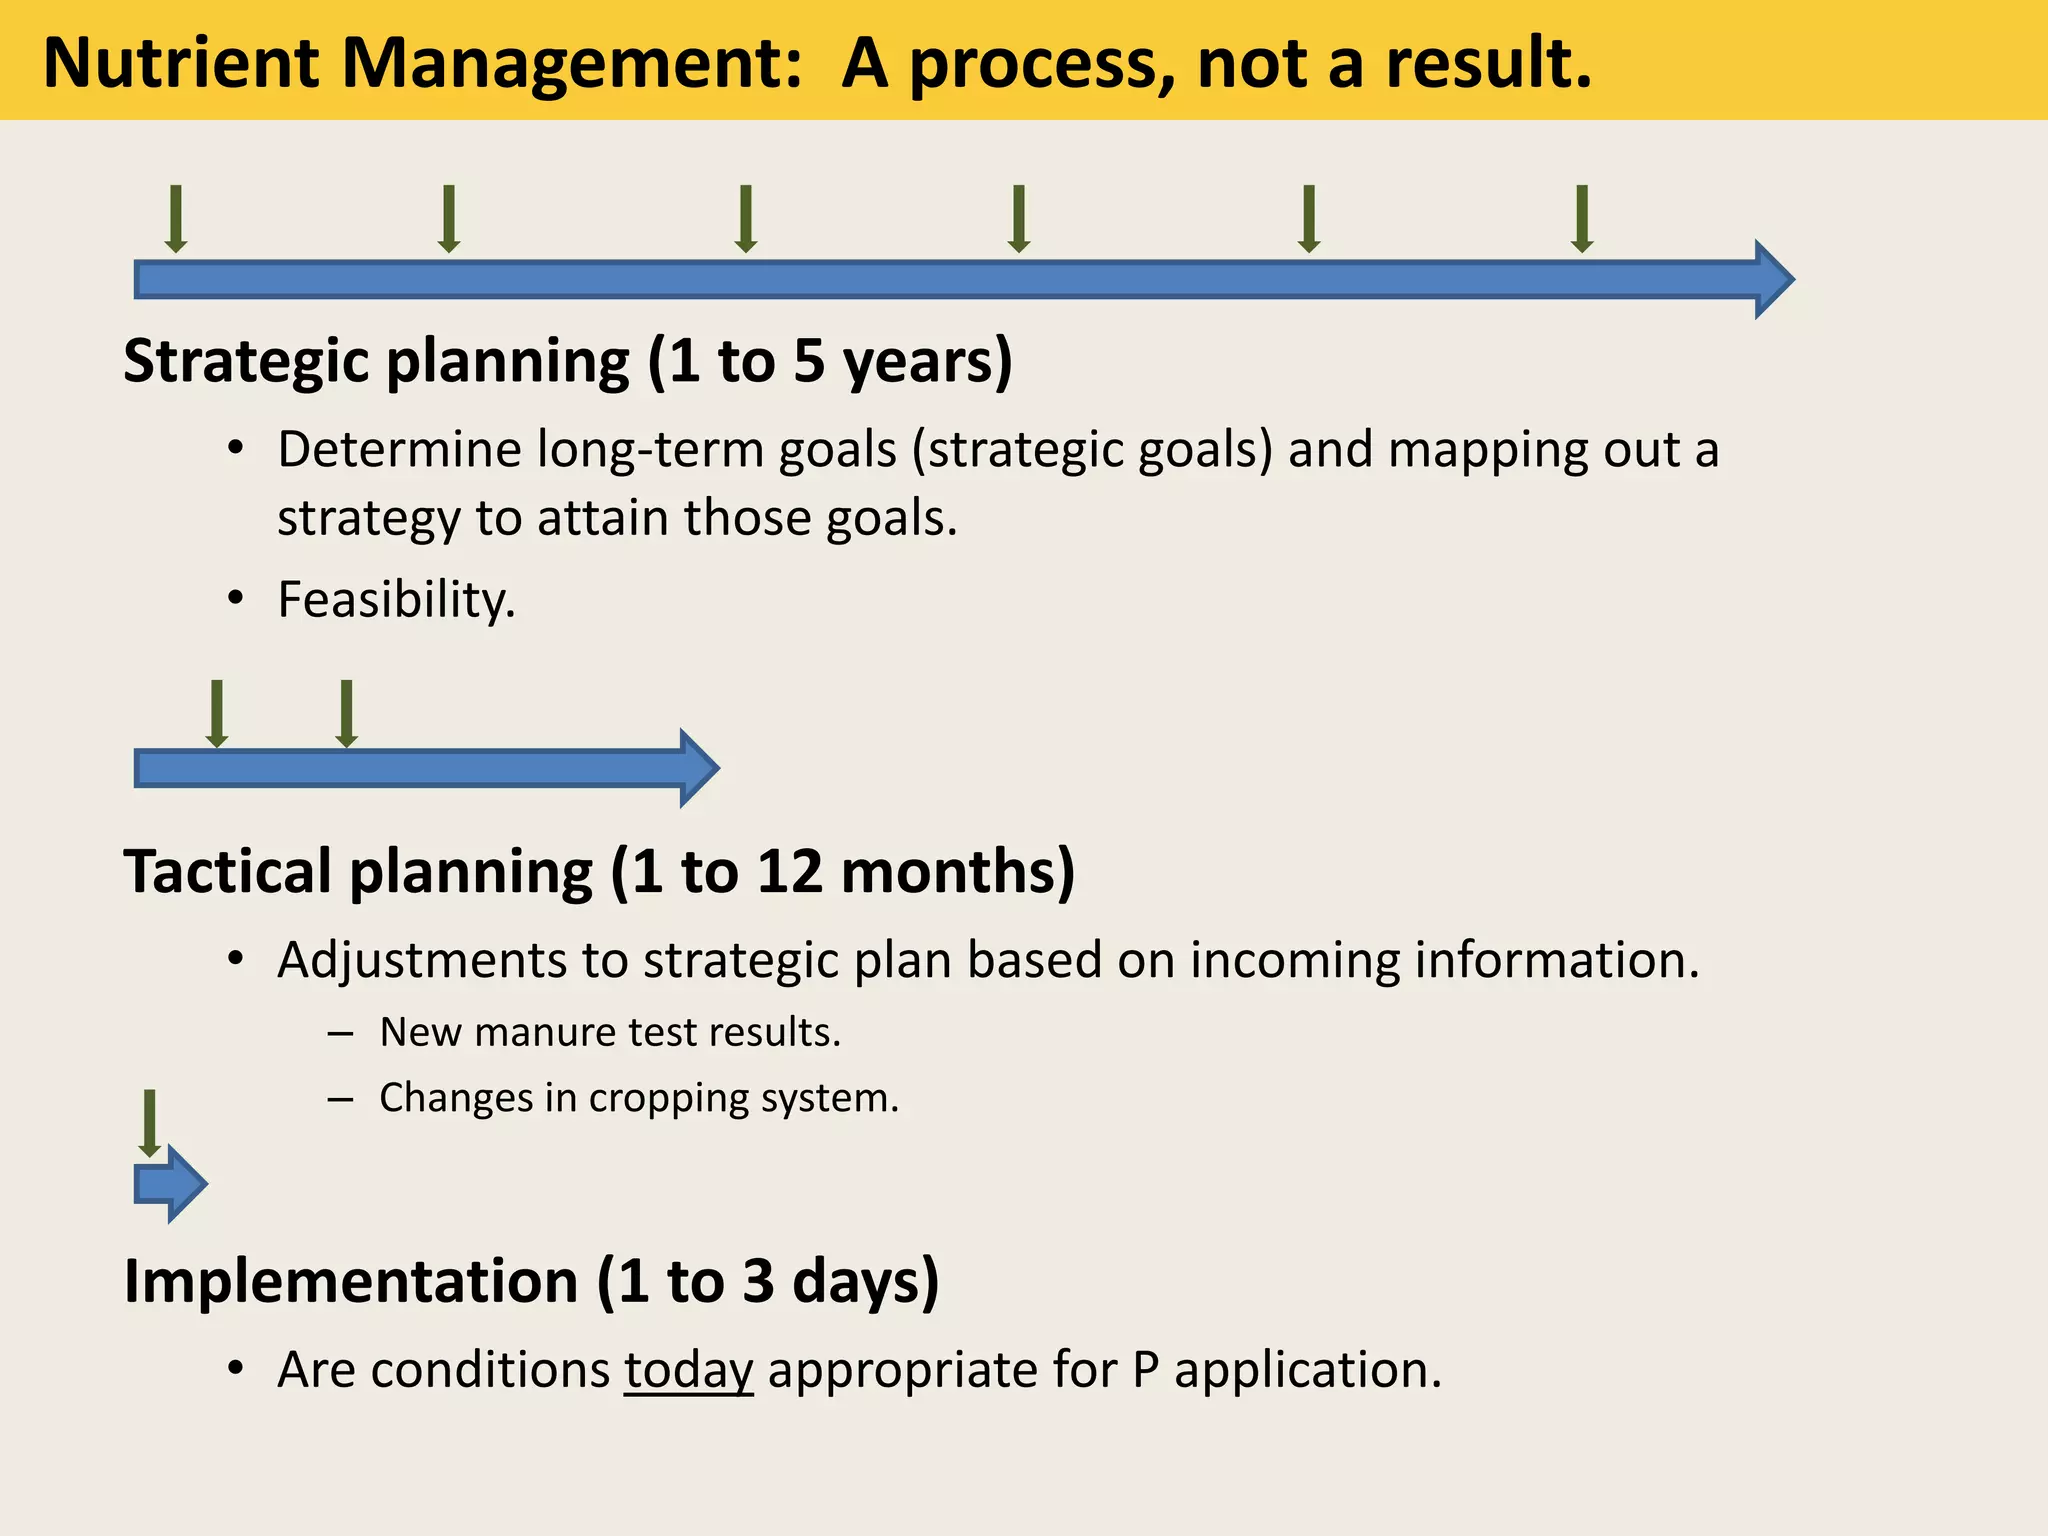
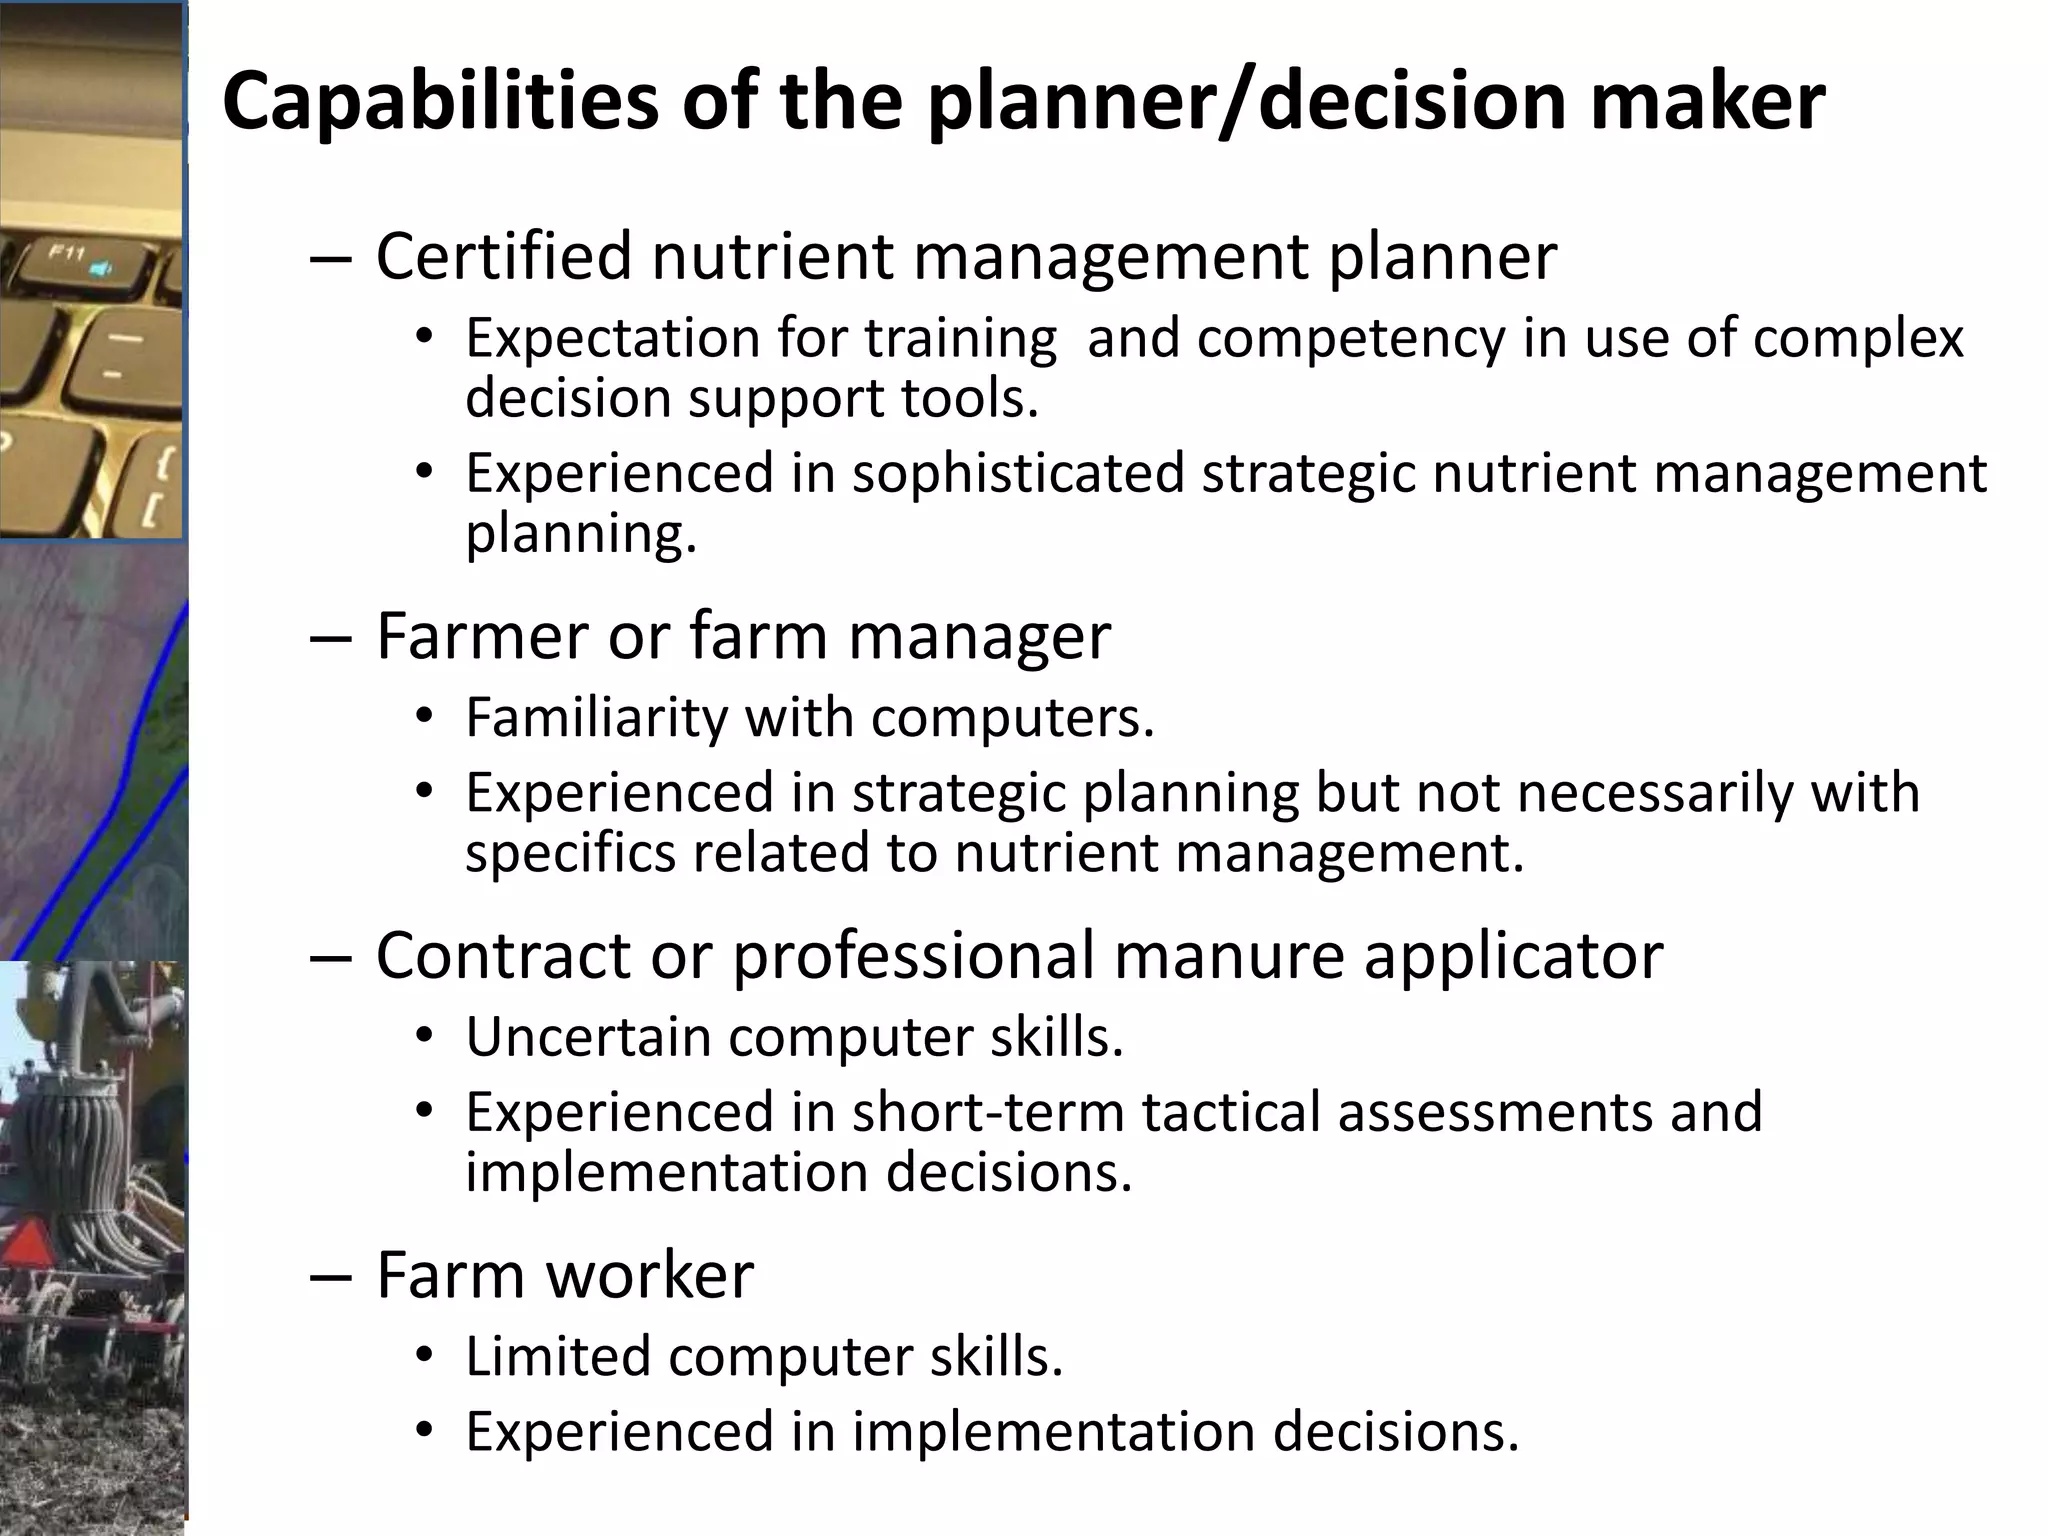
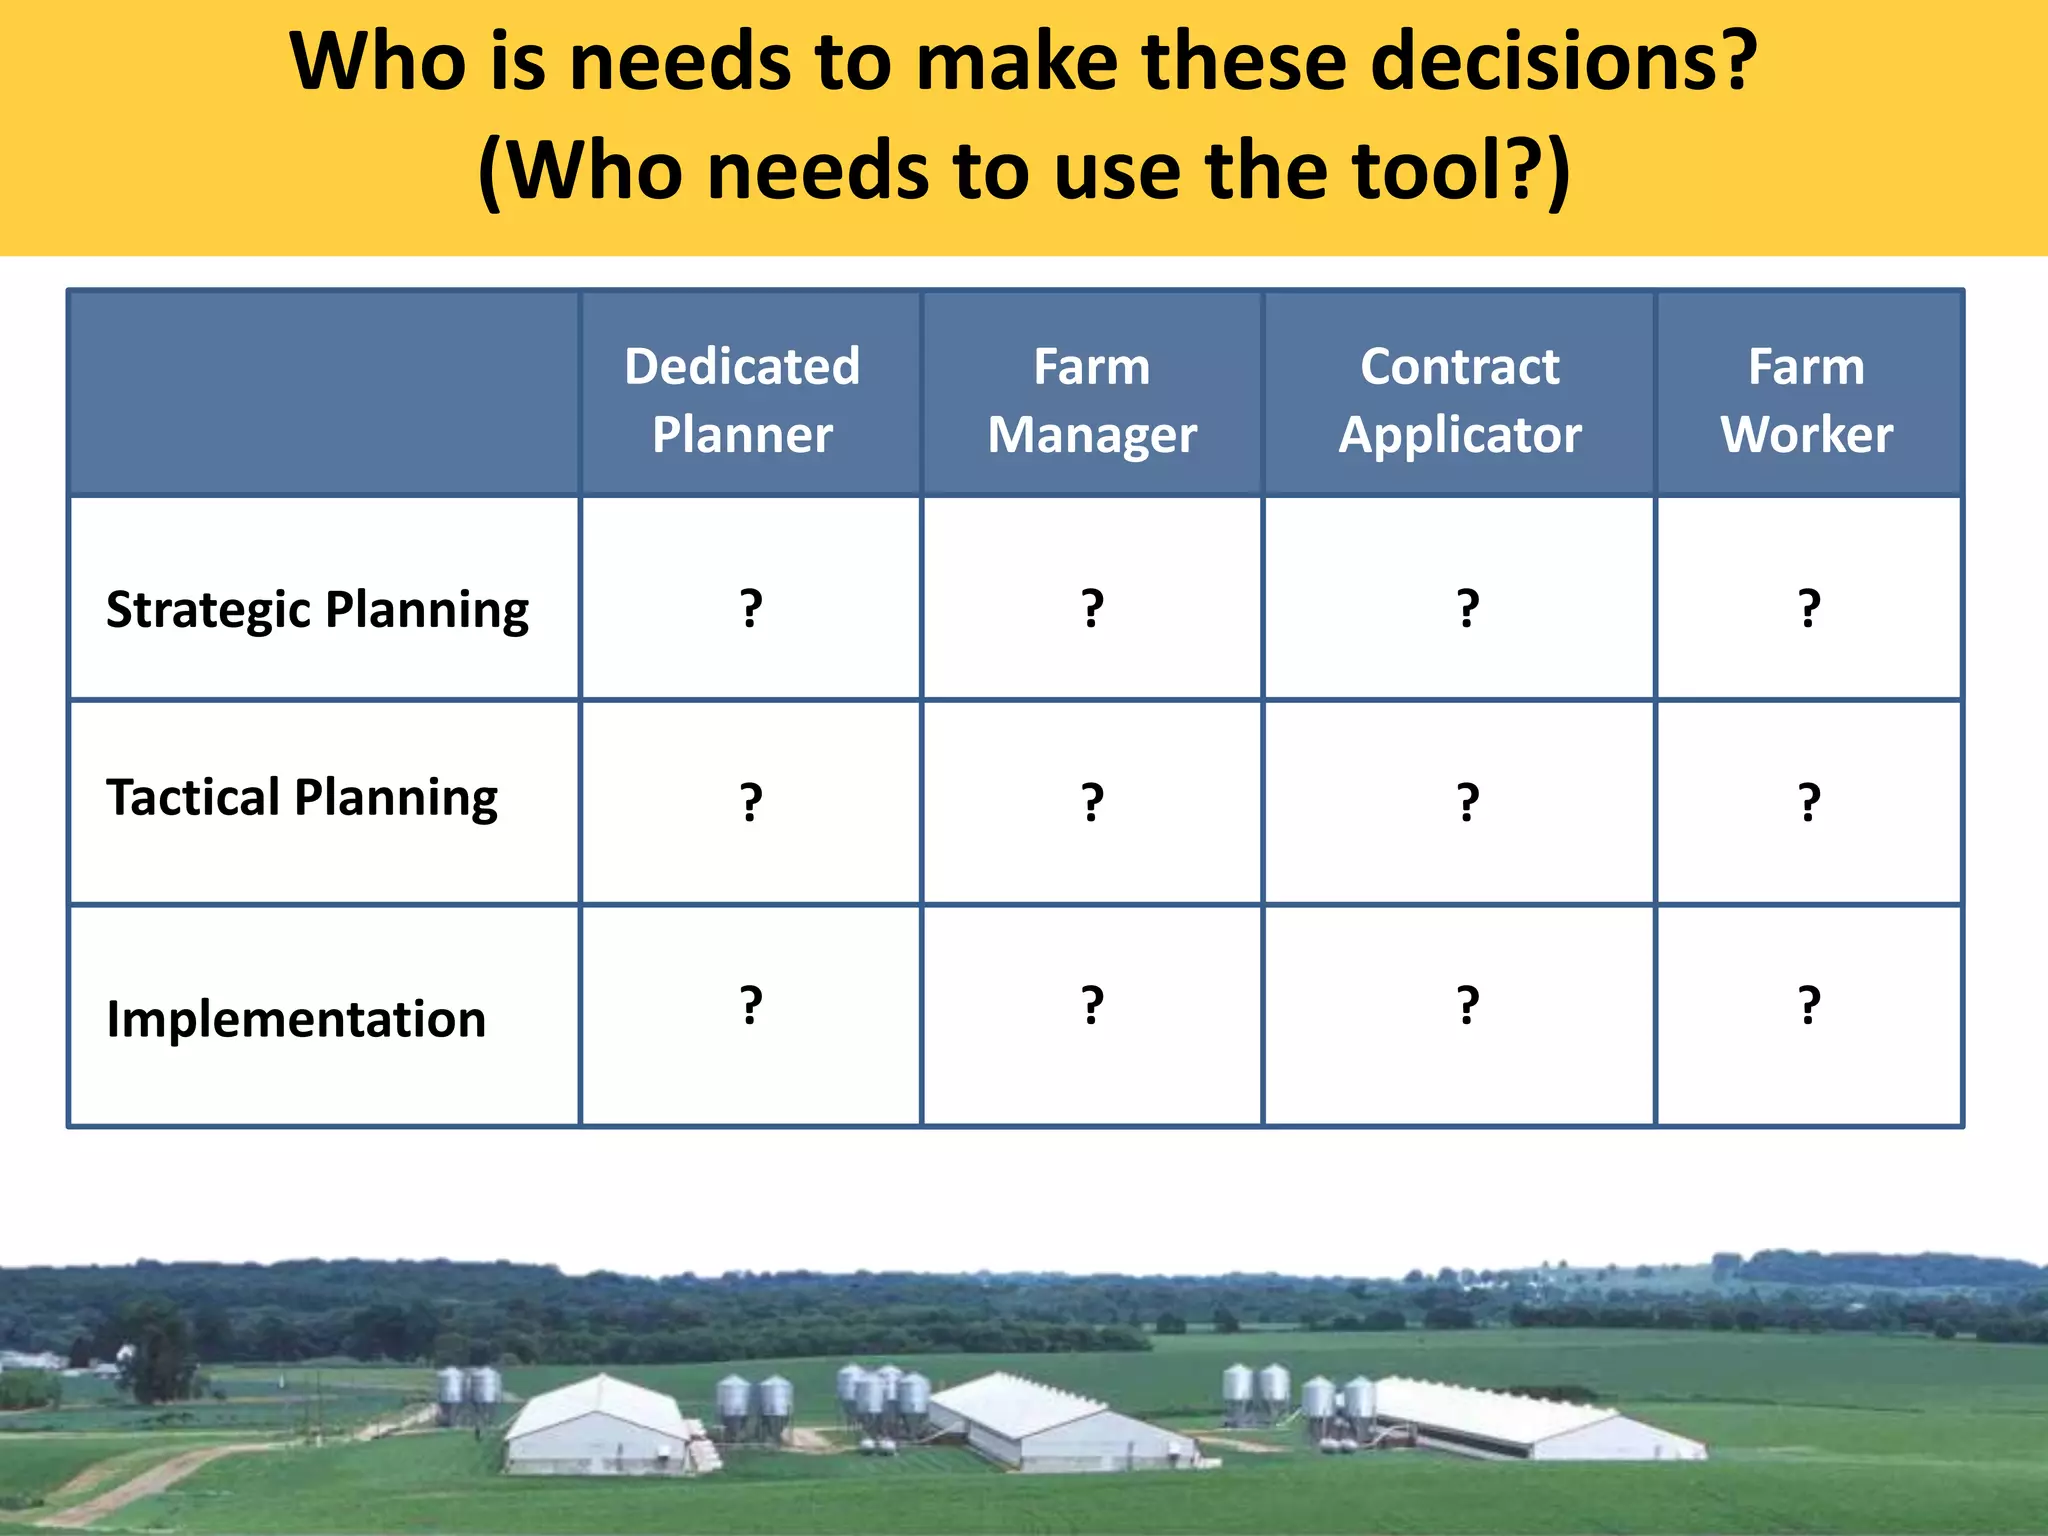
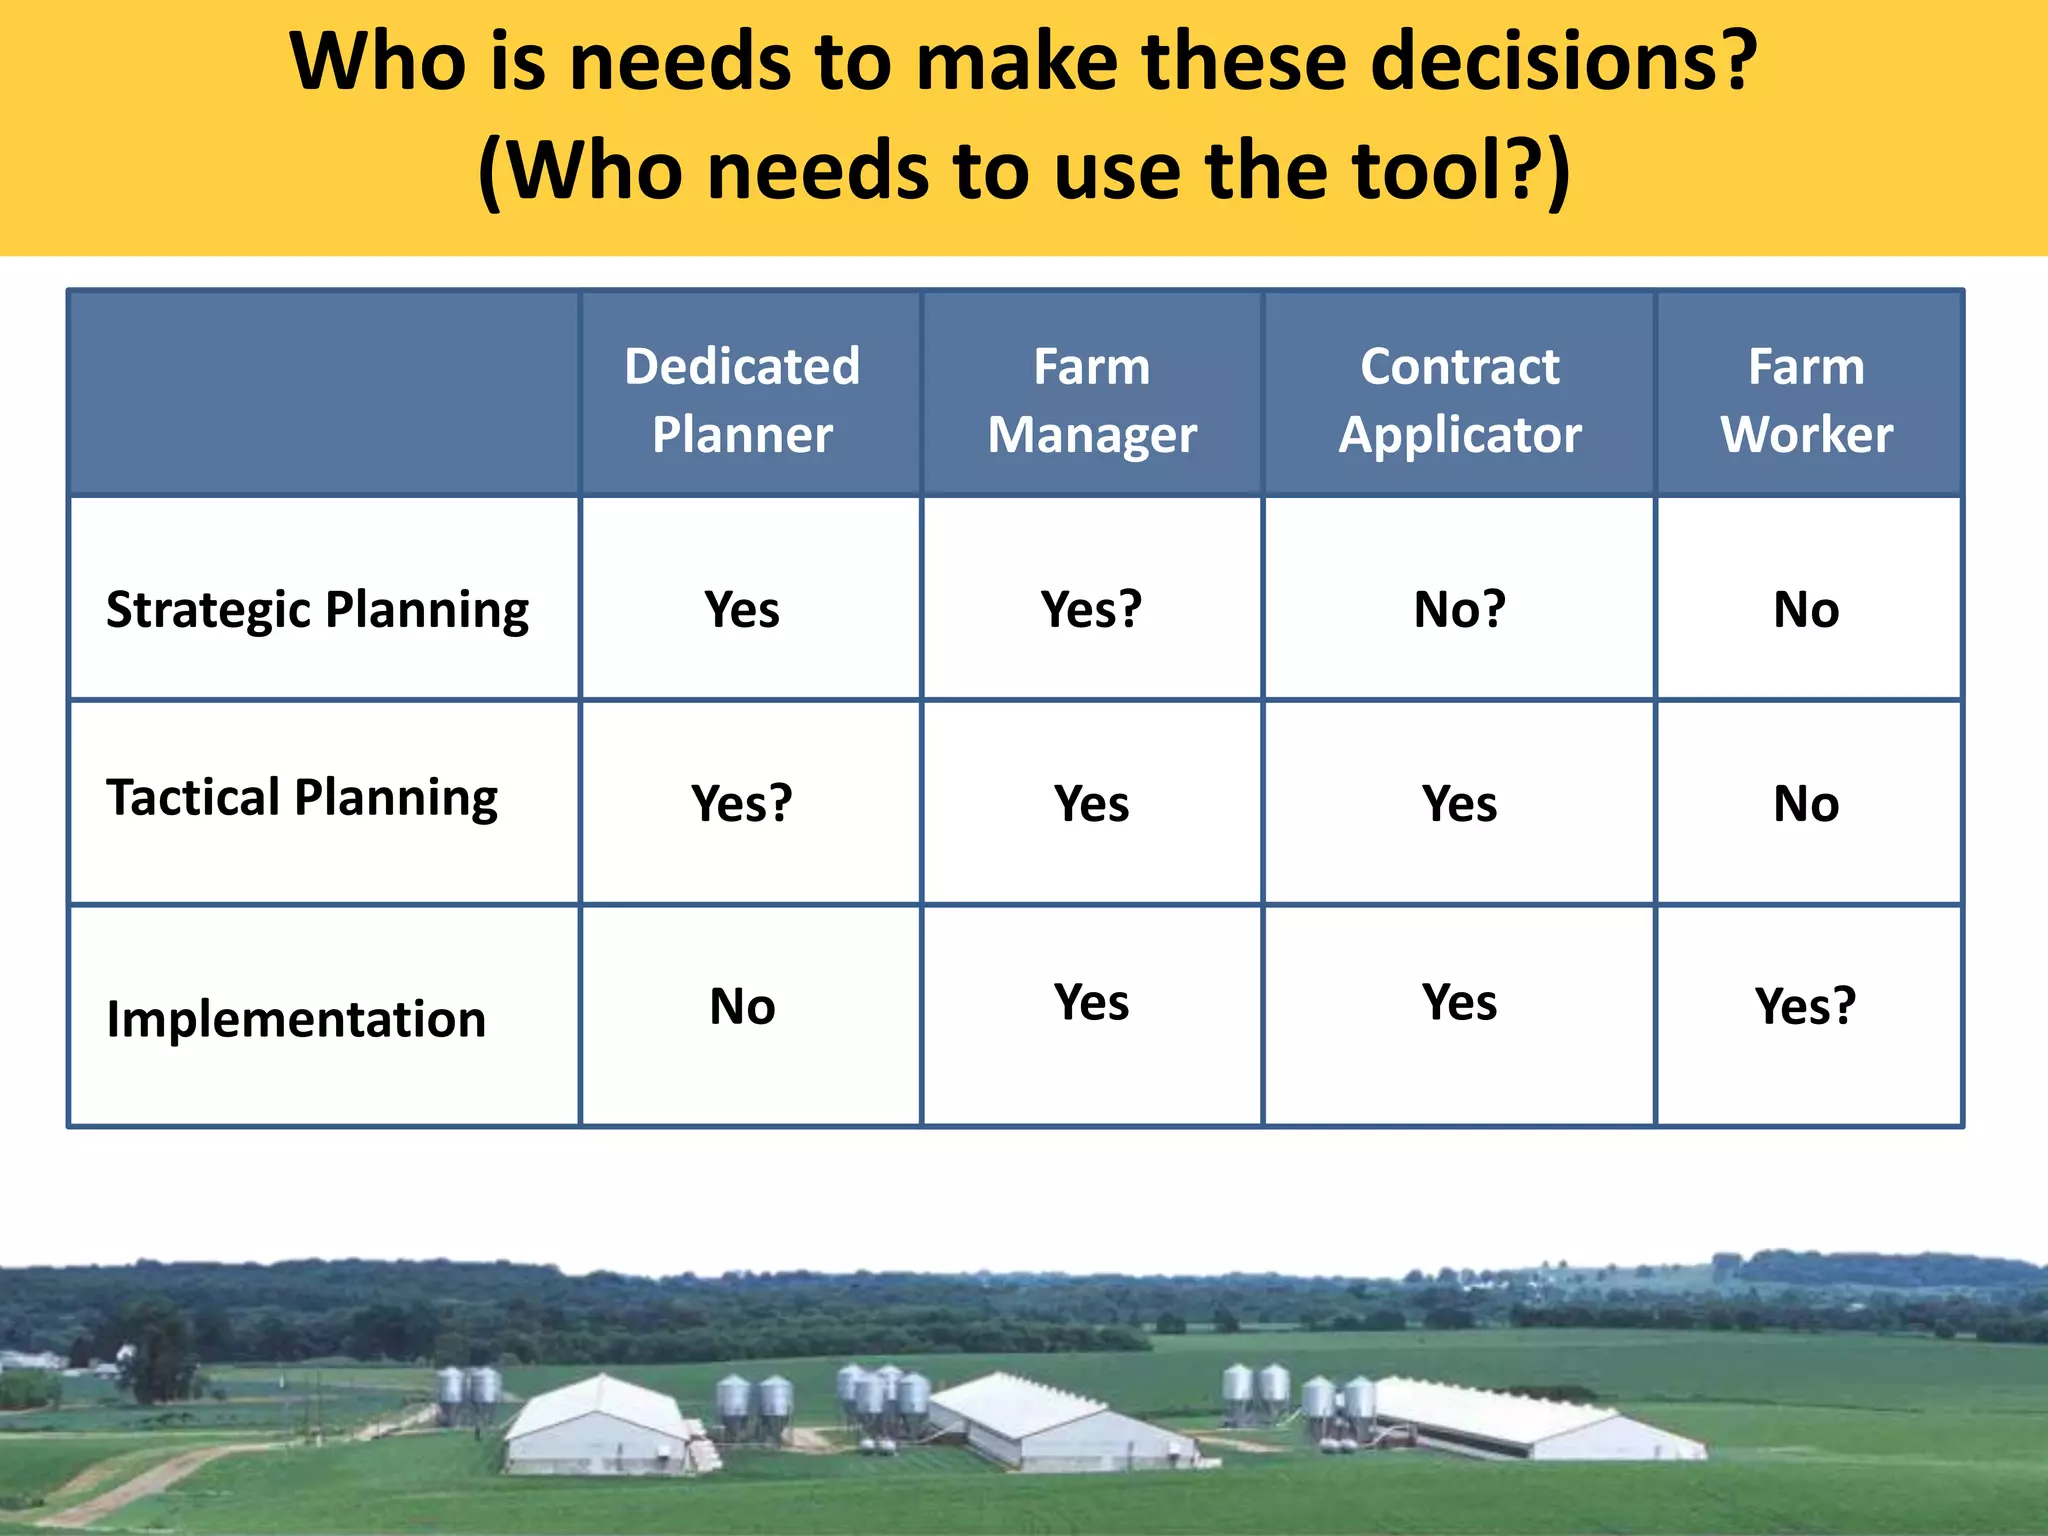
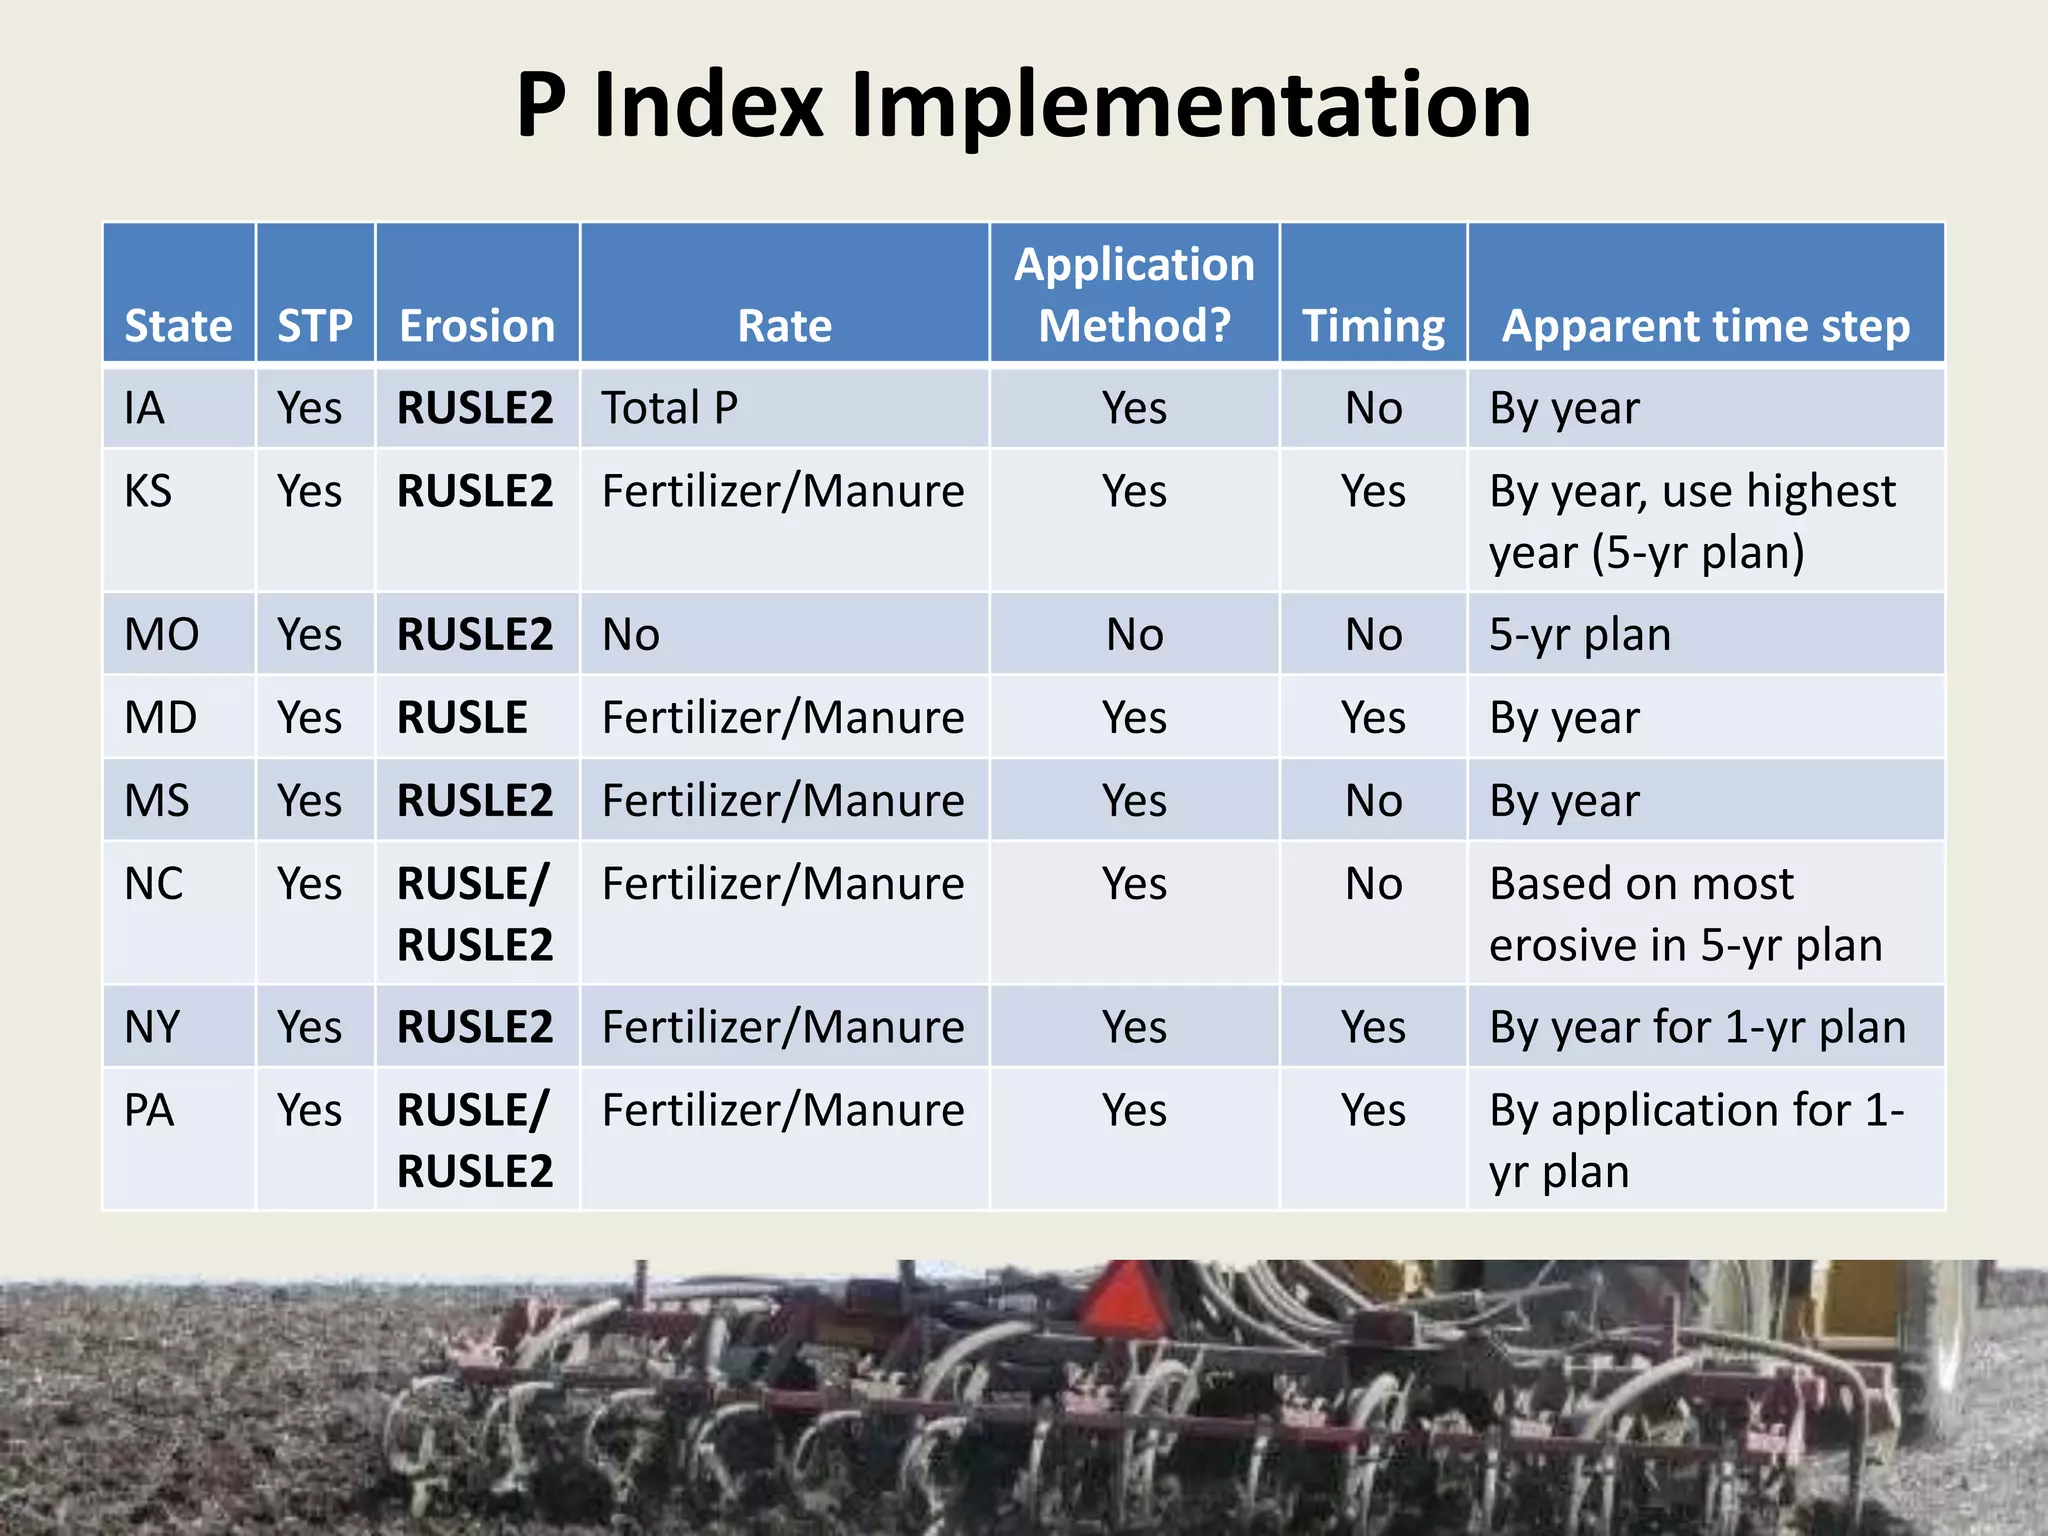
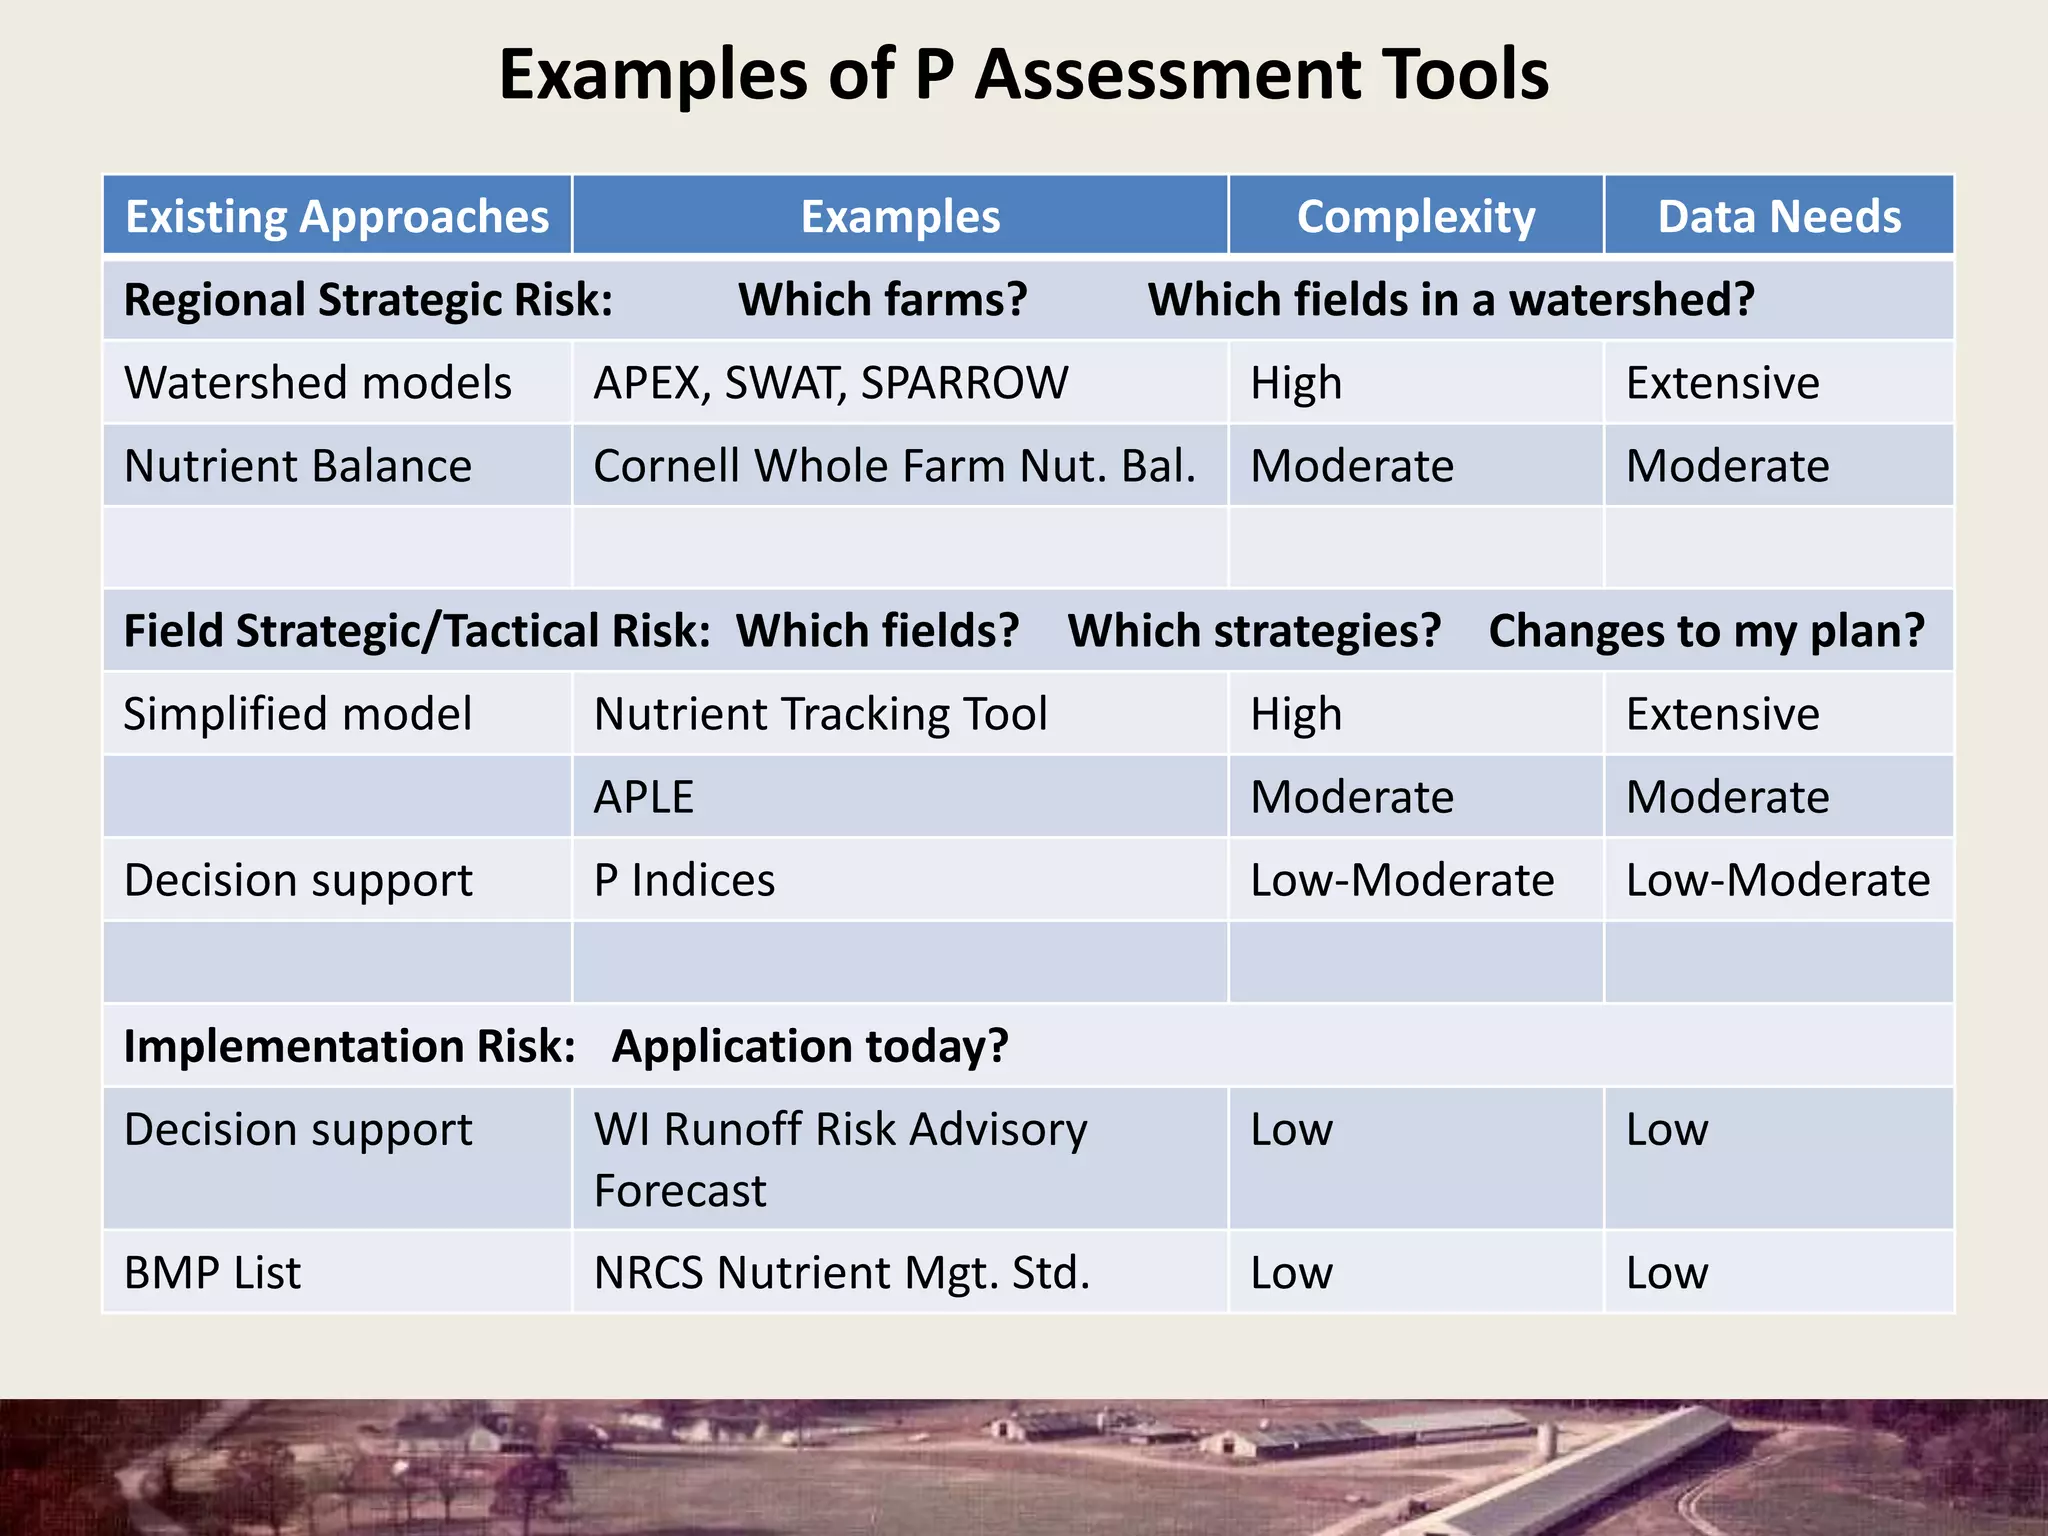
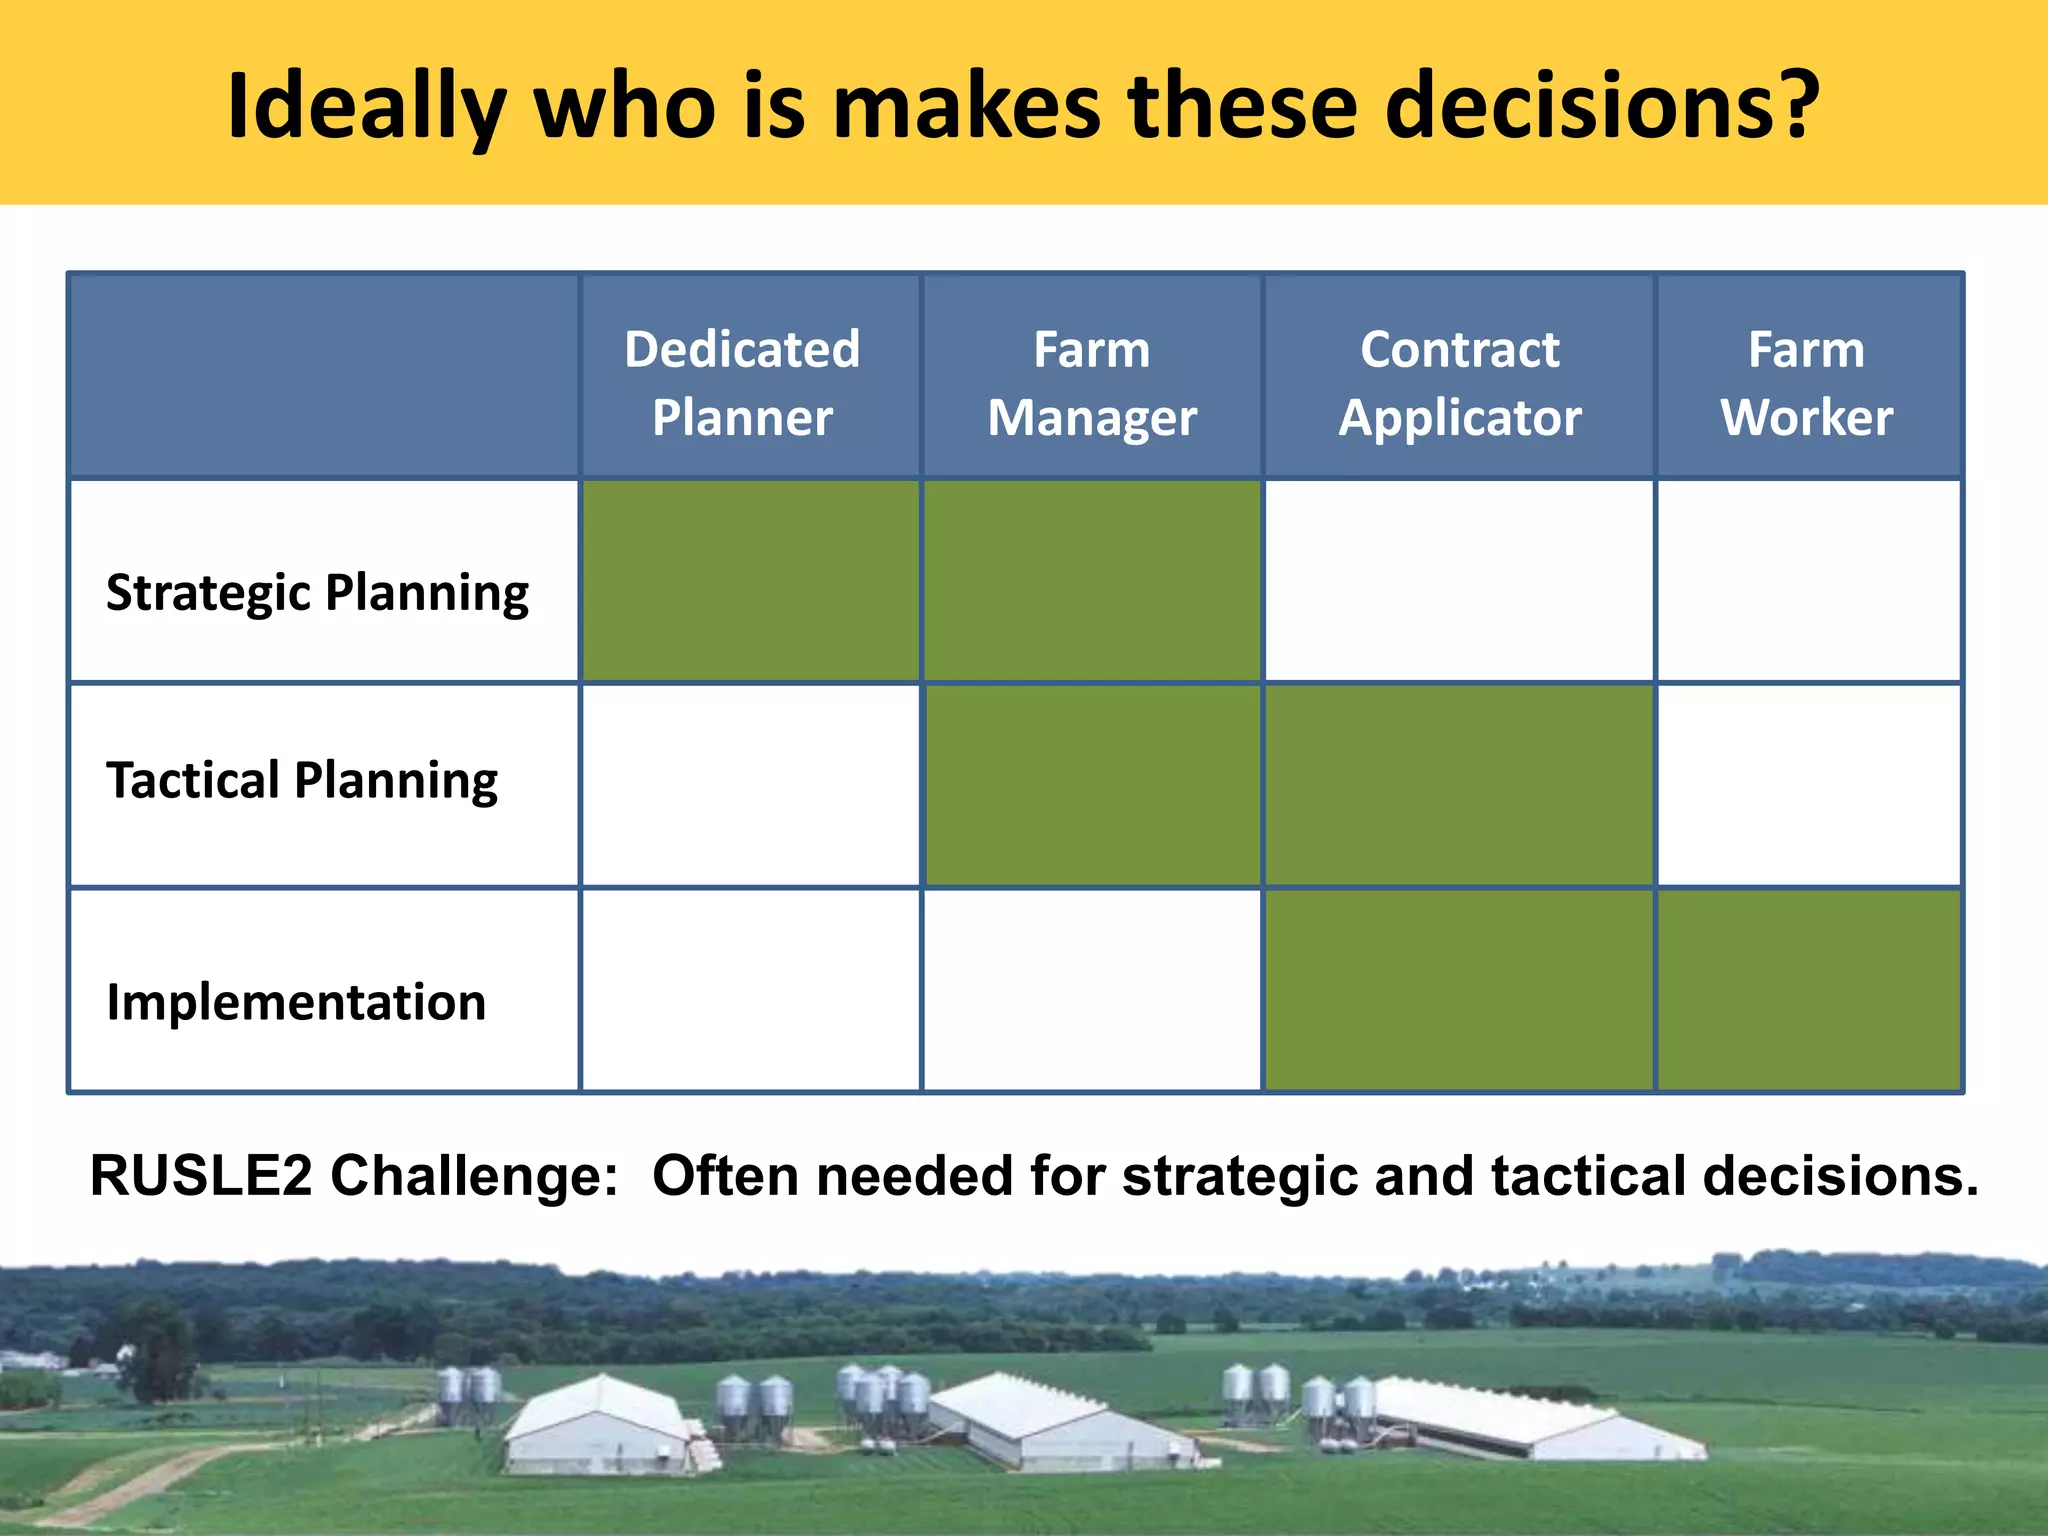
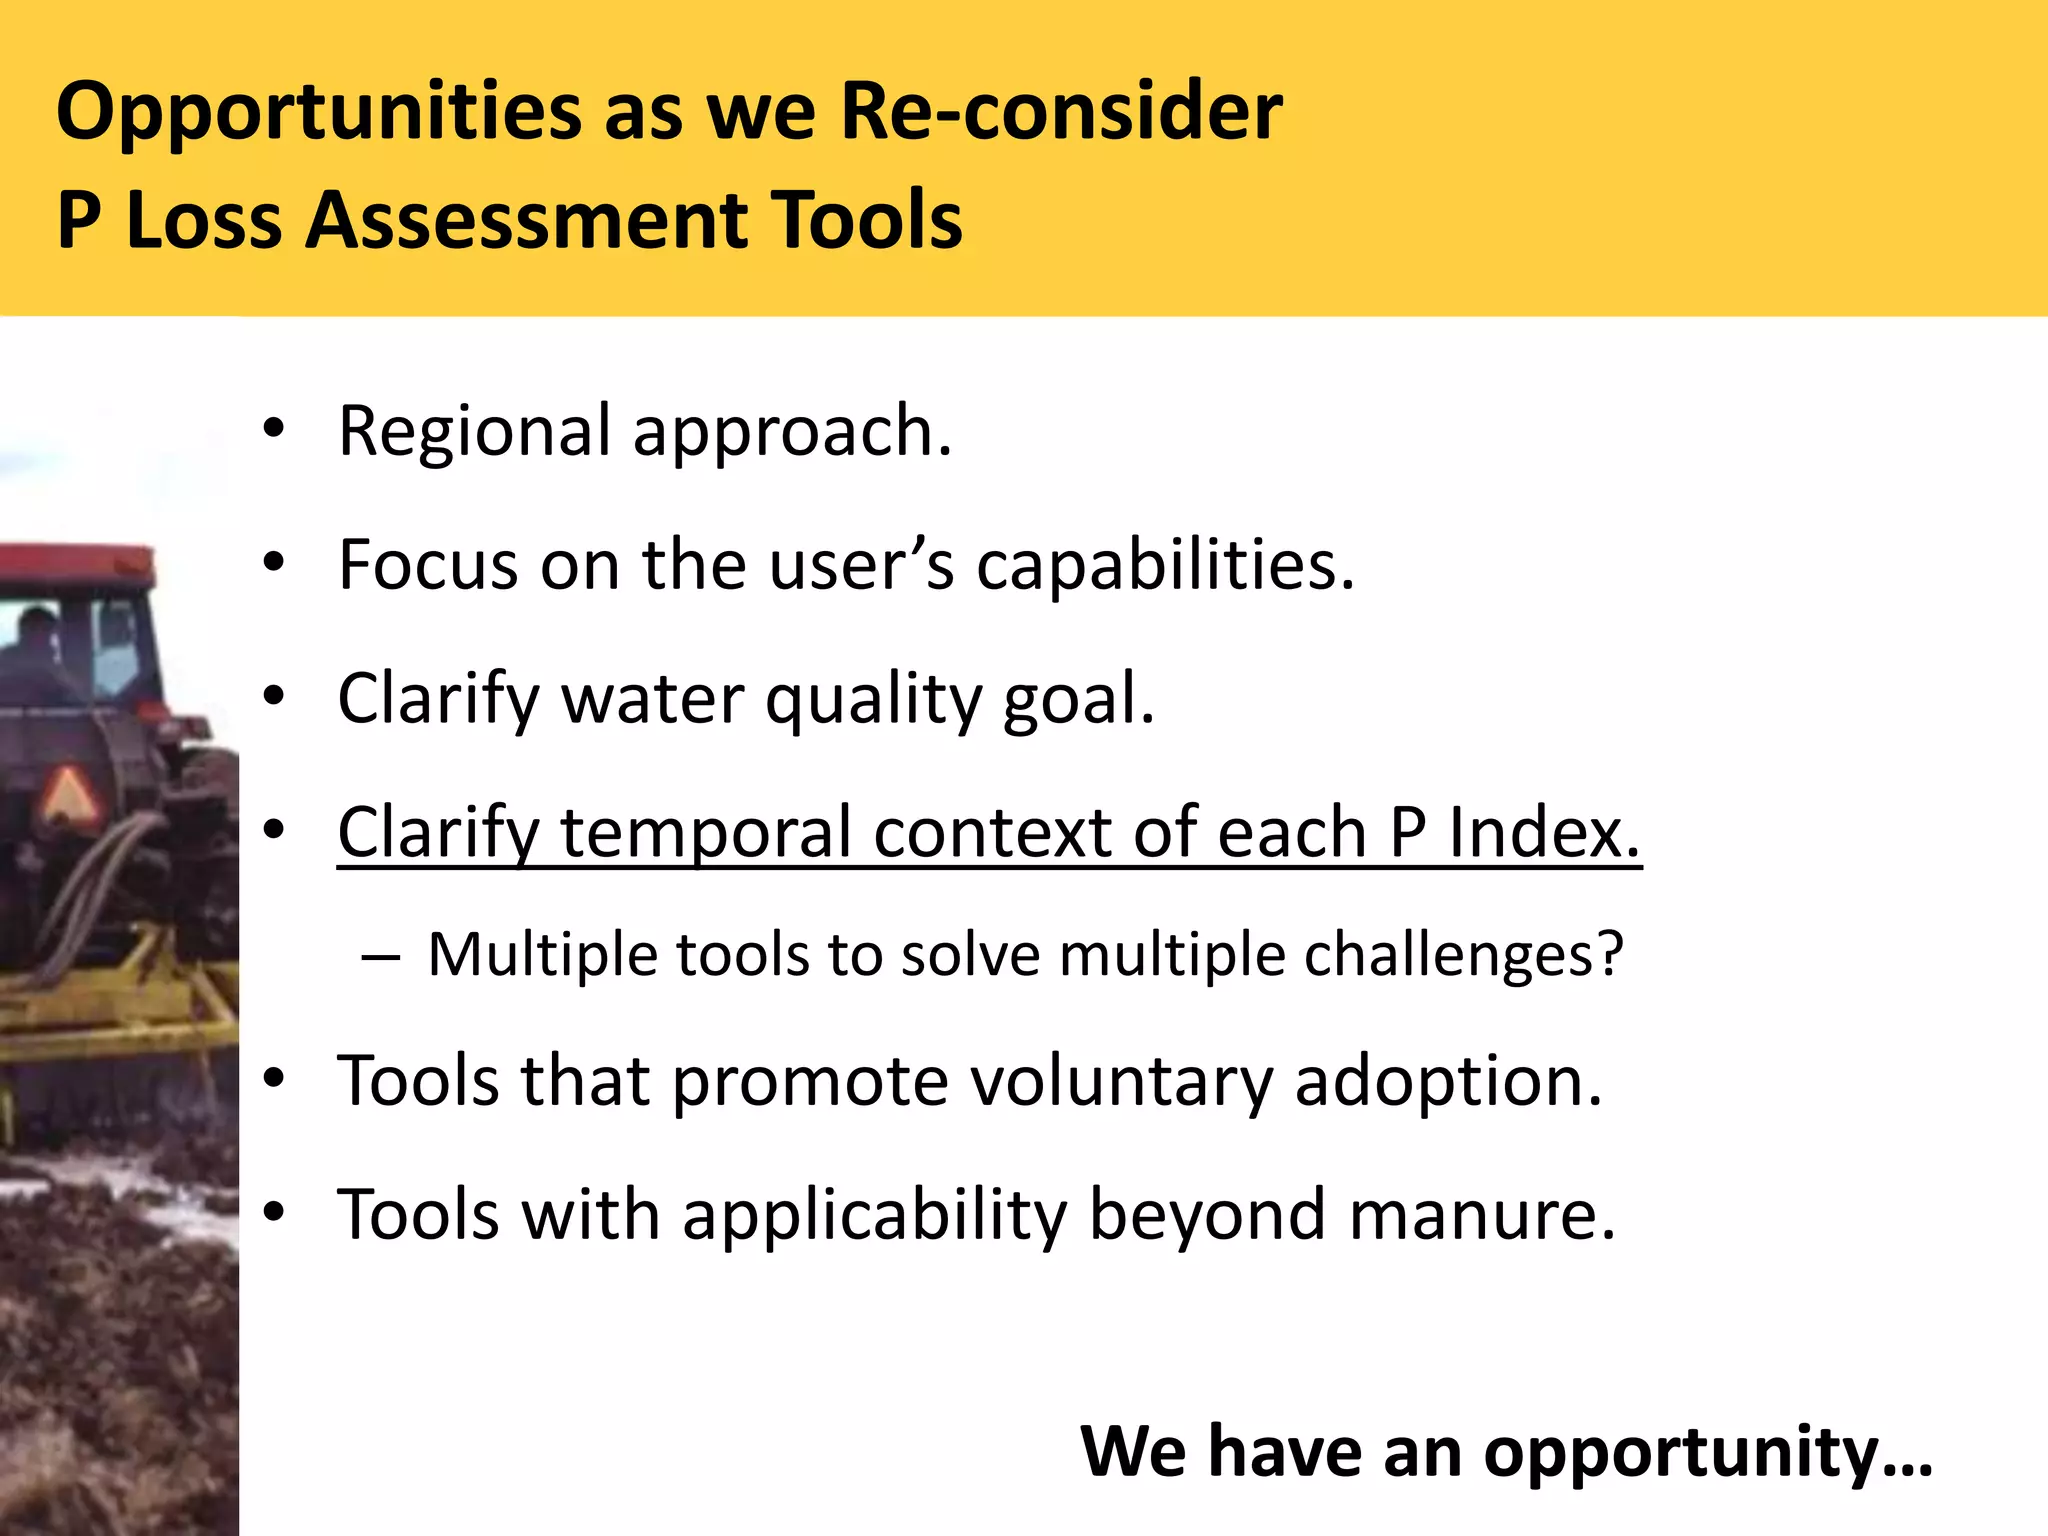
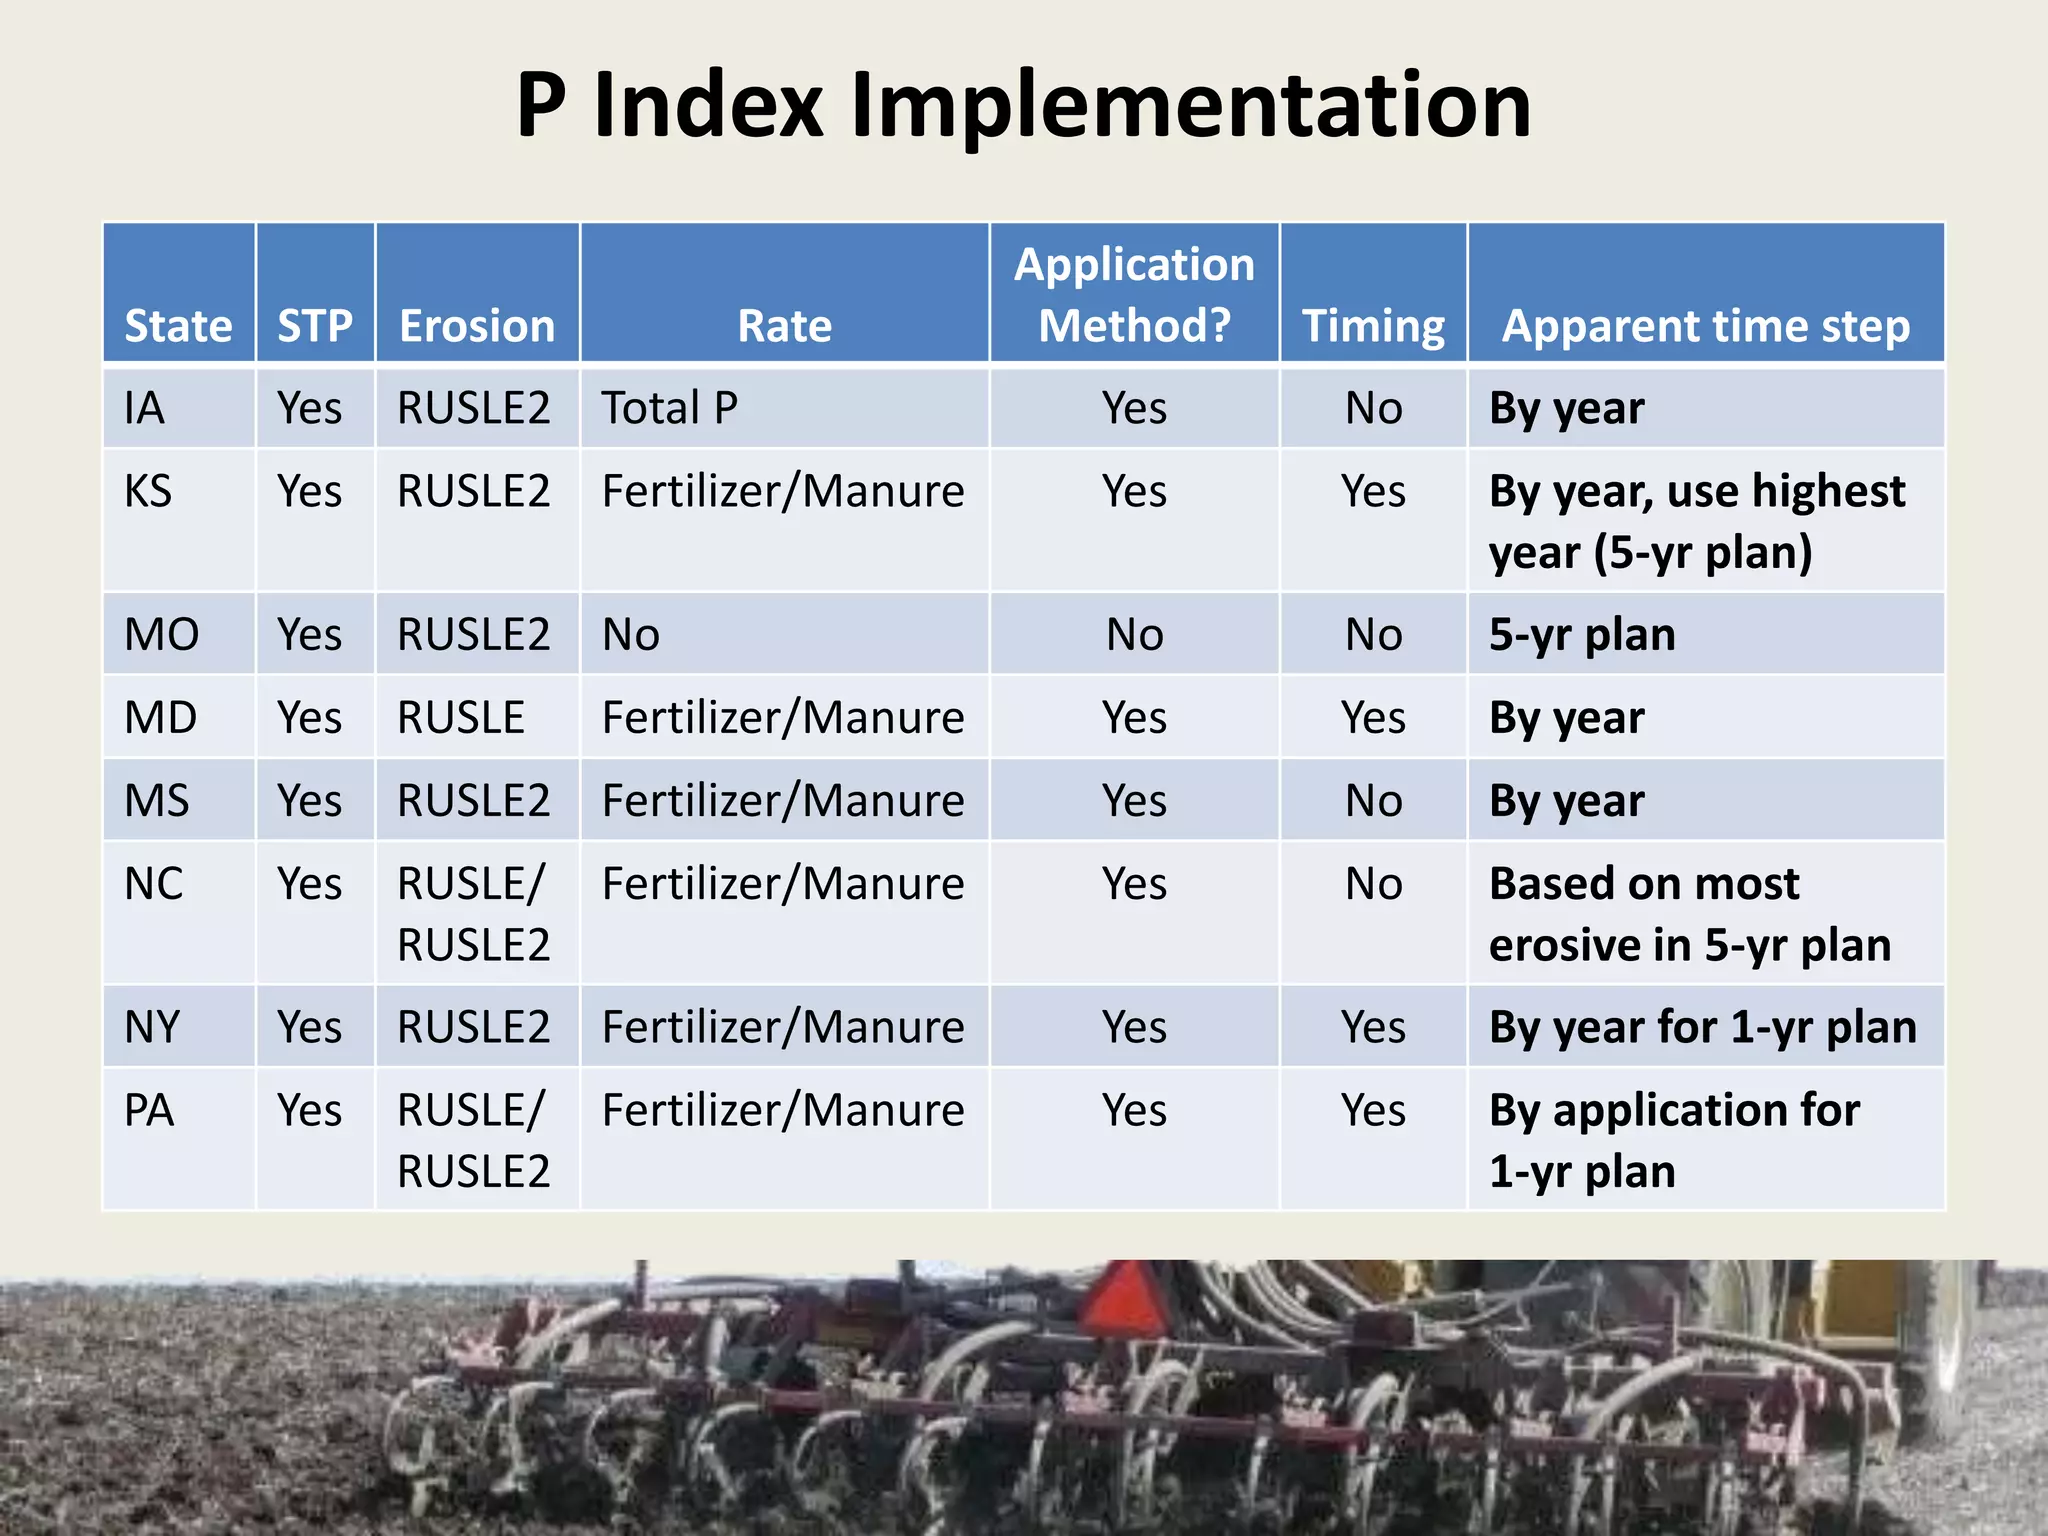
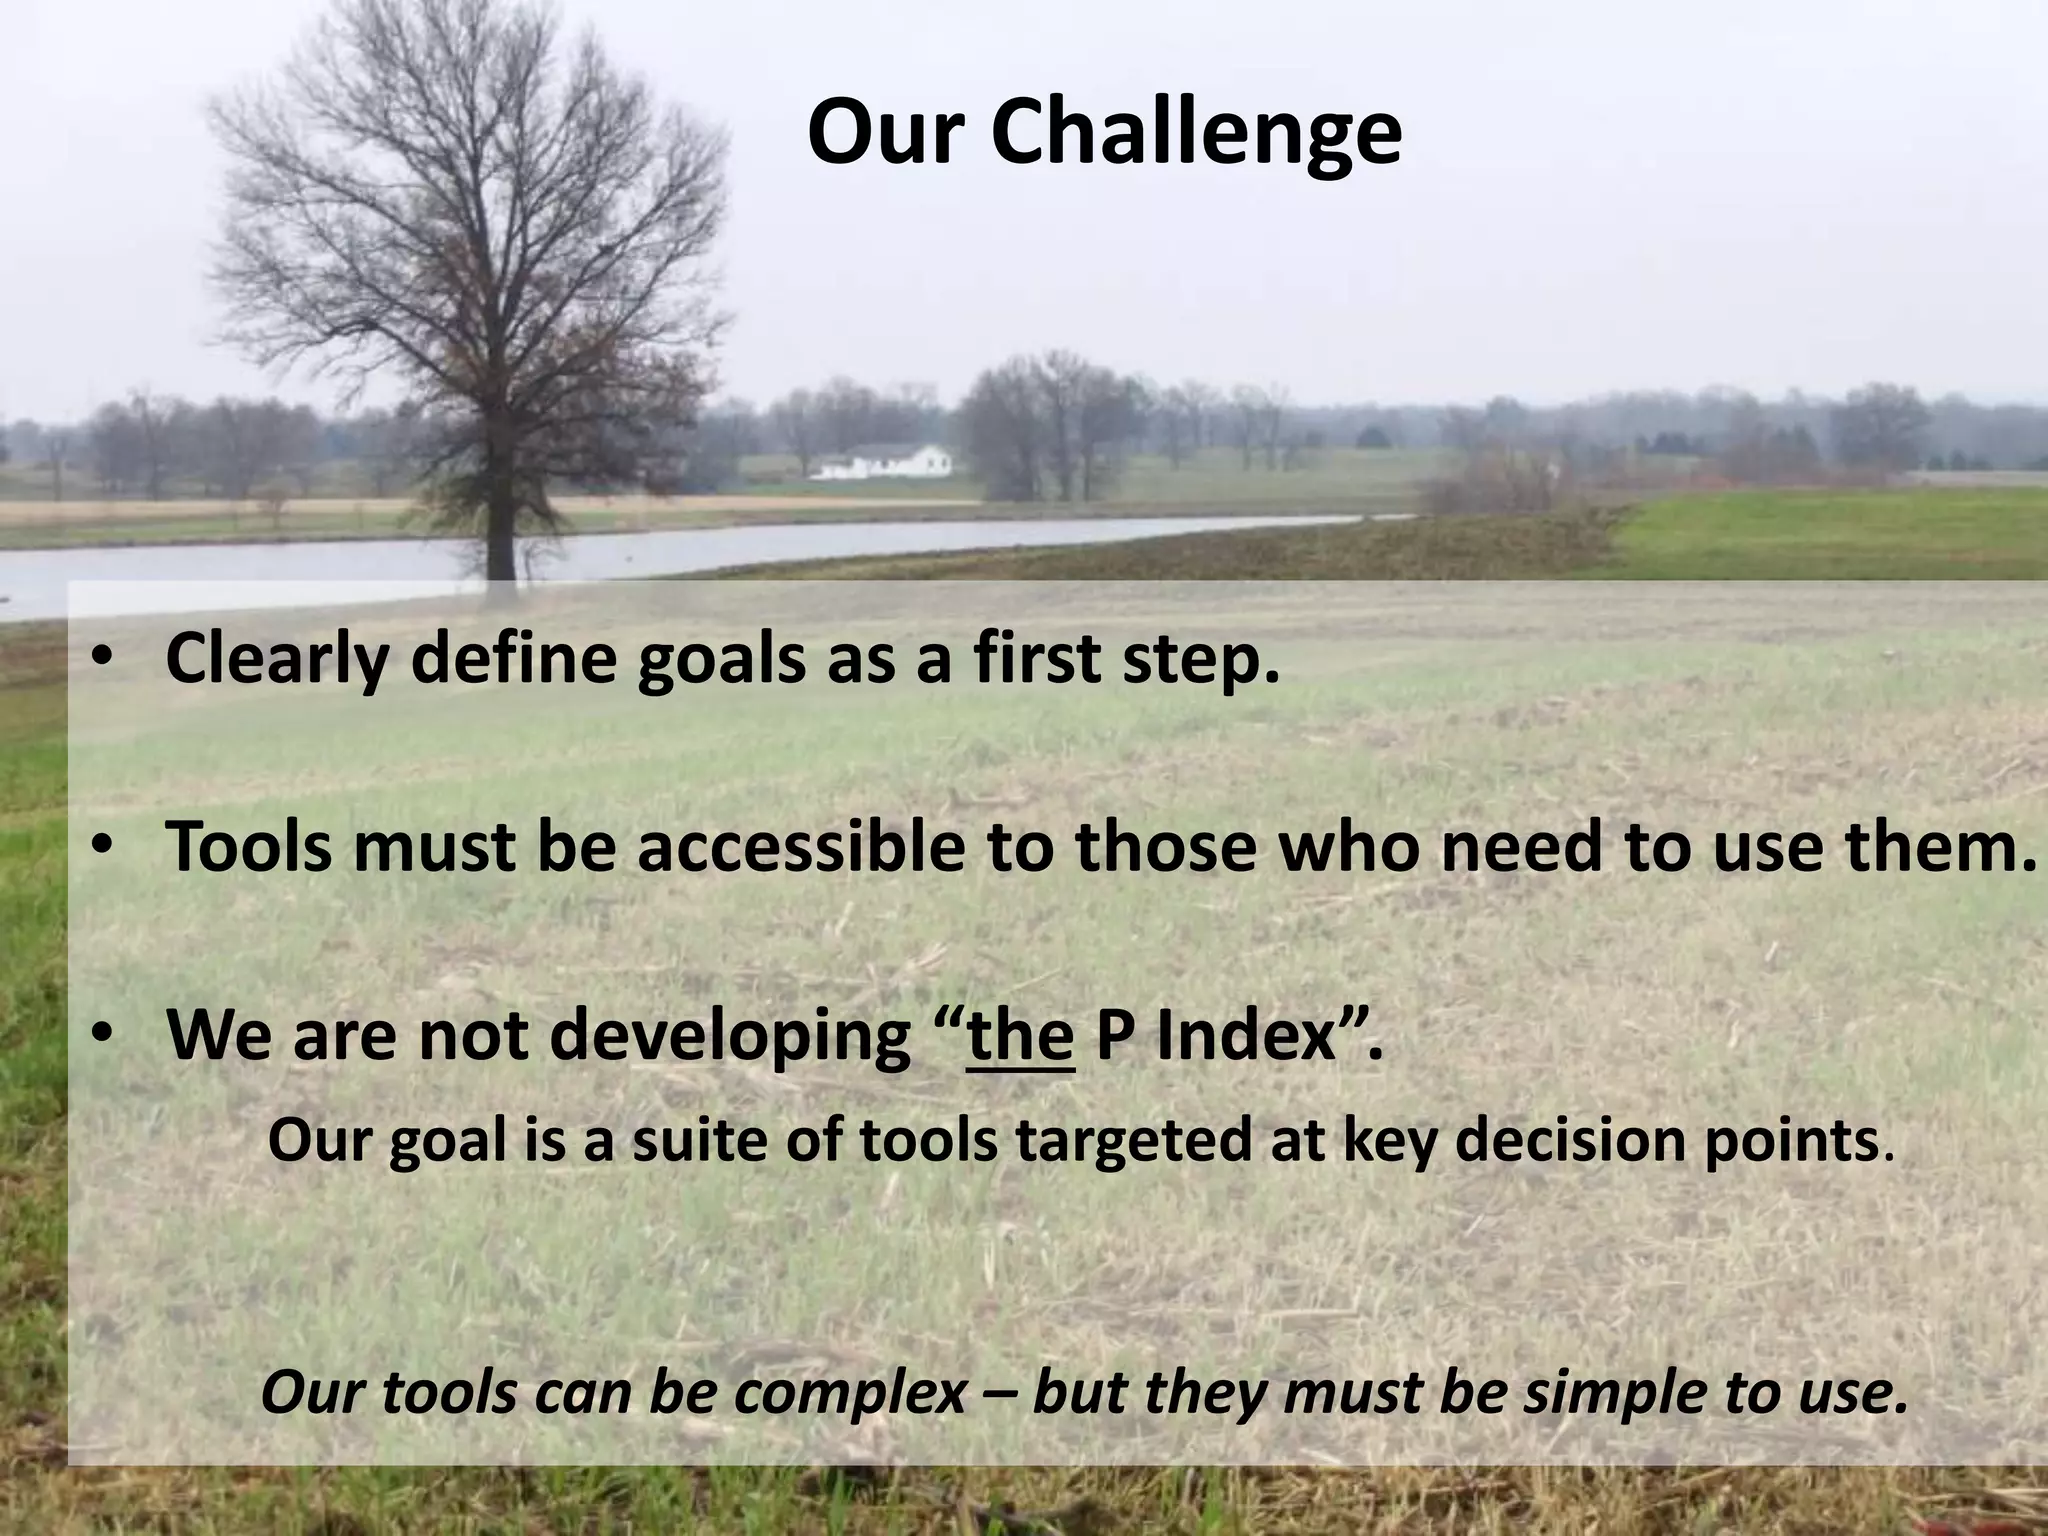

This document discusses the evolution and challenges of phosphorus management tools, emphasizing the need for a clearer framework for phosphorus loss assessment. It advocates for a regional approach that considers the capabilities of users and aims to promote voluntary adoption of effective tools. The document reinforces that nutrient management is a strategic process requiring collaboration among various stakeholders, including certified planners and farmers.


