Download to read offline

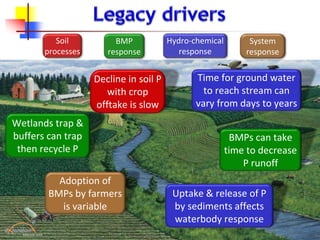
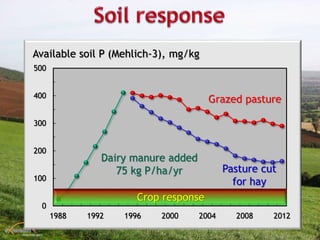
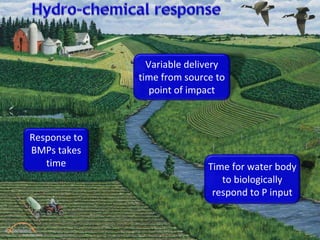
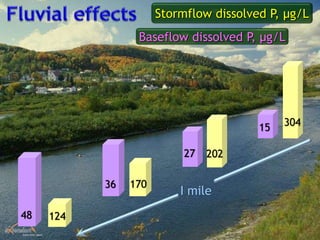
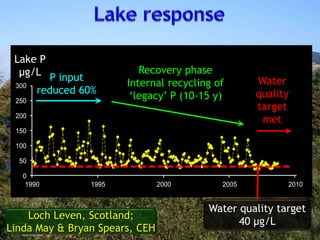
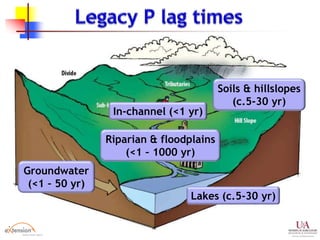


The document discusses the impact of legacy phosphorus (P) on farm conservation measures and water quality. It highlights how the uptake and release of P from sediments affect waterbody responses, emphasizing the slow adoption of best management practices (BMPs) by farmers and the delayed effectiveness of these practices. Additionally, it covers the implications of agricultural nutrient management, the need for understanding watershed responses, and the potential of legacy P to become a resource amidst changing economic conditions.


