Downloaded 240 times

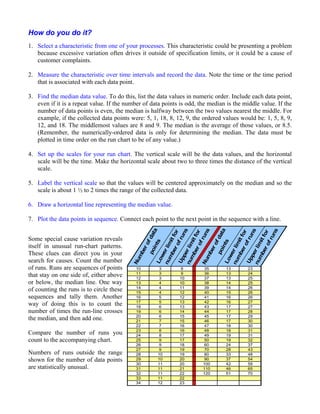


Run charts are line graphs that display data points in time sequence, helping to identify trends and variations in processes. They are particularly effective in the measure and analyze phases of Lean Six Sigma methodologies, allowing users to pinpoint unusual variations and track process performance over time. While valuable for trend analysis, run charts do not establish process capabilities, which requires more complex control charts.


![Arithmetic sequences and series[1]](https://cdn.slidesharecdn.com/ss_thumbnails/arithmeticsequencesandseries1-110831022502-phpapp01-thumbnail.jpg?width=640&height=640&fit=bounds)


