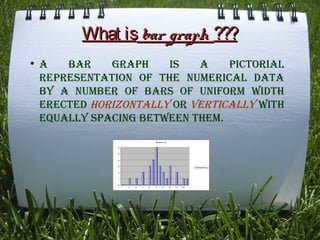
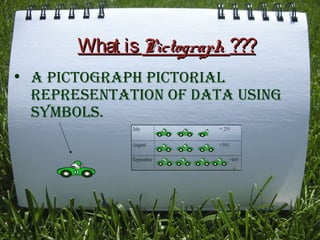
SlideShare a Scribd company logo
bar graph
Subject-Math'S
School-Kendriya Vidyalaya
DATA !!
the inforMation colleted in
the caSe iS called data.
Types of DATA

1. PriMary data.
2. Secondary data.
primary data & secondary data
 When an inVeStigator collectS data
hiMSelf With a definite Plan or deSign
in hiS/her Mind, it iS called PriMary
data.
 data Which are not originally
collected by the inVeStigator but
they are obtained froM PubliShed or
unPubliShed SourceS are KnoWn aS
Secondary data.
What is graph ???
 a diagraM that ShoWS relationShiPS
betWeen nuMberS. graPhS arrange
nuMerical inforMation into a Picture
froM Which it iS often PoSSible to See
oVerall PatternS or trendS in the
inforMation iS called graPh.
Types of graph
frequency

There are Three Types of graphs:1. Bar graph.
2. DouBle Bar graph.
3. picTograph.

6

5

4
3

1
0
1

40
35
30
25

Aj y
a

20

Aj y2
a

15
10
5
0
1

2

3

4

5

6

frequency

2

3

5

7

9

11

13

15

17

19
What is bar graph ???
•a
Bar
graph
is
a
picTorial
represenTaTion of The numerical DaTa
By a numBer of Bars of uniform wiDTh
erecTeD horizonTally or verTically wiTh
equally spacing BeTween Them.
frequency
6

5

4
3

frequency

2

1
0
1

3

5

7

9

11

13

15

17

19
Example of bar graph.
q. in a class of 30 pupils, The
maThemaTics Teacher creaTes The
TaBle Below ThaT gives The scores
The pupils geT in a TesT (The Teacher
scores The TesT from 0 To 20, anD all
The scores are whole numBers) Draw
a Bar graph ?
frequency

Solution.
6

5

4

3

frequency

2

1

0
1

3

5

7

9

11

13

15

17

19
What is double bar graph.
A bAr grAph showing two sets of dAtA
simultAneously.
it
is
useful
for
compArison of dAtA.
40
35
30
25

Ajay

20

Ajay2

15
10
5
0
1

2

3

4

5

6
Example of double bar graph.
40
35
30
25

Ajay

20

Ajay2

15
10
5
0
1

2

3

4

5

6

Name
Ajay

English Hindi Maths Sst.
35
35
32
29

Skt
39

Science
39

Ajay2

39

35

30

32

35

29
What is Pictograph ???
• A pictogrAph pictoriAl
representAtion of dAtA using
symbols.
Example of Pictograph.
=100 cars one symbol stand for 100 cars

50 cars

July

= 250

August

=300

September

=400
$ THANKS FOR YOUR
KIND
CONSIDERATION $

# Made. By –
ajay KuMar #

More Related Content

What's hot

Frequency Polygon
Frequency PolygonFrequency Polygon
Frequency Polygon
Dr. Amjad Ali Arain
 
Line graph bar graph
Line graph bar graphLine graph bar graph
Line graph bar graph
Ayesha Arshad
 
Bar Graphs And Histograms
Bar Graphs And HistogramsBar Graphs And Histograms
Bar Graphs And Histogramsmmeddin
 
Pie Chart
Pie  ChartPie  Chart
Graphical Representation of data
Graphical Representation of dataGraphical Representation of data
Graphical Representation of data
Jijo K Mathew
 
Descriptive Statistics
Descriptive StatisticsDescriptive Statistics
Descriptive Statistics
CIToolkit
 
Descriptive statistics and use of excel
Descriptive statistics and use of excelDescriptive statistics and use of excel
Descriptive statistics and use of excel
EhtishamAliHussain
 
Types of graphs
Types of graphsTypes of graphs
Types of graphs
LALIT BIST
 
Graph ppt
Graph pptGraph ppt
Graph ppt
Ravi Ramchandani
 
Meaning and Importance of Statistics
Meaning and Importance of StatisticsMeaning and Importance of Statistics
Meaning and Importance of Statistics
Flipped Channel
 
Importance of statistics
Importance of statisticsImportance of statistics
Importance of statistics
SayantiniBiswas
 
Data presentation
Data presentationData presentation
Data presentation
Weam Banjar
 
Frequency Polygon.pptx
Frequency Polygon.pptxFrequency Polygon.pptx
Frequency Polygon.pptx
Meenu M
 
Presentation of data ppt
Presentation of data pptPresentation of data ppt
Lesson 3 measures of central tendency
Lesson 3   measures of central tendencyLesson 3   measures of central tendency
Lesson 3 measures of central tendency
karisashley
 
Measure OF Central Tendency
Measure OF Central TendencyMeasure OF Central Tendency
Measure OF Central TendencyIqrabutt038
 
statistics Diagrams
 statistics Diagrams statistics Diagrams
statistics Diagrams
anil sharma
 
Introduction to statistics
Introduction to statisticsIntroduction to statistics
Introduction to statisticsmadan kumar
 

What's hot (20)

Frequency Polygon
Frequency PolygonFrequency Polygon
Frequency Polygon
 
Line graph bar graph
Line graph bar graphLine graph bar graph
Line graph bar graph
 
Bar Graphs And Histograms
Bar Graphs And HistogramsBar Graphs And Histograms
Bar Graphs And Histograms
 
Pie Chart
Pie  ChartPie  Chart
Pie Chart
 
Graphical Representation of data
Graphical Representation of dataGraphical Representation of data
Graphical Representation of data
 
Descriptive Statistics
Descriptive StatisticsDescriptive Statistics
Descriptive Statistics
 
Descriptive statistics and use of excel
Descriptive statistics and use of excelDescriptive statistics and use of excel
Descriptive statistics and use of excel
 
Types of graphs
Types of graphsTypes of graphs
Types of graphs
 
Graph ppt
Graph pptGraph ppt
Graph ppt
 
Meaning and Importance of Statistics
Meaning and Importance of StatisticsMeaning and Importance of Statistics
Meaning and Importance of Statistics
 
Histogram
HistogramHistogram
Histogram
 
Importance of statistics
Importance of statisticsImportance of statistics
Importance of statistics
 
discrete and continuous data
discrete and continuous datadiscrete and continuous data
discrete and continuous data
 
Data presentation
Data presentationData presentation
Data presentation
 
Frequency Polygon.pptx
Frequency Polygon.pptxFrequency Polygon.pptx
Frequency Polygon.pptx
 
Presentation of data ppt
Presentation of data pptPresentation of data ppt
Presentation of data ppt
 
Lesson 3 measures of central tendency
Lesson 3   measures of central tendencyLesson 3   measures of central tendency
Lesson 3 measures of central tendency
 
Measure OF Central Tendency
Measure OF Central TendencyMeasure OF Central Tendency
Measure OF Central Tendency
 
statistics Diagrams
 statistics Diagrams statistics Diagrams
statistics Diagrams
 
Introduction to statistics
Introduction to statisticsIntroduction to statistics
Introduction to statistics
 

More from 982665379

Wild life
Wild lifeWild life
Wild life
982665379
 
Science project
Science projectScience project
Science project982665379
 
Frequency distribution
Frequency distributionFrequency distribution
Frequency distribution982665379
 
Disaster management
Disaster managementDisaster management
Disaster management982665379
 
Computer project work [viii]2008 09
Computer project work  [viii]2008 09Computer project work  [viii]2008 09
Computer project work [viii]2008 09982665379
 
Frequency distribution
Frequency distributionFrequency distribution
Frequency distribution982665379
 
Disaster management
Disaster managementDisaster management
Disaster management982665379
 
Desert animal
Desert animalDesert animal
Desert animal982665379
 
Disaster management
Disaster managementDisaster management
Disaster management982665379
 
Desert animal
Desert animalDesert animal
Desert animal982665379
 

More from 982665379 (13)

Wild life
Wild lifeWild life
Wild life
 
Pie chart
Pie chartPie chart
Pie chart
 
Probabelity
ProbabelityProbabelity
Probabelity
 
Science project
Science projectScience project
Science project
 
Light
LightLight
Light
 
Frequency distribution
Frequency distributionFrequency distribution
Frequency distribution
 
Disaster management
Disaster managementDisaster management
Disaster management
 
Computer project work [viii]2008 09
Computer project work  [viii]2008 09Computer project work  [viii]2008 09
Computer project work [viii]2008 09
 
Frequency distribution
Frequency distributionFrequency distribution
Frequency distribution
 
Disaster management
Disaster managementDisaster management
Disaster management
 
Desert animal
Desert animalDesert animal
Desert animal
 
Disaster management
Disaster managementDisaster management
Disaster management
 
Desert animal
Desert animalDesert animal
Desert animal
 

Recently uploaded

The Art of the Pitch: WordPress Relationships and Sales
The Art of the Pitch: WordPress Relationships and SalesThe Art of the Pitch: WordPress Relationships and Sales
The Art of the Pitch: WordPress Relationships and Sales
Laura Byrne
 
PCI PIN Basics Webinar from the Controlcase Team
PCI PIN Basics Webinar from the Controlcase TeamPCI PIN Basics Webinar from the Controlcase Team
PCI PIN Basics Webinar from the Controlcase Team
ControlCase
 
By Design, not by Accident - Agile Venture Bolzano 2024
By Design, not by Accident - Agile Venture Bolzano 2024By Design, not by Accident - Agile Venture Bolzano 2024
By Design, not by Accident - Agile Venture Bolzano 2024
Pierluigi Pugliese
 
Uni Systems Copilot event_05062024_C.Vlachos.pdf
Uni Systems Copilot event_05062024_C.Vlachos.pdfUni Systems Copilot event_05062024_C.Vlachos.pdf
Uni Systems Copilot event_05062024_C.Vlachos.pdf
Uni Systems S.M.S.A.
 
Video Streaming: Then, Now, and in the Future
Video Streaming: Then, Now, and in the FutureVideo Streaming: Then, Now, and in the Future
Video Streaming: Then, Now, and in the Future
Alpen-Adria-Universität
 
UiPath Test Automation using UiPath Test Suite series, part 6
UiPath Test Automation using UiPath Test Suite series, part 6UiPath Test Automation using UiPath Test Suite series, part 6
UiPath Test Automation using UiPath Test Suite series, part 6
DianaGray10
 
Monitoring Java Application Security with JDK Tools and JFR Events
Monitoring Java Application Security with JDK Tools and JFR EventsMonitoring Java Application Security with JDK Tools and JFR Events
Monitoring Java Application Security with JDK Tools and JFR Events
Ana-Maria Mihalceanu
 
みなさんこんにちはこれ何文字まで入るの?40文字以下不可とか本当に意味わからないけどこれ限界文字数書いてないからマジでやばい文字数いけるんじゃないの?えこ...
みなさんこんにちはこれ何文字まで入るの?40文字以下不可とか本当に意味わからないけどこれ限界文字数書いてないからマジでやばい文字数いけるんじゃないの?えこ...みなさんこんにちはこれ何文字まで入るの?40文字以下不可とか本当に意味わからないけどこれ限界文字数書いてないからマジでやばい文字数いけるんじゃないの?えこ...
みなさんこんにちはこれ何文字まで入るの?40文字以下不可とか本当に意味わからないけどこれ限界文字数書いてないからマジでやばい文字数いけるんじゃないの?えこ...
名前 です男
 
Free Complete Python - A step towards Data Science
Free Complete Python - A step towards Data ScienceFree Complete Python - A step towards Data Science
Free Complete Python - A step towards Data Science
RinaMondal9
 
Encryption in Microsoft 365 - ExpertsLive Netherlands 2024
Encryption in Microsoft 365 - ExpertsLive Netherlands 2024Encryption in Microsoft 365 - ExpertsLive Netherlands 2024
Encryption in Microsoft 365 - ExpertsLive Netherlands 2024
Albert Hoitingh
 
GraphRAG is All You need? LLM & Knowledge Graph
GraphRAG is All You need? LLM & Knowledge GraphGraphRAG is All You need? LLM & Knowledge Graph
GraphRAG is All You need? LLM & Knowledge Graph
Guy Korland
 
Securing your Kubernetes cluster_ a step-by-step guide to success !
Securing your Kubernetes cluster_ a step-by-step guide to success !Securing your Kubernetes cluster_ a step-by-step guide to success !
Securing your Kubernetes cluster_ a step-by-step guide to success !
KatiaHIMEUR1
 
GraphSummit Singapore | The Art of the Possible with Graph - Q2 2024
GraphSummit Singapore | The Art of the  Possible with Graph - Q2 2024GraphSummit Singapore | The Art of the  Possible with Graph - Q2 2024
GraphSummit Singapore | The Art of the Possible with Graph - Q2 2024
Neo4j
 
Pushing the limits of ePRTC: 100ns holdover for 100 days
Pushing the limits of ePRTC: 100ns holdover for 100 daysPushing the limits of ePRTC: 100ns holdover for 100 days
Pushing the limits of ePRTC: 100ns holdover for 100 days
Adtran
 
Observability Concepts EVERY Developer Should Know -- DeveloperWeek Europe.pdf
Observability Concepts EVERY Developer Should Know -- DeveloperWeek Europe.pdfObservability Concepts EVERY Developer Should Know -- DeveloperWeek Europe.pdf
Observability Concepts EVERY Developer Should Know -- DeveloperWeek Europe.pdf
Paige Cruz
 
Communications Mining Series - Zero to Hero - Session 1
Communications Mining Series - Zero to Hero - Session 1Communications Mining Series - Zero to Hero - Session 1
Communications Mining Series - Zero to Hero - Session 1
DianaGray10
 
GraphSummit Singapore | The Future of Agility: Supercharging Digital Transfor...
GraphSummit Singapore | The Future of Agility: Supercharging Digital Transfor...GraphSummit Singapore | The Future of Agility: Supercharging Digital Transfor...
GraphSummit Singapore | The Future of Agility: Supercharging Digital Transfor...
Neo4j
 
Secstrike : Reverse Engineering & Pwnable tools for CTF.pptx
Secstrike : Reverse Engineering & Pwnable tools for CTF.pptxSecstrike : Reverse Engineering & Pwnable tools for CTF.pptx
Secstrike : Reverse Engineering & Pwnable tools for CTF.pptx
nkrafacyberclub
 
GDG Cloud Southlake #33: Boule & Rebala: Effective AppSec in SDLC using Deplo...
GDG Cloud Southlake #33: Boule & Rebala: Effective AppSec in SDLC using Deplo...GDG Cloud Southlake #33: Boule & Rebala: Effective AppSec in SDLC using Deplo...
GDG Cloud Southlake #33: Boule & Rebala: Effective AppSec in SDLC using Deplo...
James Anderson
 
GraphSummit Singapore | Graphing Success: Revolutionising Organisational Stru...
GraphSummit Singapore | Graphing Success: Revolutionising Organisational Stru...GraphSummit Singapore | Graphing Success: Revolutionising Organisational Stru...
GraphSummit Singapore | Graphing Success: Revolutionising Organisational Stru...
Neo4j
 

Recently uploaded (20)

The Art of the Pitch: WordPress Relationships and Sales
The Art of the Pitch: WordPress Relationships and SalesThe Art of the Pitch: WordPress Relationships and Sales
The Art of the Pitch: WordPress Relationships and Sales
 
PCI PIN Basics Webinar from the Controlcase Team
PCI PIN Basics Webinar from the Controlcase TeamPCI PIN Basics Webinar from the Controlcase Team
PCI PIN Basics Webinar from the Controlcase Team
 
By Design, not by Accident - Agile Venture Bolzano 2024
By Design, not by Accident - Agile Venture Bolzano 2024By Design, not by Accident - Agile Venture Bolzano 2024
By Design, not by Accident - Agile Venture Bolzano 2024
 
Uni Systems Copilot event_05062024_C.Vlachos.pdf
Uni Systems Copilot event_05062024_C.Vlachos.pdfUni Systems Copilot event_05062024_C.Vlachos.pdf
Uni Systems Copilot event_05062024_C.Vlachos.pdf
 
Video Streaming: Then, Now, and in the Future
Video Streaming: Then, Now, and in the FutureVideo Streaming: Then, Now, and in the Future
Video Streaming: Then, Now, and in the Future
 
UiPath Test Automation using UiPath Test Suite series, part 6
UiPath Test Automation using UiPath Test Suite series, part 6UiPath Test Automation using UiPath Test Suite series, part 6
UiPath Test Automation using UiPath Test Suite series, part 6
 
Monitoring Java Application Security with JDK Tools and JFR Events
Monitoring Java Application Security with JDK Tools and JFR EventsMonitoring Java Application Security with JDK Tools and JFR Events
Monitoring Java Application Security with JDK Tools and JFR Events
 
みなさんこんにちはこれ何文字まで入るの?40文字以下不可とか本当に意味わからないけどこれ限界文字数書いてないからマジでやばい文字数いけるんじゃないの?えこ...
みなさんこんにちはこれ何文字まで入るの?40文字以下不可とか本当に意味わからないけどこれ限界文字数書いてないからマジでやばい文字数いけるんじゃないの?えこ...みなさんこんにちはこれ何文字まで入るの?40文字以下不可とか本当に意味わからないけどこれ限界文字数書いてないからマジでやばい文字数いけるんじゃないの?えこ...
みなさんこんにちはこれ何文字まで入るの?40文字以下不可とか本当に意味わからないけどこれ限界文字数書いてないからマジでやばい文字数いけるんじゃないの?えこ...
 
Free Complete Python - A step towards Data Science
Free Complete Python - A step towards Data ScienceFree Complete Python - A step towards Data Science
Free Complete Python - A step towards Data Science
 
Encryption in Microsoft 365 - ExpertsLive Netherlands 2024
Encryption in Microsoft 365 - ExpertsLive Netherlands 2024Encryption in Microsoft 365 - ExpertsLive Netherlands 2024
Encryption in Microsoft 365 - ExpertsLive Netherlands 2024
 
GraphRAG is All You need? LLM & Knowledge Graph
GraphRAG is All You need? LLM & Knowledge GraphGraphRAG is All You need? LLM & Knowledge Graph
GraphRAG is All You need? LLM & Knowledge Graph
 
Securing your Kubernetes cluster_ a step-by-step guide to success !
Securing your Kubernetes cluster_ a step-by-step guide to success !Securing your Kubernetes cluster_ a step-by-step guide to success !
Securing your Kubernetes cluster_ a step-by-step guide to success !
 
GraphSummit Singapore | The Art of the Possible with Graph - Q2 2024
GraphSummit Singapore | The Art of the  Possible with Graph - Q2 2024GraphSummit Singapore | The Art of the  Possible with Graph - Q2 2024
GraphSummit Singapore | The Art of the Possible with Graph - Q2 2024
 
Pushing the limits of ePRTC: 100ns holdover for 100 days
Pushing the limits of ePRTC: 100ns holdover for 100 daysPushing the limits of ePRTC: 100ns holdover for 100 days
Pushing the limits of ePRTC: 100ns holdover for 100 days
 
Observability Concepts EVERY Developer Should Know -- DeveloperWeek Europe.pdf
Observability Concepts EVERY Developer Should Know -- DeveloperWeek Europe.pdfObservability Concepts EVERY Developer Should Know -- DeveloperWeek Europe.pdf
Observability Concepts EVERY Developer Should Know -- DeveloperWeek Europe.pdf
 
Communications Mining Series - Zero to Hero - Session 1
Communications Mining Series - Zero to Hero - Session 1Communications Mining Series - Zero to Hero - Session 1
Communications Mining Series - Zero to Hero - Session 1
 
GraphSummit Singapore | The Future of Agility: Supercharging Digital Transfor...
GraphSummit Singapore | The Future of Agility: Supercharging Digital Transfor...GraphSummit Singapore | The Future of Agility: Supercharging Digital Transfor...
GraphSummit Singapore | The Future of Agility: Supercharging Digital Transfor...
 
Secstrike : Reverse Engineering & Pwnable tools for CTF.pptx
Secstrike : Reverse Engineering & Pwnable tools for CTF.pptxSecstrike : Reverse Engineering & Pwnable tools for CTF.pptx
Secstrike : Reverse Engineering & Pwnable tools for CTF.pptx
 
GDG Cloud Southlake #33: Boule & Rebala: Effective AppSec in SDLC using Deplo...
GDG Cloud Southlake #33: Boule & Rebala: Effective AppSec in SDLC using Deplo...GDG Cloud Southlake #33: Boule & Rebala: Effective AppSec in SDLC using Deplo...
GDG Cloud Southlake #33: Boule & Rebala: Effective AppSec in SDLC using Deplo...
 
GraphSummit Singapore | Graphing Success: Revolutionising Organisational Stru...
GraphSummit Singapore | Graphing Success: Revolutionising Organisational Stru...GraphSummit Singapore | Graphing Success: Revolutionising Organisational Stru...
GraphSummit Singapore | Graphing Success: Revolutionising Organisational Stru...
 

Bar graph

  • 2. DATA !! the inforMation colleted in the caSe iS called data. Types of DATA 1. PriMary data. 2. Secondary data.
  • 3. primary data & secondary data  When an inVeStigator collectS data hiMSelf With a definite Plan or deSign in hiS/her Mind, it iS called PriMary data.  data Which are not originally collected by the inVeStigator but they are obtained froM PubliShed or unPubliShed SourceS are KnoWn aS Secondary data.
  • 4. What is graph ???  a diagraM that ShoWS relationShiPS betWeen nuMberS. graPhS arrange nuMerical inforMation into a Picture froM Which it iS often PoSSible to See oVerall PatternS or trendS in the inforMation iS called graPh.
  • 5. Types of graph frequency There are Three Types of graphs:1. Bar graph. 2. DouBle Bar graph. 3. picTograph. 6 5 4 3 1 0 1 40 35 30 25 Aj y a 20 Aj y2 a 15 10 5 0 1 2 3 4 5 6 frequency 2 3 5 7 9 11 13 15 17 19
  • 6. What is bar graph ??? •a Bar graph is a picTorial represenTaTion of The numerical DaTa By a numBer of Bars of uniform wiDTh erecTeD horizonTally or verTically wiTh equally spacing BeTween Them. frequency 6 5 4 3 frequency 2 1 0 1 3 5 7 9 11 13 15 17 19
  • 7. Example of bar graph. q. in a class of 30 pupils, The maThemaTics Teacher creaTes The TaBle Below ThaT gives The scores The pupils geT in a TesT (The Teacher scores The TesT from 0 To 20, anD all The scores are whole numBers) Draw a Bar graph ?
  • 9. What is double bar graph. A bAr grAph showing two sets of dAtA simultAneously. it is useful for compArison of dAtA. 40 35 30 25 Ajay 20 Ajay2 15 10 5 0 1 2 3 4 5 6
  • 10. Example of double bar graph. 40 35 30 25 Ajay 20 Ajay2 15 10 5 0 1 2 3 4 5 6 Name Ajay English Hindi Maths Sst. 35 35 32 29 Skt 39 Science 39 Ajay2 39 35 30 32 35 29
  • 11. What is Pictograph ??? • A pictogrAph pictoriAl representAtion of dAtA using symbols.
  • 12. Example of Pictograph. =100 cars one symbol stand for 100 cars 50 cars July = 250 August =300 September =400
  • 13. $ THANKS FOR YOUR KIND CONSIDERATION $ # Made. By – ajay KuMar #