Downloaded 497 times
![Reminder!!! Next lesson bring your Classwork book. Email the progress of your survey project to Cikgu Norliza at [email_address] Or post your project in the Facebook web page - Maths Ideas in SMPW, KB Before Thursday, 10 Feb 2011](https://image.slidesharecdn.com/piechart-110207014130-phpapp02/85/Pie-chart-11-320.jpg)

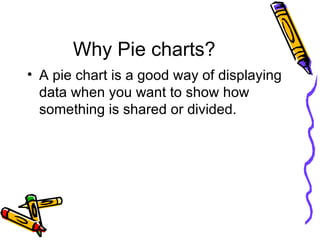
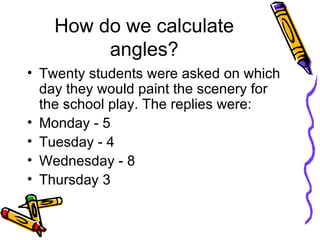
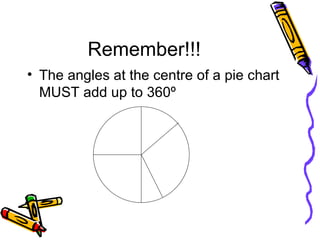
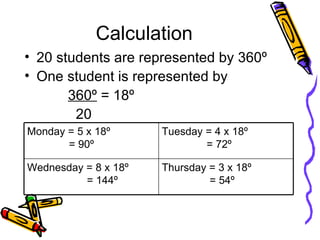
The document discusses how to draw and calculate percentages for a pie chart. It provides an example of survey data about which day students would paint scenery for a school play. The data is used to calculate the angles for each sector of the pie chart based on the total of 360 degrees. Students are then asked to draw the pie chart, include a key, and calculate the percentage for each sector. Peer assessment is also discussed to check work for points and stars.


![Circle graphs[1]](https://cdn.slidesharecdn.com/ss_thumbnails/circlegraphs1-120315115056-phpapp01-thumbnail.jpg?width=640&height=640&fit=bounds)


![Presenting-Experimental-Data-Grade-8 [Autosaved].pptx](https://cdn.slidesharecdn.com/ss_thumbnails/presenting-experimental-data-grade-8autosaved-240925105557-9775d0ae-thumbnail.jpg?width=640&height=640&fit=bounds)
![Presenting-Experimental-Data-Grade-8 [Autosaved].pptx](https://cdn.slidesharecdn.com/ss_thumbnails/presenting-experimental-data-grade-8autosaved-240925104859-008a237a-thumbnail.jpg?width=640&height=640&fit=bounds)


![Drawing pie charts[1]](https://cdn.slidesharecdn.com/ss_thumbnails/drawingpiecharts1-140423094435-phpapp01-thumbnail.jpg?width=640&height=640&fit=bounds)


