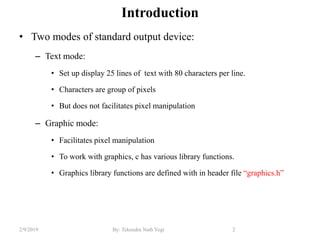
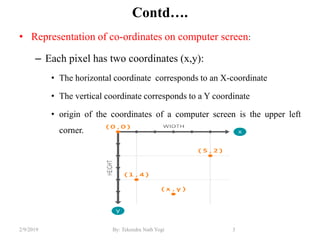
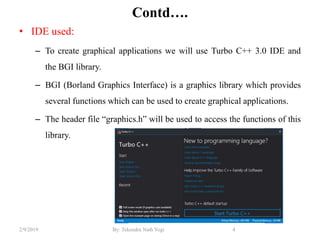
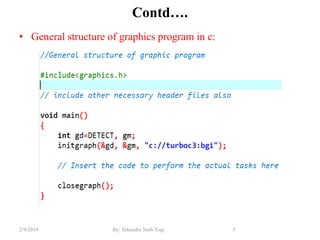
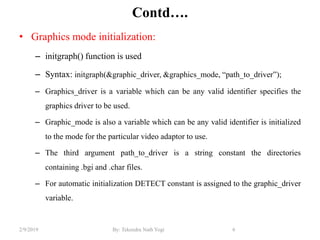
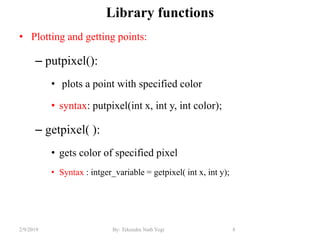
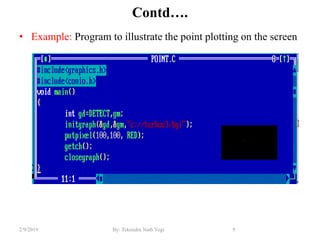
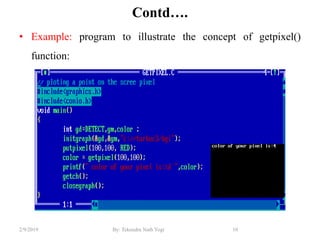
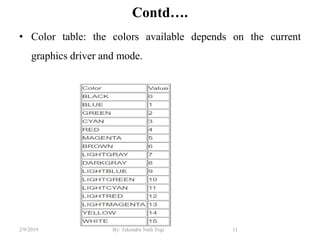
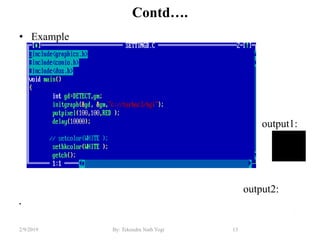
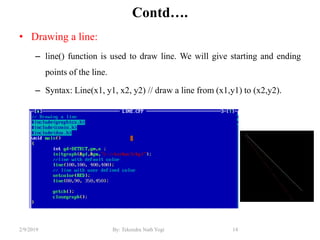
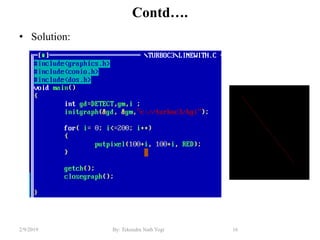
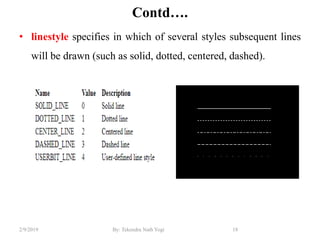
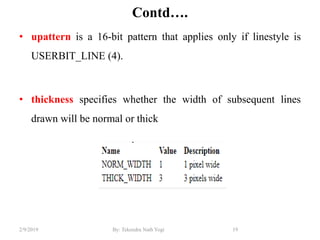
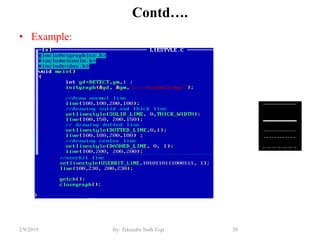
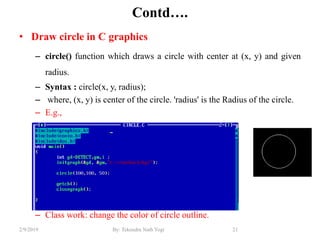
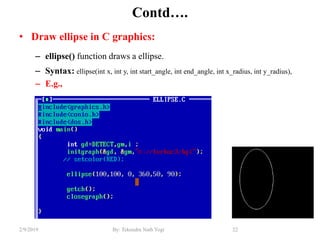
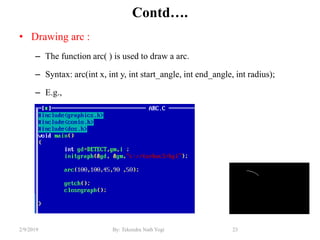
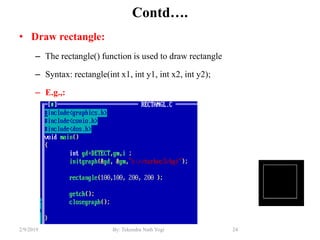
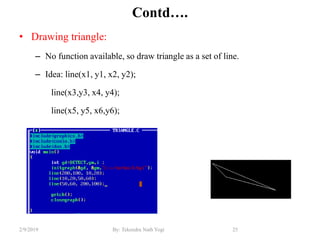
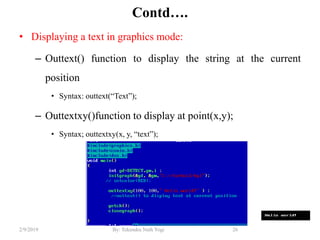
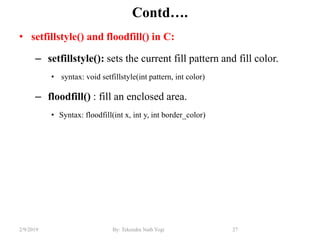
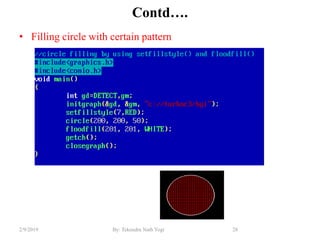
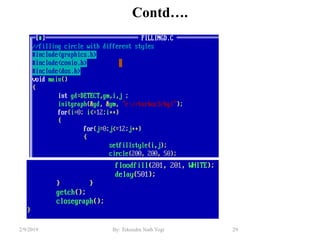
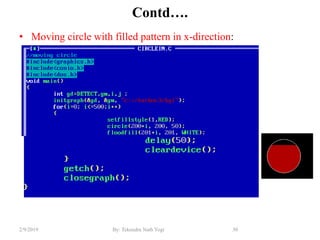
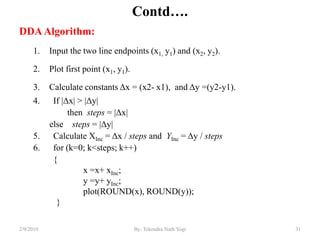
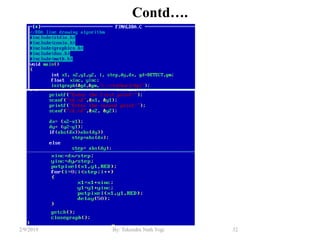
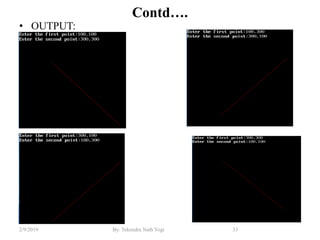
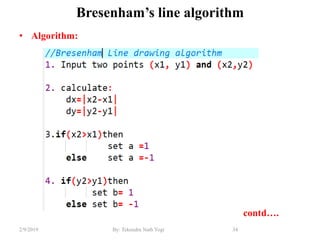
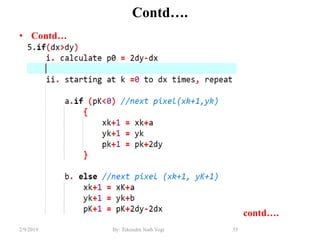
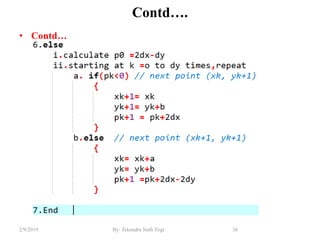
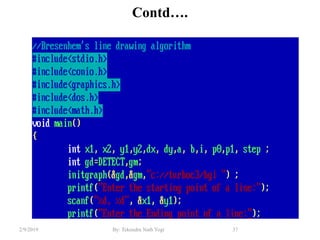
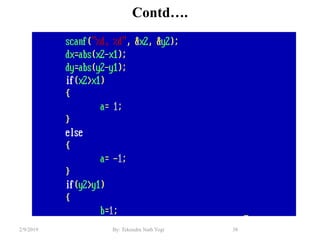
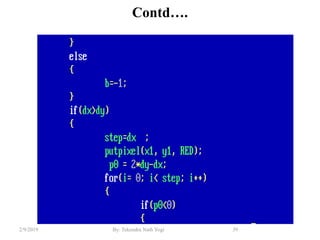
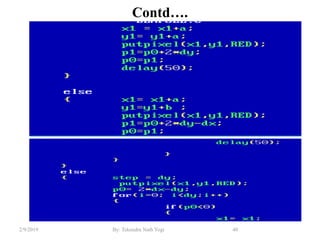
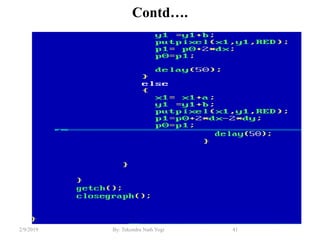
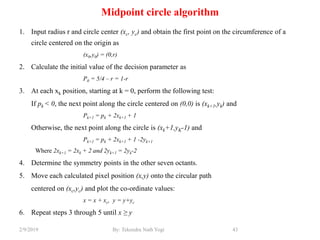
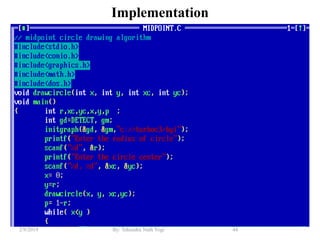
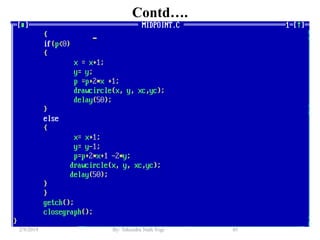
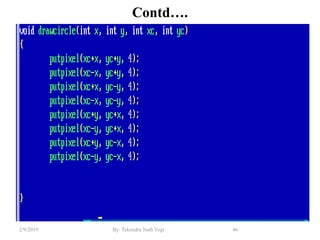
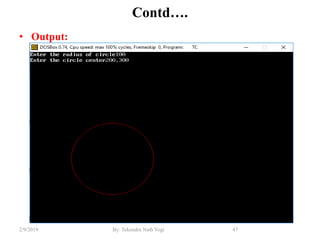
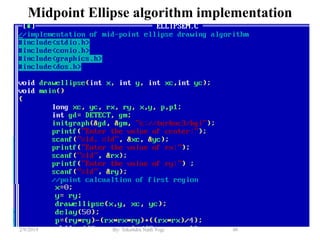
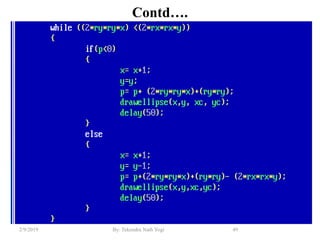
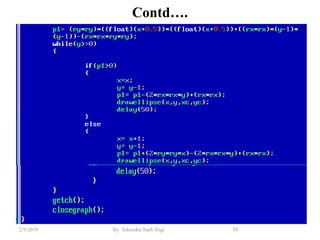
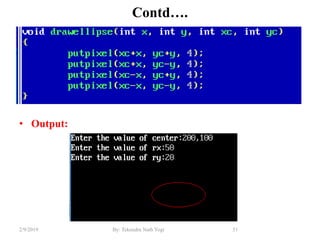
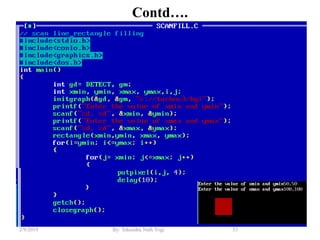
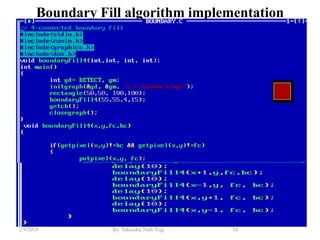
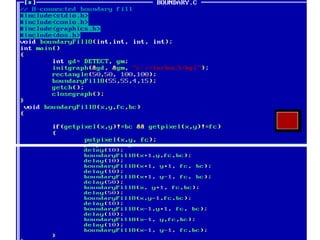
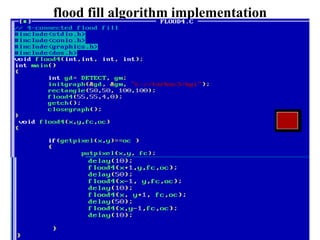
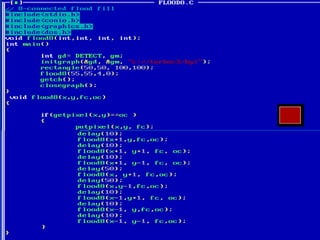
Computer Graphics Lab
Presented By : Tekendra Nath Yogi
Tekendranath@gmail.com
College Of Applied Business And Technology
Introduction
• Two modes of standard output device:
– Text mode:
• Set up display 25 lines of text with 80 characters per line.
• Characters are group of pixels
• But does not facilitates pixel manipulation
– Graphic mode:
• Facilitates pixel manipulation
• To work with graphics, c has various library functions.
• Graphics library functions are defined with in header file “graphics.h”
2By: Tekendra Nath Yogi2/9/2019
Contd….
• Representation of co-ordinates on computer screen:
– Each pixel has two coordinates (x,y):
• The horizontal coordinate corresponds to an X-coordinate
• The vertical coordinate corresponds to a Y coordinate
• origin of the coordinates of a computer screen is the upper left
corner.
3By: Tekendra Nath Yogi2/9/2019
Contd….
• IDE used:
– To create graphical applications we will use Turbo C++ 3.0 IDE and
the BGI library.
– BGI (Borland Graphics Interface) is a graphics library which provides
several functions which can be used to create graphical applications.
– The header file “graphics.h” will be used to access the functions of this
library.
4By: Tekendra Nath Yogi2/9/2019
Contd….
• General structure of graphics program in c:
5By: Tekendra Nath Yogi2/9/2019
Contd….
• Graphics mode initialization:
– initgraph() function is used
– Syntax: initgraph(&graphic_driver, &graphics_mode, “path_to_driver”);
– Graphics_driver is a variable which can be any valid identifier specifies the
graphics driver to be used.
– Graphic_mode is also a variable which can be any valid identifier is initialized
to the mode for the particular video adaptor to use.
– The third argument path_to_driver is a string constant the directories
containing .bgi and .char files.
– For automatic initialization DETECT constant is assigned to the graphic_driver
variable.
6By: Tekendra Nath Yogi2/9/2019
Contd….
• At the end of our graphics program, we have to unloads the
graphics drivers and sets the screen back to text mode by
calling closegraph() function.
7By: Tekendra Nath Yogi2/9/2019
Library functions
• Plotting and getting points:
– putpixel():
• plots a point with specified color
• syntax: putpixel(int x, int y, int color);
– getpixel( ):
• gets color of specified pixel
• Syntax : intger_variable = getpixel( int x, int y);
8By: Tekendra Nath Yogi2/9/2019
Contd….
• Example: Program to illustrate the point plotting on the screen
9By: Tekendra Nath Yogi2/9/2019
Contd….
• Example: program to illustrate the concept of getpixel()
function:
10By: Tekendra Nath Yogi2/9/2019
Contd….
• Color table: the colors available depends on the current
graphics driver and mode.
11By: Tekendra Nath Yogi2/9/2019
Contd….
• Changing drawing/foreground and background color:
– Setcolor():
• it change the current drawing color;
• Syntax: setcolor(int color);
– Setbkcolor():
• It change the background color
• Syntax: setbkcolor(int color);
12By: Tekendra Nath Yogi2/9/2019
Contd….
• Example
output1:
output2:
•
13By: Tekendra Nath Yogi2/9/2019
Contd….
• Drawing a line:
– line() function is used to draw line. We will give starting and ending
points of the line.
– Syntax: Line(x1, y1, x2, y2) // draw a line from (x1,y1) to (x2,y2).
14By: Tekendra Nath Yogi2/9/2019
Contd….
• Class work: Draw a line by using putpixel( ) function using for
loop.
15By: Tekendra Nath Yogi2/9/2019
Contd….
• Solution:
16By: Tekendra Nath Yogi2/9/2019
Contd….
• setlinestyle() function:
– sets the style for all lines drawn.
– setlinestyle(int linestyle, unsigned upattern, int thickness);
17By: Tekendra Nath Yogi2/9/2019
Contd….
• linestyle specifies in which of several styles subsequent lines
will be drawn (such as solid, dotted, centered, dashed).
18By: Tekendra Nath Yogi2/9/2019
Contd….
• upattern is a 16-bit pattern that applies only if linestyle is
USERBIT_LINE (4).
• thickness specifies whether the width of subsequent lines
drawn will be normal or thick
19By: Tekendra Nath Yogi2/9/2019
Contd….
• Example:
20By: Tekendra Nath Yogi2/9/2019
Contd….
• Draw circle in C graphics
– circle() function which draws a circle with center at (x, y) and given
radius.
– Syntax : circle(x, y, radius);
– where, (x, y) is center of the circle. 'radius' is the Radius of the circle.
– E.g.,
– Class work: change the color of circle outline.
21By: Tekendra Nath Yogi2/9/2019
Contd….
• Draw ellipse in C graphics:
– ellipse() function draws a ellipse.
– Syntax: ellipse(int x, int y, int start_angle, int end_angle, int x_radius, int y_radius),
– E.g.,
22By: Tekendra Nath Yogi2/9/2019
Contd….
• Drawing arc :
– The function arc( ) is used to draw a arc.
– Syntax: arc(int x, int y, int start_angle, int end_angle, int radius);
– E.g.,
23By: Tekendra Nath Yogi2/9/2019
Contd….
• Draw rectangle:
– The rectangle() function is used to draw rectangle
– Syntax: rectangle(int x1, int y1, int x2, int y2);
– E.g.,:
24By: Tekendra Nath Yogi2/9/2019
Contd….
• Drawing triangle:
– No function available, so draw triangle as a set of line.
– Idea: line(x1, y1, x2, y2);
line(x3,y3, x4, y4);
line(x5, y5, x6,y6);
25By: Tekendra Nath Yogi2/9/2019
Contd….
• Displaying a text in graphics mode:
– Outtext() function to display the string at the current
position
• Syntax: outtext(“Text”);
– Outtextxy()function to display at point(x,y);
• Syntax; outtextxy(x, y, “text”);
26By: Tekendra Nath Yogi2/9/2019
Contd….
• setfillstyle() and floodfill() in C:
– setfillstyle(): sets the current fill pattern and fill color.
• syntax: void setfillstyle(int pattern, int color)
– floodfill() : fill an enclosed area.
• Syntax: floodfill(int x, int y, int border_color)
27By: Tekendra Nath Yogi2/9/2019
Contd….
• Filling circle with certain pattern
28By: Tekendra Nath Yogi2/9/2019
Contd….
29By: Tekendra Nath Yogi2/9/2019
Contd….
• Moving circle with filled pattern in x-direction:
30By: Tekendra Nath Yogi2/9/2019
Contd….
DDAAlgorithm:
1. Input the two line endpoints (x1, y1) and (x2, y2).
2. Plot first point (x1, y1).
3. Calculate constants Δx = (x2- x1), and Δy =(y2-y1).
4. If |Δx| > |Δy|
then steps = |Δx|
else steps = |Δy|
5. Calculate XInc = Δx / steps and YInc = Δy / steps
6. for (k=0; k<steps; k++)
{
x =x+ xInc;
y =y+ yInc;
plot(ROUND(x), ROUND(y));
}
31By: Tekendra Nath Yogi2/9/2019
Contd….
32By: Tekendra Nath Yogi2/9/2019
Contd….
• OUTPUT:
33By: Tekendra Nath Yogi2/9/2019
Bresenham’s line algorithm
• Algorithm:
contd….
34By: Tekendra Nath Yogi2/9/2019
Contd….
• Contd…
contd….
35By: Tekendra Nath Yogi2/9/2019
Contd….
• Contd…
36By: Tekendra Nath Yogi2/9/2019
Contd….
37By: Tekendra Nath Yogi2/9/2019
Contd….
38By: Tekendra Nath Yogi2/9/2019
Contd….
39By: Tekendra Nath Yogi2/9/2019
Contd….
40By: Tekendra Nath Yogi2/9/2019
Contd….
41By: Tekendra Nath Yogi2/9/2019
Contd….
• Output:
42By: Tekendra Nath Yogi2/9/2019
Midpoint circle algorithm
1. Input radius r and circle center (xc, yc) and obtain the first point on the circumference of a
circle centered on the origin as
(x0,y0) = (0,r)
2. Calculate the initial value of the decision parameter as
P0 = 5/4 – r = 1-r
3. At each xk position, starting at k = 0, perform the following test:
If pk < 0, the next point along the circle centered on (0,0) is (xk+1,yk) and
Pk+1 = pk + 2xk+1 + 1
Otherwise, the next point along the circle is (xk+1,yK-1) and
Pk+1 = pk + 2xk+1 + 1 -2yk+1
Where 2xk+1 = 2xk + 2 and 2yk+1 = 2yk-2
4. Determine the symmetry points in the other seven octants.
5. Move each calculated pixel position (x,y) onto the circular path
centered on (xc,yc) and plot the co-ordinate values:
x = x + xc, y = y+yc
6. Repeat steps 3 through 5 until x ≥ y
43By: Tekendra Nath Yogi2/9/2019
Implementation
44By: Tekendra Nath Yogi2/9/2019
Contd….
45By: Tekendra Nath Yogi2/9/2019
Contd….
46By: Tekendra Nath Yogi2/9/2019
Contd….
• Output:
47By: Tekendra Nath Yogi2/9/2019
Midpoint Ellipse algorithm implementation
48By: Tekendra Nath Yogi2/9/2019
Contd….
49By: Tekendra Nath Yogi2/9/2019
Contd….
50By: Tekendra Nath Yogi2/9/2019
Contd….
• Output:
51By: Tekendra Nath Yogi2/9/2019
Area filling
• The process of painting defined area(such as rectangle , circle,
ellipse, etc) with specified color(solid-fill) or pattern(pattern-
fill).
• There are two basic approaches to area filling on raster
systems.
– Scan Fill
– Seed Fill (Boundary Fill, Flood Fill )
52By: Tekendra Nath Yogi2/9/2019
Contd….
53By: Tekendra Nath Yogi2/9/2019
Boundary Fill algorithm implementation
54By: Tekendra Nath Yogi2/9/2019
Contd….
55By: Tekendra Nath Yogi2/9/2019
flood fill algorithm implementation
56By: Tekendra Nath Yogi2/9/2019
Contd….
57By: Tekendra Nath Yogi2/9/2019
Contd….
58By: Tekendra Nath Yogi2/9/2019
Thank You !
59By: Tekendra Nath Yogi2/9/2019

B. SC CSIT Computer Graphics Lab By Tekendra Nath Yogi