Downloaded 371 times

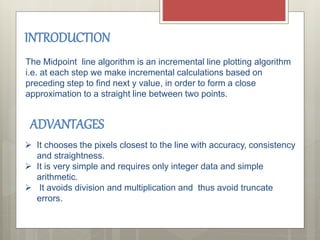
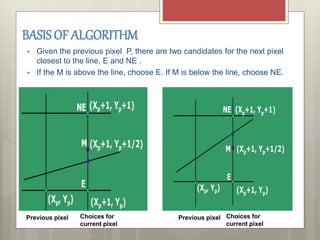
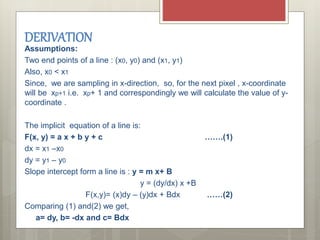
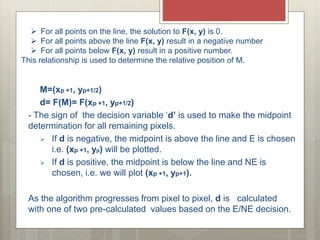
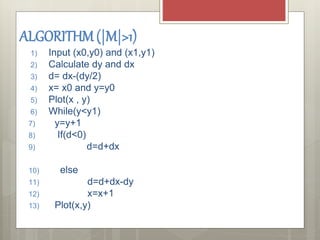
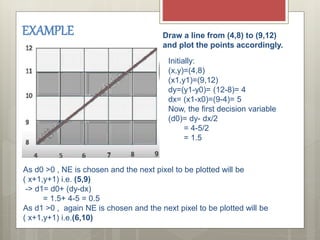
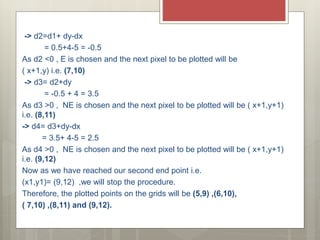


The document describes the midpoint line algorithm for plotting lines on a grid. It works by calculating the midpoint between each set of pixels and determining if it falls above or below the line to choose the next pixel. It only requires integer calculations, avoiding errors from division or multiplication. The algorithm is derived step-by-step and an example is provided to demonstrate how it is implemented to plot a line between two points.


![[Deck] What's New in Spark-Iceberg Integration via DSV2.pptx](https://cdn.slidesharecdn.com/ss_thumbnails/deckwhatsnewinspark-icebergintegrationviadsv2-260210005337-25955b12-thumbnail.jpg?width=640&height=640&fit=bounds)


