Downloaded 451 times
![19
CSE DepartmentVARDHAMAN COLLEGE OF ENGINEERING
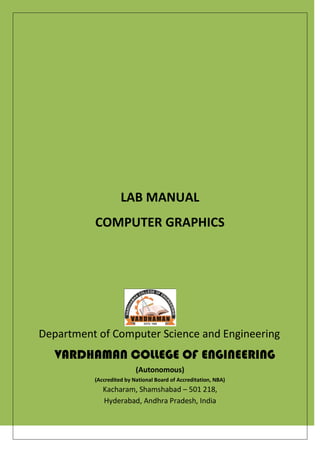
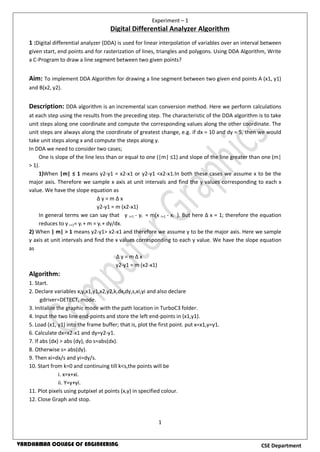
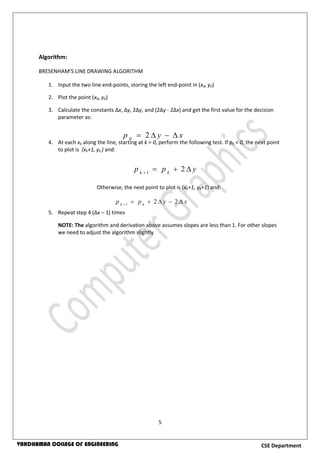
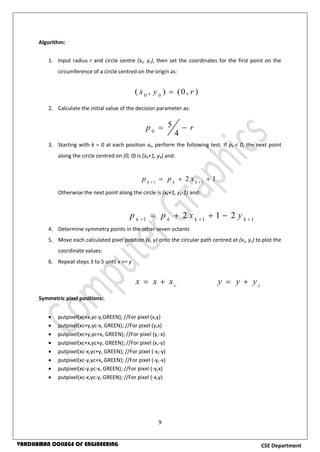
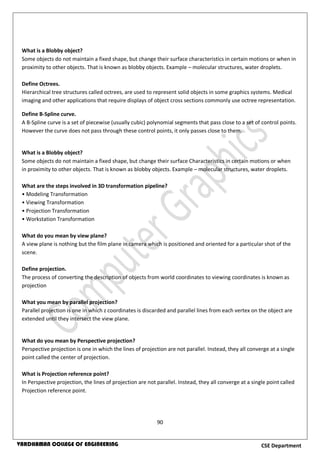
Drawpoly: Drawpoly function is used to draw polygons i.e. triangle, rectangle, pentagon, hexagon
etc.
Syntax: drawpoly( num,points );--num indicates number of vertices of polygon. Num = num+1.
Example: we will draw a triangle using drawpoly, consider for example the array :-
int points[] = { 320, 150, 420, 300, 250, 300, 320, 150};
points array contains coordinates of triangle which are (320, 150), (420, 300) and (250, 300). Note
that last point(320, 150) in array is same as first.
Number of vertices are denoted by num. for any polygon, number of vertices are (num+1). For
triangle, number of vertices are 4.
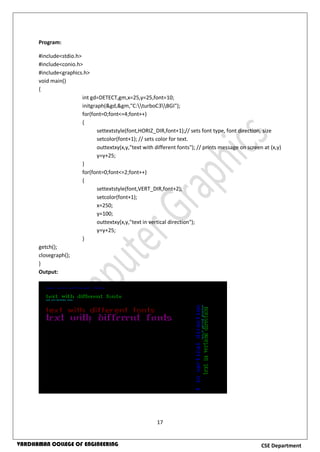
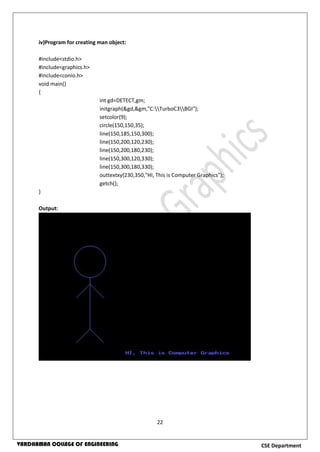
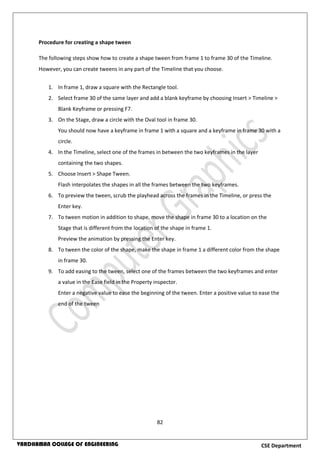
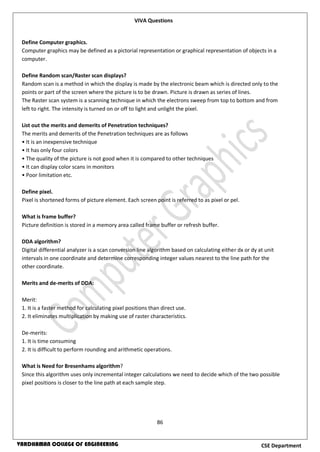
i) Program for creating House shape:
#include<stdio.h>
#include<conio.h>
#include<graphics.h>
void main()
{
int gd=DETECT,gm;
initgraph(&gd,&gm,"C:TURBOC3BGI");
setcolor(5);
rectangle(60,80,150,200);
rectangle(95,140,120,200);
line(60,80,100,15);
line(100,15,150,80);
circle(100,60,10);
getch();
closegraph();
}
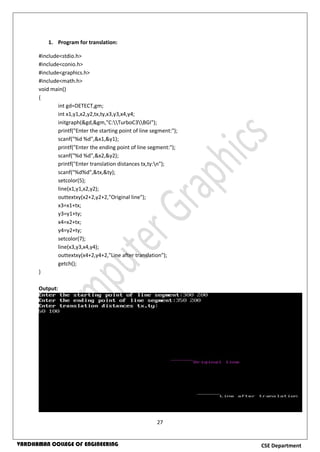
Output:](https://image.slidesharecdn.com/computergraphicslabmanual-161126200024/85/Computer-graphics-lab-manual-23-320.jpg)
![23
CSE DepartmentVARDHAMAN COLLEGE OF ENGINEERING
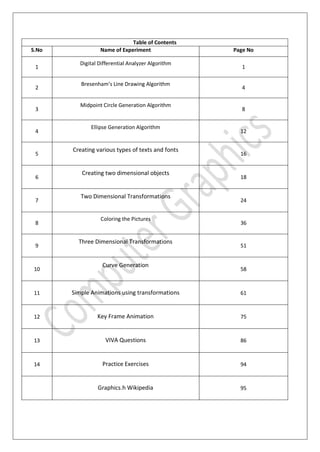
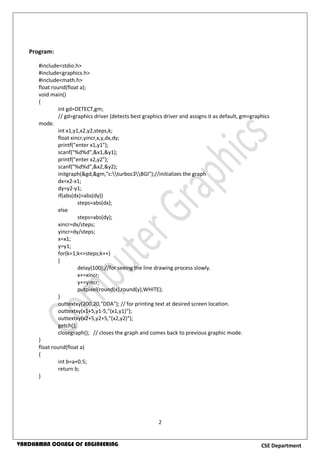
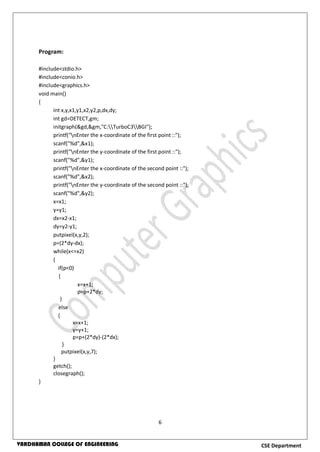
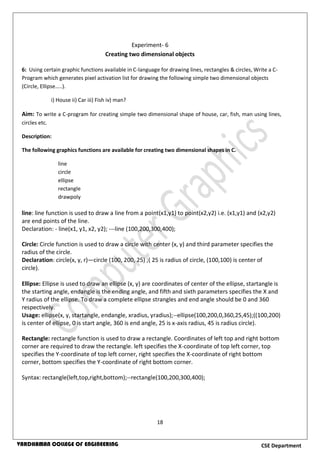
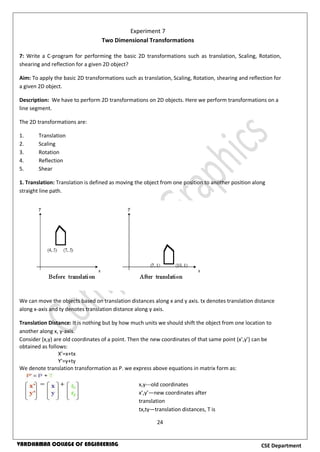
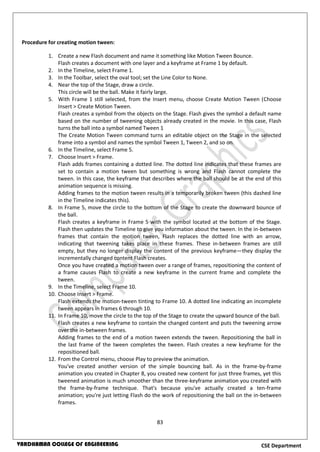
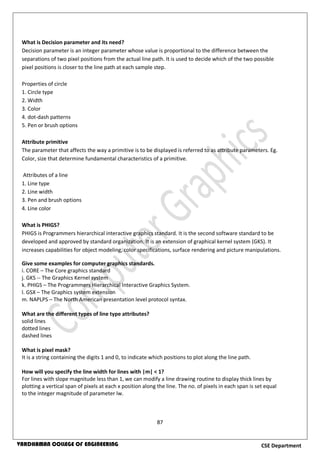
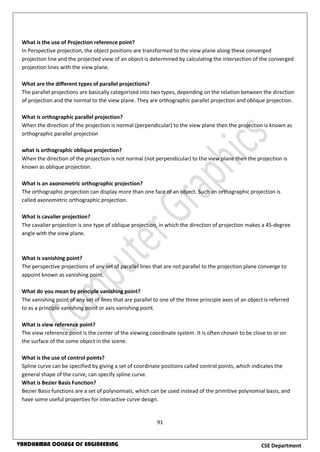
Sample program illustrating the use drawpoly() function:
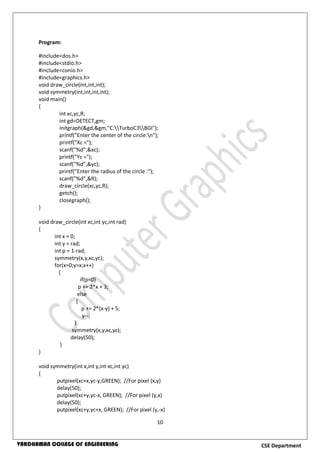
Aim: To draw a triangle using drawpoly() function.
Description:
Using drawpoly (), we can draw any polygon of any number of vertices.
Syntax: drawpoly (num, points);--num indicates number of vertices of polygon. Num = num+1.
Example: we will draw a triangle using drawpoly, consider for example the array:-
int points[] = { 320, 150, 420, 300, 250, 300, 320, 150};
1) Points array contains coordinates of triangle which are (320, 150), (420, 300) and (250, 300). Note
that last point (320, 150) in array is same as first.
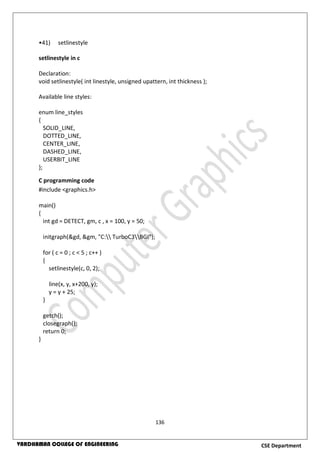
2) Number of vertices is denoted by num. for any polygon, numbers of vertices are (num+1). For
triangle, number of vertices are 4.
Program:
#include <graphics.h>
#include <conio.h>
main()
{
int gd=DETECT,gm,points[]={320,150,420,300,250,300,320,150};
initgraph(&gd, &gm, "C:TurboC3BGI");
drawpoly(4, points);
getch();
closegraph();
return 0;
}
Output:](https://image.slidesharecdn.com/computergraphicslabmanual-161126200024/85/Computer-graphics-lab-manual-27-320.jpg)
![30
CSE DepartmentVARDHAMAN COLLEGE OF ENGINEERING
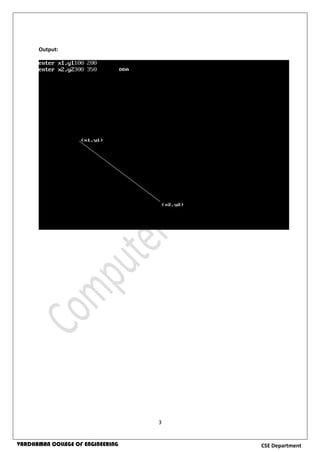
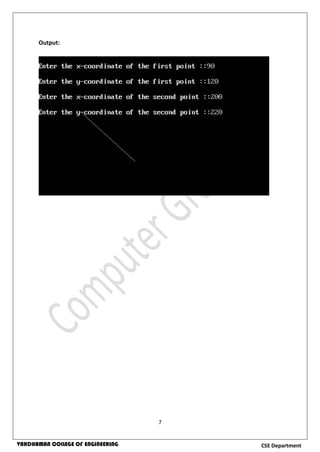
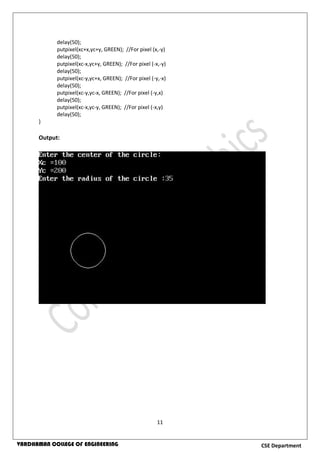
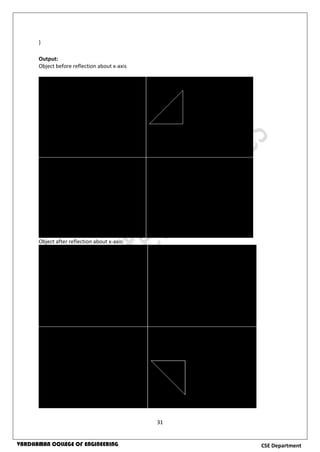
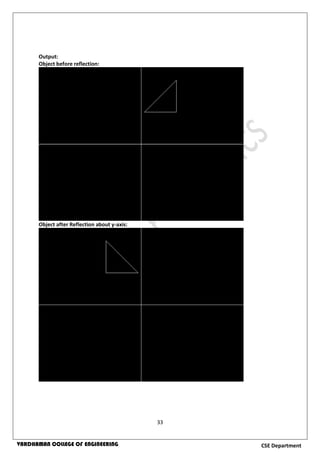
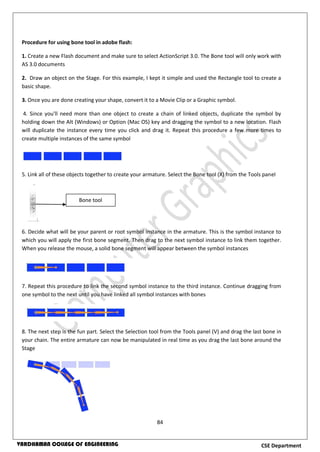
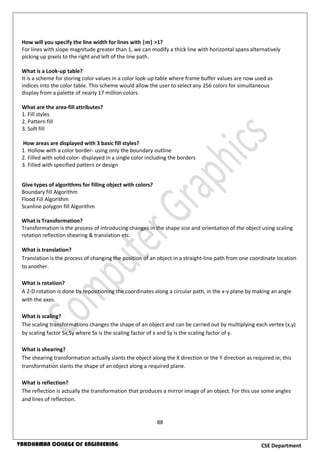
4. Program for reflection along x-axis:
# include <stdio.h>
# include <conio.h>
# include <graphics.h>
# include <math.h>
char IncFlag;
int PolygonPoints[3][2] ={{10,100},{110,100},{110,200}};
void PolyLine()
{
int iCnt;
cleardevice();
line(0,240,640,240);
line(320,0,320,480);
for (iCnt=0; iCnt<3; iCnt++)
{
line(PolygonPoints[iCnt][0],PolygonPoints[iCnt][1],
PolygonPoints[(iCnt+1)%3][0],PolygonPoints[(iCnt+1)%3][1]);
}
}
void Reflect()
{
float Angle;
int iCnt;
int Tx,Ty;
printf("endl");;
for (iCnt=0; iCnt<3; iCnt++)
PolygonPoints[iCnt][1] = (480 - PolygonPoints[iCnt][1]);
}
void main()
{
int gDriver = DETECT, gMode;
int iCnt;
initgraph(&gDriver, &gMode, "C:TurboC3BGI");
for (iCnt=0; iCnt<3; iCnt++)
{
PolygonPoints[iCnt][0] += 320;
PolygonPoints[iCnt][1] = 240 - PolygonPoints[iCnt][1];
}
PolyLine();
getch();
Reflect();
PolyLine();
getch();](https://image.slidesharecdn.com/computergraphicslabmanual-161126200024/85/Computer-graphics-lab-manual-34-320.jpg)
![32
CSE DepartmentVARDHAMAN COLLEGE OF ENGINEERING
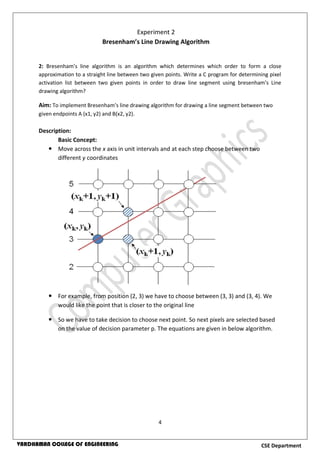
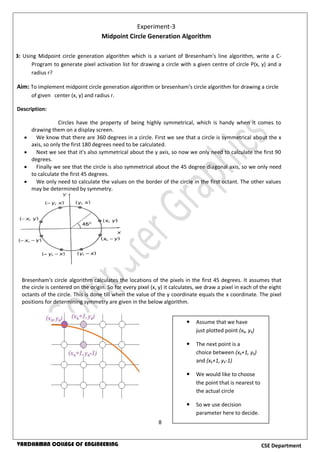
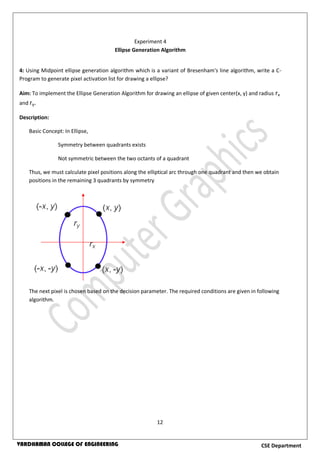
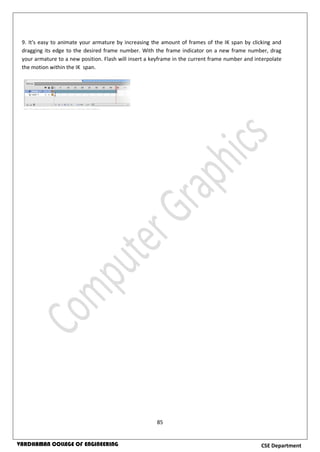
5. Program for Reflection about y-axis:
# include <stdio.h>
# include <conio.h>
# include <graphics.h>
# include <math.h>
char IncFlag;
int PolygonPoints[3][2] =
{{10,100},{110,100},{110,200}};
void PolyLine()
{
int iCnt;
cleardevice();
line(0,240,640,240);
line(320,0,320,480);
for (iCnt=0; iCnt<3; iCnt++)
{
line(PolygonPoints[iCnt][0],PolygonPoints[iCnt][1],
PolygonPoints[(iCnt+1)%3][0],PolygonPoints[(iCnt+1)%3][1]);
}
}
void Reflect()
{
float Angle;
int iCnt;
int Tx,Ty;
for (iCnt=0; iCnt<3; iCnt++)
PolygonPoints[iCnt][0] = (640 - PolygonPoints[iCnt][0]);
}
void main()
{
int gd = DETECT, gm;
int iCnt;
initgraph(&gd, &gm, "C:TurboC3BGI");
for (iCnt=0; iCnt<3; iCnt++)
{
PolygonPoints[iCnt][0] += 320;
PolygonPoints[iCnt][1] = 240 - PolygonPoints[iCnt][1];
}
PolyLine();
getch();
Reflect();
PolyLine();
getch();
}](https://image.slidesharecdn.com/computergraphicslabmanual-161126200024/85/Computer-graphics-lab-manual-36-320.jpg)
![44
CSE DepartmentVARDHAMAN COLLEGE OF ENGINEERING
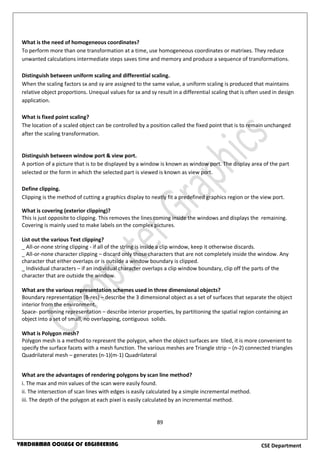
Program for scan line polygon fill algorithm:
#include <stdio.h>
#include <conio.h>
#include <graphics.h>
void main()
{
int n,i,j,k,gd,gm,dy,dx;
int x,y,temp;
int a[20][2],xi[20];
float slope[20];
clrscr();
printf("nntEnter the no. of edges of polygon : ");
scanf("%d",&n);
printf("nntEnter the cordinates of polygon :nnn ");
for(i=0;i<n;i++)
{
printf("tX%d Y%d : ",i,i);
scanf("%d %d",&a[i][0],&a[i][1]);
}
a[n][0]=a[0][0];
a[n][1]=a[0][1];
detectgraph(&gd,&gm);
initgraph(&gd,&gm,"C:TurboC3BGI");
/*- draw polygon -*/
for(i=0;i<n;i++)
{
line(a[i][0],a[i][1],a[i+1][0],a[i+1][1]);
}
getch();
for(i=0;i<n;i++)
{
dy=a[i+1][1]-a[i][1];
dx=a[i+1][0]-a[i][0];
if(dy==0) slope[i]=1.0;
if(dx==0) slope[i]=0.0;
if((dy!=0)&&(dx!=0)) /*- calculate inverse slope -*/
{
slope[i]=(float) dx/dy;
}
}
for(y=0;y< 480;y++)
{
k=0;
for(i=0;i<n;i++)](https://image.slidesharecdn.com/computergraphicslabmanual-161126200024/85/Computer-graphics-lab-manual-48-320.jpg)
![45
CSE DepartmentVARDHAMAN COLLEGE OF ENGINEERING
{
if( ((a[i][1]<=y)&&(a[i+1][1]>y))||
((a[i][1]>y)&&(a[i+1][1]<=y)))
{
xi[k]=(int)(a[i][0]+slope[i]*(y-a[i][1]));
k++;
}
}
for(j=0;j<k-1;j++) /*- Arrange x-intersections in order -*/
for(i=0;i<k-1;i++)
{
if(xi[i]>xi[i+1])
{
temp=xi[i];
xi[i]=xi[i+1];
xi[i+1]=temp;
}
}
setcolor(3);
for(i=0;i<k;i+=2)
{
line(xi[i],y,xi[i+1]+1,y);
getch();
}
}
}
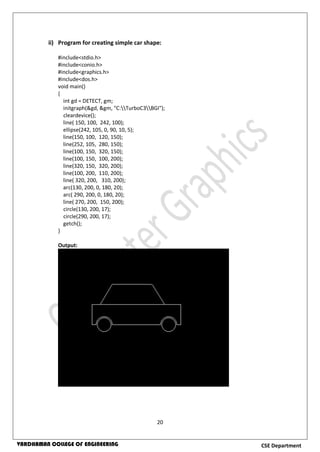
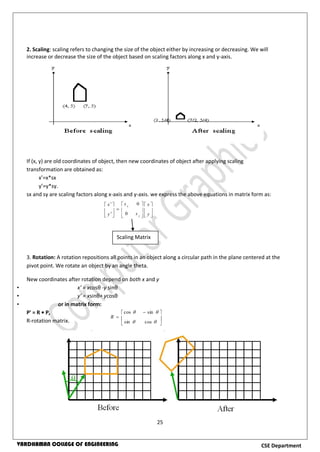
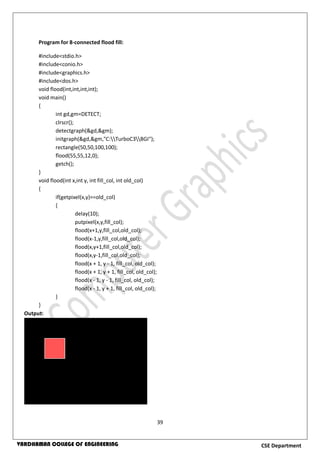
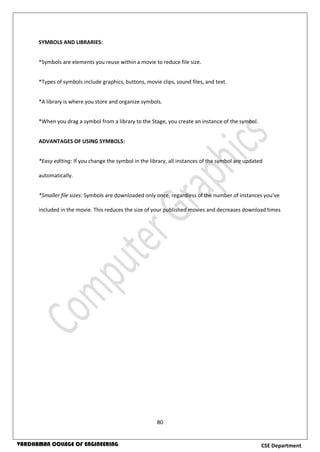
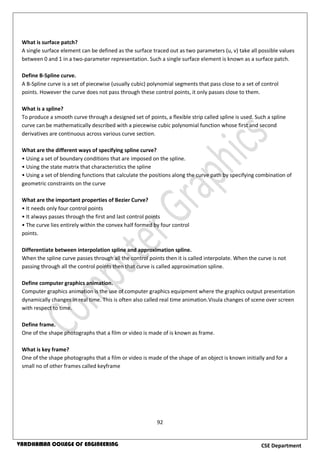
Output:
Filled
polygon](https://image.slidesharecdn.com/computergraphicslabmanual-161126200024/85/Computer-graphics-lab-manual-49-320.jpg)
![46
CSE DepartmentVARDHAMAN COLLEGE OF ENGINEERING
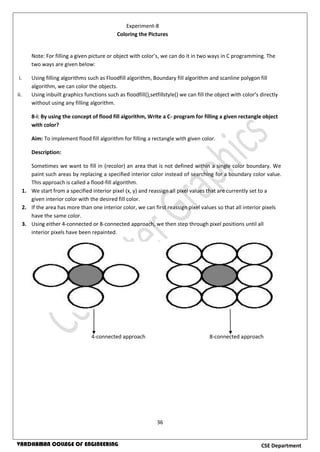
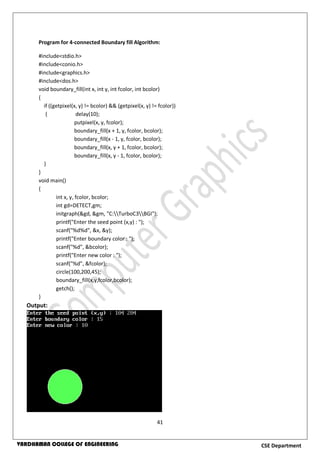
8-iv: Different graphic Functions are available in C-Language for filling a given object with colors. Using
the graphic functions, Write a C program for
i. Filling a circle with any color?
ii. Filling a polygon with any color?
Aim: To fill a given object with colors by using inbuilt graphics functions.
Description:
For filling a given object with colors, we have the following graphics functions.
1. Fillpoly
2. Floodfill
3. Setfillstyle
4. Setcolor
5. fillellipse
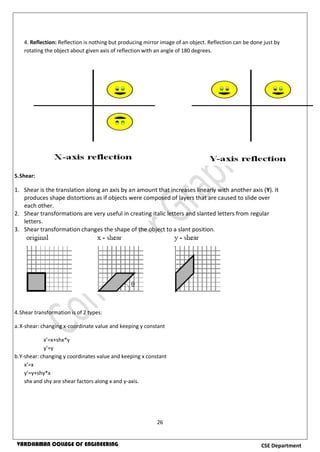
Fillpoly: Fillpoly function is used to draw a polygon of any number of vertices and fills that polygon with
colors. It requires same arguments as drawpoly function. fillpoly fills the polygon by using current fill
pattern and color which can be changed using setfillstyle function.
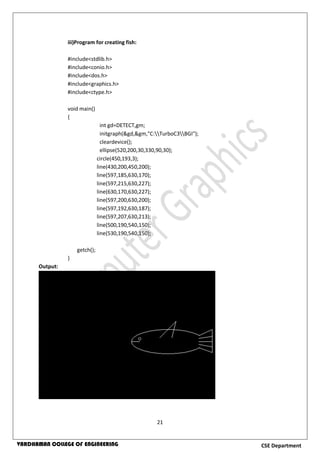
Program illustrating the use of Fillpoly function:
#include <graphics.h>
#include <conio.h>
main()
{
int gd=DETECT,gm,points[]={100,200,120,230,150,260,120,290,100,330,80,290,50,260,80,230,100,200};
initgraph(&gd, &gm, "C:TurboC3BGI");
setfillstyle(SOLID_FILL,10); //giving the type of fill
fillpoly(9, points); //drawing a polygon of 9 vertices with coordinates defined in points array and filling
with color defined in setfillstyle function.
getch();
closegraph();
return 0;
}
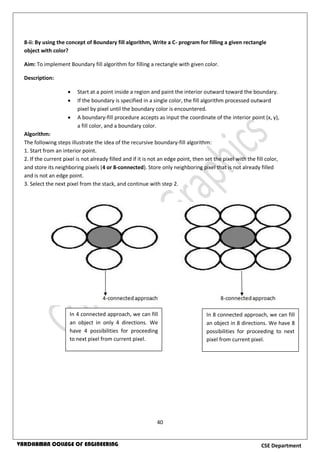
Output:](https://image.slidesharecdn.com/computergraphicslabmanual-161126200024/85/Computer-graphics-lab-manual-50-320.jpg)
![48
CSE DepartmentVARDHAMAN COLLEGE OF ENGINEERING
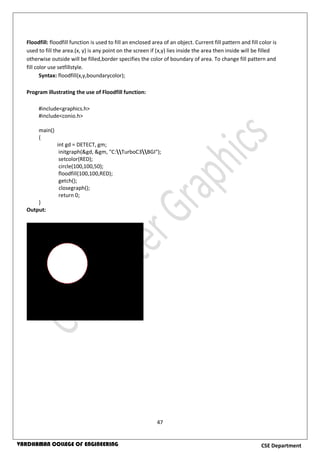
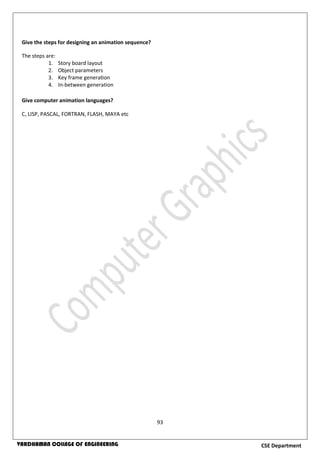
Setfillstyle: setfillstyle function sets the current fill pattern and fill color.
Syntax: setfillstyle( pattern,color);
1) Here, pattern refers to type of filling. The pattern value may be integer value or its corresponding
pattern name in CAPS. The patterns available are listed below:
EMPTY_FILL----0,
SOLID_FILL----1,
LINE_FILL-----2,
LTSLASH_FILL--3,
SLASH_FILL----4,
BKSLASH_FILL--5,
LTBKSLASH_FILL-6,
HATCH_FILL-----7,
XHATCH_FILL----8,
INTERLEAVE_FILL-9,
WIDE_DOT_FILL--10,
CLOSE_DOT_FILL-11,
USER_FILL------12.[ integer value from 0 to 12 refers to its corresponding pattern name]
2) Color refers to fill color .The below table shows color names and their equivalent integer values.
Program illustrating the use of setfillstyle:
#include<graphics.h>
#include<conio.h>
main()
{
int gd = DETECT, gm;
initgraph(&gd, &gm, "C:TurboC3BGI");
setfillstyle(XHATCH_FILL, RED);
circle(100, 100, 50);
floodfill(100, 100, WHITE);
getch();
closegraph();
}
Output](https://image.slidesharecdn.com/computergraphicslabmanual-161126200024/85/Computer-graphics-lab-manual-52-320.jpg)

![59
CSE DepartmentVARDHAMAN COLLEGE OF ENGINEERING
Program for Bezier curve:
#include <stdio.h>
#include <stdlib.h>
#include <graphics.h>
#include <math.h>
void bezier (int x[4], int y[4])
{
int gd = DETECT, gm;
int i;
double t;
initgraph (&gd, &gm, "C:TurboC3BGI");
for (t = 0.0; t < 1.0; t += 0.0005)
{
double xt = pow (1-t, 3) * x[0] + 3 * t * pow (1-t, 2) * x[1] +
3 * pow (t, 2) * (1-t) * x[2] + pow (t, 3) * x[3];
double yt = pow (1-t, 3) * y[0] + 3 * t * pow (1-t, 2) * y[1] +
3 * pow (t, 2) * (1-t) * y[2] + pow (t, 3) * y[3];
putpixel (xt, yt, WHITE);
}
for (i=0; i<4; i++)
putpixel (x[i], y[i], YELLOW);
getch();
closegraph();
return;
}
void main()
{
int x[4], y[4];
int i;
printf ("Enter the x- and y-coordinates of the four control points.n");
for (i=0; i<4; i++)
scanf ("%d%d", &x[i], &y[i]);
bezier (x, y);
}](https://image.slidesharecdn.com/computergraphicslabmanual-161126200024/85/Computer-graphics-lab-manual-63-320.jpg)
![66
CSE DepartmentVARDHAMAN COLLEGE OF ENGINEERING
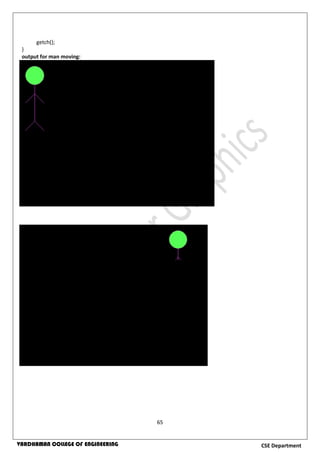
iii.program for windmill rotation:
#include<stdio.h>
#include<graphics.h>
#include<math.h>
void wind(float x[7],float y[7]);
void main()
{
int gd=DETECT,gm;
float x[7],y[7],maxx,maxy,xw1,yw1,xw2,yw2;
float theta=30;
initgraph(&gd,&gm,"C:TurboC3BGI");
maxx=getmaxx();
maxy=getmaxy();
x[0]=maxx/2;
y[0]=maxy/2;
x[1]=y[4]=x[2]=-90;
y[6]=y[5]=y[1]=60;
y[2]=35;
y[3]=-100;
x[4]=20;
x[3]=0;
x[5]=90;
x[6]=65;
theta=theta*22/7/180;
while(kbhit()==0)
{
wind(x,y);
xw1=cos(theta)*x[1]+sin(theta)*y[1];
yw1=-sin(theta)*x[1]+cos(theta)*y[1];
xw2=cos(theta)*x[2]+sin(theta)*y[2];
yw2=-sin(theta)*x[2]+cos(theta)*y[2];
x[1]=xw1;
y[1]=yw1;
x[2]=xw2;
y[2]=yw2;
xw1=cos(theta)*x[3]+sin(theta)*y[3];
yw1=-sin(theta)*x[3]+cos(theta)*y[3];
xw2=cos(theta)*x[4]+sin(theta)*y[4];
yw2=-sin(theta)*x[4]+cos(theta)*y[4];
x[3]=xw1;
y[3]=yw1;
x[4]=xw2;
y[4]=yw2;
xw1=cos(theta)*x[5]+sin(theta)*y[5];
yw1=-sin(theta)*x[5]+cos(theta)*y[5];
xw2=cos(theta)*x[6]+sin(theta)*y[6];
yw2=-sin(theta)*x[6]+cos(theta)*y[6];
x[5]=xw1;
y[5]=yw1;
x[6]=xw2;
y[6]=yw2;](https://image.slidesharecdn.com/computergraphicslabmanual-161126200024/85/Computer-graphics-lab-manual-70-320.jpg)
![67
CSE DepartmentVARDHAMAN COLLEGE OF ENGINEERING
delay(50);
cleardevice();
}
closegraph();
}
void wind(float x[7],float y[7])
{
cleardevice();
line(x[0],y[0],x[0]-50,y[0]+200);
line(x[0],y[0],x[0]+50,y[0]+200);
line(x[0]-60,y[0]+200,x[0]+60,y[0]+200);
line(x[0],y[0],x[0]+x[1],y[0]-y[1]);
line(x[0],y[0],x[0]+x[2],y[0]-y[2]);
line(x[0]+x[1],y[0]-y[1],x[0]+x[2],y[0]-y[2]);
line(x[0],y[0],x[0]+x[3],y[0]-y[3]);
line(x[0],y[0],x[0]+x[4],y[0]-y[4]);
line(x[0]+x[3],y[0]-y[3],x[0]+x[4],y[0]-y[4]);
line(x[0],y[0],x[0]+x[5],y[0]-y[5]);
line(x[0],y[0],x[0]+x[6],y[0]-y[6]);
line(x[0]+x[5],y[0]-y[5],x[0]+x[6],y[0]-y[6]);
}
Output:](https://image.slidesharecdn.com/computergraphicslabmanual-161126200024/85/Computer-graphics-lab-manual-71-320.jpg)
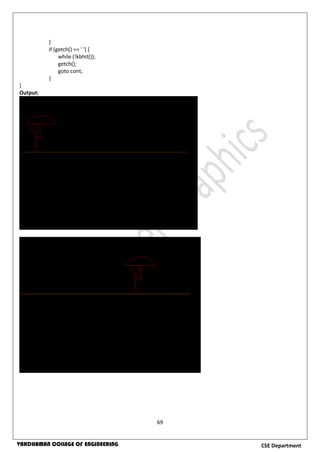
![70
CSE DepartmentVARDHAMAN COLLEGE OF ENGINEERING
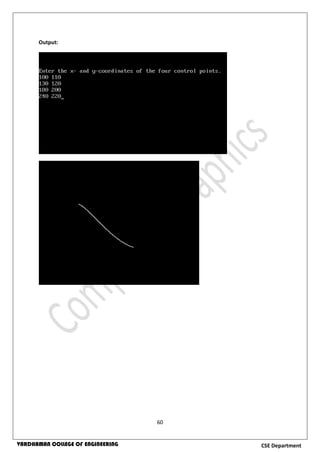
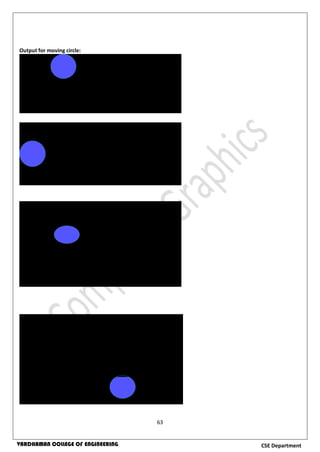
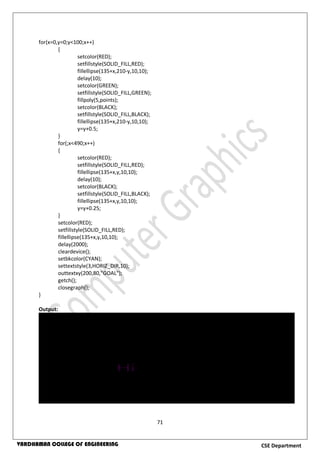
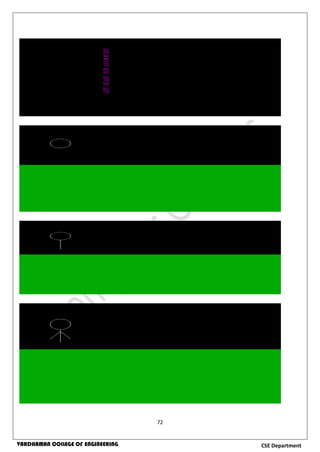
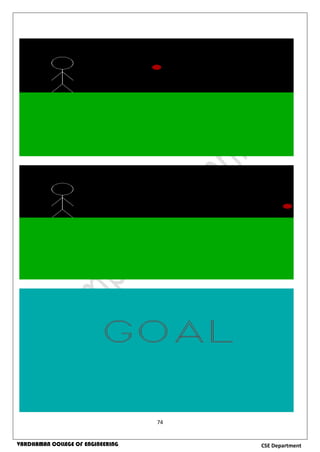
vi. program for simple animation of football goal:
#include<stdio.h>
#include<conio.h>
#include<graphics.h>
#include<dos.h>
void main()
{
int x=0,gd=DETECT,gm,points[]={0,220,1600,220,1600,900,0,900,0,220};
float y=0;
initgraph(&gd,&gm,"C:TURBOC3BGI");
setcolor(MAGENTA);
settextstyle(6,HORIZ_DIR,6);
outtextxy(200,250,"Hi");
delay(1000);
cleardevice();
settextstyle(7,VERT_DIR,1);
outtextxy(200,50,"GET READY FOR ANIMATION");
delay(1000);
cleardevice();
setcolor(GREEN);
setfillstyle(SOLID_FILL,GREEN);
fillpoly(5,points);
setcolor(WHITE);
circle(100,100,25);
delay(1000);
line(100,125,100,185);
delay(1000);
line(100,135,125,170);
delay(1000);
line(100,135,75,170);
delay(1000);
line(100,185,125,220);
delay(1000);
line(100,185,75,220);
delay(1000);
setcolor(RED);
setfillstyle(SOLID_FILL,RED);
fillellipse(135+x,210-y,10,10);
for(x=0;x<50;x++)
{
setcolor(WHITE);
line(100,185,75+x,220-y);
delay(100);
setcolor(BLACK);
line(100,185,75+x,220-y);
y=y+0.25;
}
setcolor(WHITE);
line(100,185,125,220);
line(100,185,75,220);](https://image.slidesharecdn.com/computergraphicslabmanual-161126200024/85/Computer-graphics-lab-manual-74-320.jpg)
![102
CSE DepartmentVARDHAMAN COLLEGE OF ENGINEERING
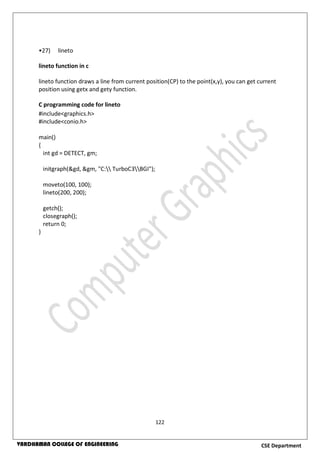
• 7) drawpoly
drawpoly function in c
Drawpoly function is used to draw polygons i.e. triangle, rectangle, pentagon, hexagon etc.
Declaration :- void drawpoly( int num, int *polypoints );
num indicates (n+1) number of points where n is the number of vertices in a polygon,
polypoints points to a sequence of (n*2) integers . Each pair of integers gives x and y
coordinates of a point on the polygon. We specify (n+1) points as first point coordinates
should be equal to (n+1)th
to draw a complete figure.
To understand more clearly we will draw a triangle using drawpoly, consider for example
the array :-
int points[] = { 320, 150, 420, 300, 250, 300, 320, 150};
points array contains coordinates of triangle which are (320, 150), (420, 300) and (250, 300).
Note that last point(320, 150) in array is same as first. See the program below and then its
output, it will further clear your understanding.
C program for drawpoly
#include <graphics.h>
#include <conio.h>
main()
{
int gd=DETECT,gm,points[]={320,150,420,300,250,300,320,150};
initgraph(&gd, &gm, "C: TurboC3BGI");
drawpoly(4, points);
getch();
closegraph();
return 0;
}](https://image.slidesharecdn.com/computergraphicslabmanual-161126200024/85/Computer-graphics-lab-manual-106-320.jpg)
![105
CSE DepartmentVARDHAMAN COLLEGE OF ENGINEERING
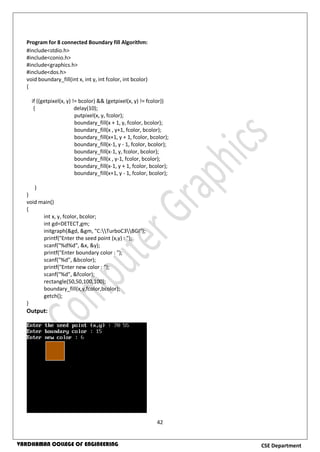
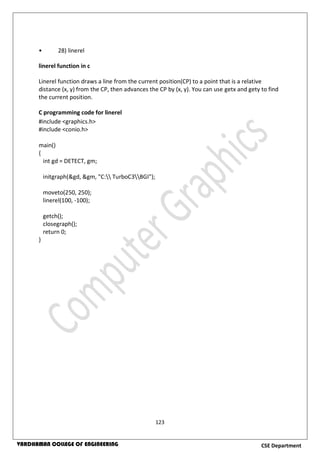
• 10) fillpoly
fillpoly function in c
Fillpoly function draws and fills a polygon. It require same arguments as drawpoly.
Declaration :- void drawpoly( int num, int *polypoints );
For details of arguments see drawpoly.
fillpoly fills using current fill pattern and color which can be changed using setfillstyle.
C programming code
#include <graphics.h>
#include <conio.h>
main()
{
int gd=DETECT,gm,points[]={320,150,440,340,230,340,320,150};
initgraph(&gd, &gm, "C: TurboC3BGI");
fillpoly(4, points);
getch();
closegraph();
return 0;
}](https://image.slidesharecdn.com/computergraphicslabmanual-161126200024/85/Computer-graphics-lab-manual-109-320.jpg)
![107
CSE DepartmentVARDHAMAN COLLEGE OF ENGINEERING
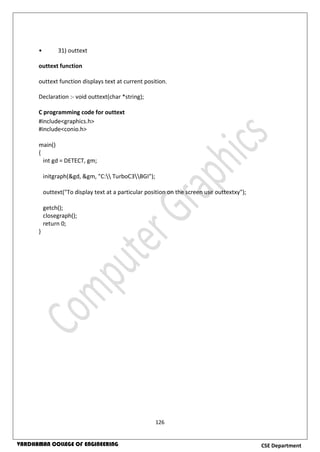
•12) getarccords
getarcoords function in c
Declaration :- void getarccoords(struct arccoordstype *var);
getarccoords function is used to get coordinates of arc which is drawn most recently.
arccoordstype is a predefined structure which is defined as follows:
struct arccoordstype
{
int x, y; /* center point of arc */
int xstart, ystart; /* start position */
int xend, yend; /* end position */
};
address of a structure variable of type arccoordstype is passed to function getarccoords.
C program of getarccoords
#include<graphics.h>
#include<conio.h>
#include<stdio.h>
main()
{
int gd = DETECT, gm;
struct arccoordstype a;
char arr[100];
initgraph(&gd, &gm,"C: TurboC3BGI");
arc(250,200,0,90,100);
getarccoords(&a);
sprintf(arr,"(%d, %d)",a.xstart,a.ystart);
outtextxy(360,195,arr);
sprintf(arr,"(%d, %d)",a.xend,a.yend);
outtextxy(245,85,arr);
getch();
closegraph();
return 0;
}](https://image.slidesharecdn.com/computergraphicslabmanual-161126200024/85/Computer-graphics-lab-manual-111-320.jpg)
![108
CSE DepartmentVARDHAMAN COLLEGE OF ENGINEERING
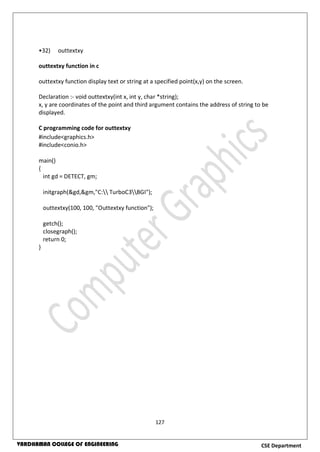
• 13) getbkcolor
getbkcolor function in c
getbkcolor function returns the current background color
Declaration : int getbkcolor();
e.g. color = getbkcolor(); // color is an int variable
if current background color is GREEN then color will be 2.
C program for getbkcolor
#include<graphics.h>
#include<conio.h>
main()
{
int gd = DETECT, gm, bkcolor;
char a[100];
initgraph(&gd,&gm,"C: TurboC3BGI");
bkcolor = getbkcolor();
sprintf(a,"Current background color = %d", bkcolor);
outtextxy( 10, 10, a);
getch();
closegraph();
return 0;
}](https://image.slidesharecdn.com/computergraphicslabmanual-161126200024/85/Computer-graphics-lab-manual-112-320.jpg)
![109
CSE DepartmentVARDHAMAN COLLEGE OF ENGINEERING
• 14) getcolor
getcolor function
getcolor function returns the current drawing color.
Declaration : int getcolor();
e.g. a = getcolor(); // a is an integer variable
if current drawing color is WHITE then a will be 15.
C programming code for getcolor
#include<graphics.h>
#include<conio.h>
main()
{
int gd = DETECT, gm, drawing_color;
char a[100];
initgraph(&gd,&gm,"C: TurboC3BGI");
drawing_color = getcolor();
sprintf(a,"Current drawing color = %d", drawing_color);
outtextxy( 10, 10, a );
getch();
closegraph();
return 0;
}](https://image.slidesharecdn.com/computergraphicslabmanual-161126200024/85/Computer-graphics-lab-manual-113-320.jpg)
![112
CSE DepartmentVARDHAMAN COLLEGE OF ENGINEERING
17) getmaxcolor
getmaxcolor function
getmaxcolor function returns maximum color value for current graphics mode and driver.
Total number of colors available for current graphics mode and driver are ( getmaxcolor() +
1 ) as color numbering starts from zero.
Declaration :- int getmaxcolor();
C program of getmaxcolor
#include<graphics.h>
#include<conio.h>
main()
{
int gd = DETECT, gm, max_colors;
char a[100];
initgraph(&gd,&gm,"C: TurboC3BGI");
max_colors = getmaxcolor();
sprintf(a,"Maximum number of colors for current graphics mode and driver =
%d",max_colors+1);
outtextxy(0, 40, a);
getch();
closegraph();
return 0;
}](https://image.slidesharecdn.com/computergraphicslabmanual-161126200024/85/Computer-graphics-lab-manual-116-320.jpg)
![113
CSE DepartmentVARDHAMAN COLLEGE OF ENGINEERING
•18) getmaxx
getmaxx function in c
getmaxx function returns the maximum X coordinate for current graphics mode and driver.
Declaration :- int getmaxx();
C program for getmaxx
#include<graphics.h>
#include<conio.h>
main()
{
int gd = DETECT, gm, max_x;
char array[100];
initgraph(&gd,&gm,"C: TurboC3BGI");
max_x = getmaxx();
sprintf(array, "Maximum X coordinate for current graphics mode and driver =
%d.",max_x);
outtext(array);
getch();
closegraph();
return 0;
}](https://image.slidesharecdn.com/computergraphicslabmanual-161126200024/85/Computer-graphics-lab-manual-117-320.jpg)
![114
CSE DepartmentVARDHAMAN COLLEGE OF ENGINEERING
• 19 )getmaxy
getmaxy function in c
getmaxy function returns the maximum Y coordinate for current graphics mode and driver.
Declaration :- int getmaxy();
C program for getmaxy
#include<graphics.h>
#include<conio.h>
main()
{
int gd = DETECT, gm, max_y;
char array[100];
initgraph(&gd,&gm,"C: TurboC3BGI");
max_y = getmaxy();
sprintf(array, "Maximum Y coordinate for current graphics mode and driver is =
%d.",max_y);
outtext(array);
getch();
closegraph();
return 0;
}](https://image.slidesharecdn.com/computergraphicslabmanual-161126200024/85/Computer-graphics-lab-manual-118-320.jpg)
![115
CSE DepartmentVARDHAMAN COLLEGE OF ENGINEERING
•20) getpixel
getpixel function in c
getpixel function returns the color of pixel present at location(x, y).
Declaration :- int getpixel(int x, int y);
C program for getpixel
#include<graphics.h>
#include<conio.h>
main()
{
int gd = DETECT, gm, color;
char array[50];
initgraph(&gd,&gm,"C: TurboC3BGI");
color = getpixel(0, 0);
sprintf(array,"color of pixel at (0,0) = %d",color);
outtext(array);
getch();
closegraph();
return 0;
}](https://image.slidesharecdn.com/computergraphicslabmanual-161126200024/85/Computer-graphics-lab-manual-119-320.jpg)
![116
CSE DepartmentVARDHAMAN COLLEGE OF ENGINEERING
•21) getx
getx function in c
getx function returns the X coordinate of current position.
Declaration :- int getx();
C program of getx
#include <graphics.h>
#include <conio.h>
main()
{
int gd = DETECT, gm;
char array[100];
initgraph(&gd, &gm, "C: TurboC3BGI");
sprintf(array, "Current position of x = %d",getx());
outtext(array);
getch();
closegraph();
return 0;
}](https://image.slidesharecdn.com/computergraphicslabmanual-161126200024/85/Computer-graphics-lab-manual-120-320.jpg)
![117
CSE DepartmentVARDHAMAN COLLEGE OF ENGINEERING
•22) gety
gety function in c
gety function returns the y coordinate of current position.
Declaration :- int gety();
C programming source code for gety
#include <graphics.h>
#include <conio.h>
main()
{
int gd = DETECT, gm, y;
char array[100];
initgraph(&gd, &gm, "C: TurboC3BGI");
y = gety();
sprintf(array, "Current position of y = %d", y);
outtext(array);
getch();
closegraph();
return 0;
}](https://image.slidesharecdn.com/computergraphicslabmanual-161126200024/85/Computer-graphics-lab-manual-121-320.jpg)
![120
CSE DepartmentVARDHAMAN COLLEGE OF ENGINEERING
• 25) imagesize
imagesize function in c
imagesize function returns the number of bytes required to store a bitimage. This function is
used when we are using getimage.
Declaration:- unsigned int imagesize(int left, int top, int right, int bottom);
C programming code for imagesize
#include <graphics.h>
#include <conio.h>
main()
{
int gd = DETECT, gm, bytes;
char array[100];
initgraph(&gd, &gm, "C: TurboC3BGI");
circle(200, 200, 50);
line(150, 200, 250, 200);
line(200, 150, 200, 250);
bytes = imagesize(150, 150, 250, 250);
sprintf(array, "Number of bytes required to store required area = %d", bytes);
outtextxy(10, 280, array);
getch();
closegraph();
return 0;
}](https://image.slidesharecdn.com/computergraphicslabmanual-161126200024/85/Computer-graphics-lab-manual-124-320.jpg)
![124
CSE DepartmentVARDHAMAN COLLEGE OF ENGINEERING
• 29) moveto
moveto function in c
moveto function changes the current position (CP) to (x, y)
Declaration :- void moveto(int x, int y);
C programming code for moveto
#include <graphics.h>
#include <conio.h>
main()
{
int gd = DETECT, gm;
char msg[100];
initgraph(&gd, &gm, "C: TurboC3BGI");
sprintf(msg, "X = %d, Y = %d",getx(),gety());
outtext(msg);
moveto(50, 50);
sprintf(msg, "X = %d, Y = %d", getx(), gety());
outtext(msg);
getch();
closegraph();
return 0;
}](https://image.slidesharecdn.com/computergraphicslabmanual-161126200024/85/Computer-graphics-lab-manual-128-320.jpg)
![125
CSE DepartmentVARDHAMAN COLLEGE OF ENGINEERING
•30) moverel
moverel function in c
moverel function moves the current position to a relative distance.
Declaration :- void moverel(int x, int y);
C programming code for moverel
#include <graphics.h>
#include <conio.h>
main()
{
int gd = DETECT, gm, x, y;
char message[100];
initgraph(&gd, &gm, "C: TurboC3BGI");
moveto(100, 100);
moverel(100, -100);
x = getx();
y = gety();
sprintf(message, "Current x position = %d and y position = %d", x, y);
outtextxy(10, 10, message);
getch();
closegraph();
return 0;
}](https://image.slidesharecdn.com/computergraphicslabmanual-161126200024/85/Computer-graphics-lab-manual-129-320.jpg)
![139
CSE DepartmentVARDHAMAN COLLEGE OF ENGINEERING
•44) textheight
textheight function in c
textheight function returns the height of a string in pixels.
Declaration :- int textheight(char *string);
C programming source code for textheight
#include<graphics.h>
#include<conio.h>
main()
{
int gd = DETECT, gm, height;
char array[100];
initgraph(&gd, &gm, "C:TCBGI");
height = textheight("C programming");
sprintf(array,"Textheight = %d",height);
outtext(array);
getch();
closegraph();
return 0;
}](https://image.slidesharecdn.com/computergraphicslabmanual-161126200024/85/Computer-graphics-lab-manual-143-320.jpg)
![140
CSE DepartmentVARDHAMAN COLLEGE OF ENGINEERING
•45) textwidth
textwidth function in c
textwidth function returns the width of a string in pixels.
Declaration :- int textwidth(char *string);
C programming source code for textwidth
#include<graphics.h>
#include<conio.h>
main()
{
int gd = DETECT, gm, width;
char array[100];
initgraph(&gd, &gm, "C:TCBG I");
width = textwidth("C programming");
sprintf(array,"Textwidth = %d",width);
outtext(array);
getch();
closegraph();
return 0;
}](https://image.slidesharecdn.com/computergraphicslabmanual-161126200024/85/Computer-graphics-lab-manual-144-320.jpg)

The document provides a lab manual for computer graphics experiments in C language. It includes experiments on digital differential analyzer algorithm, Bresenham's line drawing algorithm, midpoint circle generation algorithm, ellipse generation algorithm, text and shape creation, 2D and 3D transformations, curve generation, and basic animations. It outlines the hardware and software requirements to run the experiments and provides background, algorithms, sample programs and outputs for each experiment.


![Chapter 3 - Part 1 [Autosaved].pptx](https://cdn.slidesharecdn.com/ss_thumbnails/chapter3-part1autosaved-230109040832-9344385c-thumbnail.jpg?width=640&height=640&fit=bounds)