This document discusses computer-aided drafting (CAD) and computer-aided design (CAD). It defines CAD as a process of preparing drawings on a computer screen. Various types of drawings are required for different engineering fields, such as mechanical, civil, and electrical engineering. The benefits of CAD include increased productivity, improved quality, improved communication, and creation of manufacturing databases. Common CAD software packages include AutoCAD, ANSYS, ProEngineer, and Catia. The document also discusses solid modeling in CAD, including how to create solid boxes and cones.
![(b)
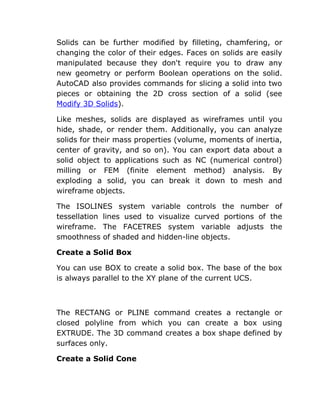
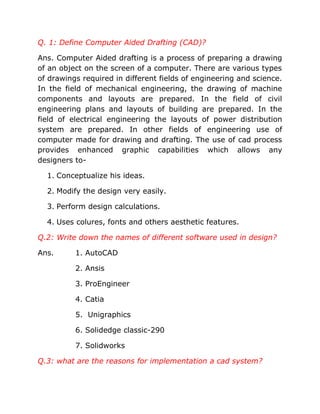
By intersection of two circles
(c)
By intersection of a line & a circle
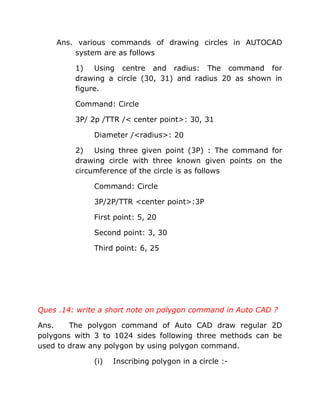
Q.12
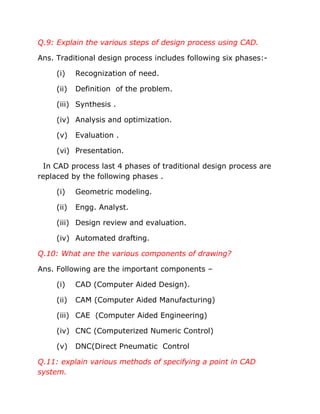
State the different methods of defining the lines in
interactive computer graphics?
Ans. Methods of defining a line in interactive computer
graphics are as follows:
1) By using two previously defined points.
General syntax is
<Symbol> = Line / x1, y1, z1, x2, y2, z2.
L1 = Line / 45,6,0,94,91,0.
2) As one of the coordinate axis:
General syntax is
<Symbol> = Line[x axis]
[y axis]
L2 = Line [X axis]](https://image.slidesharecdn.com/cadnotes-131212040727-phpapp02/85/Cad-notes-7-320.jpg)
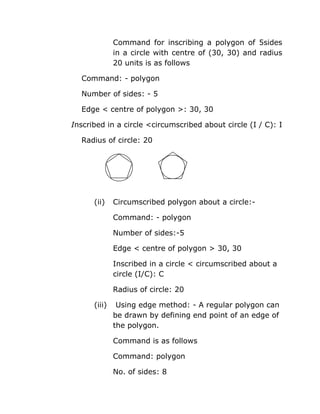
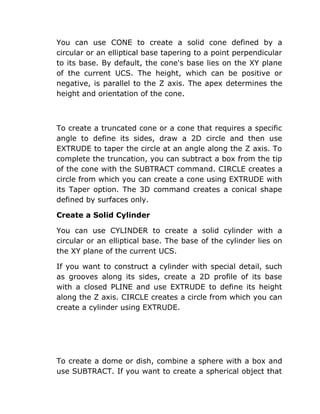
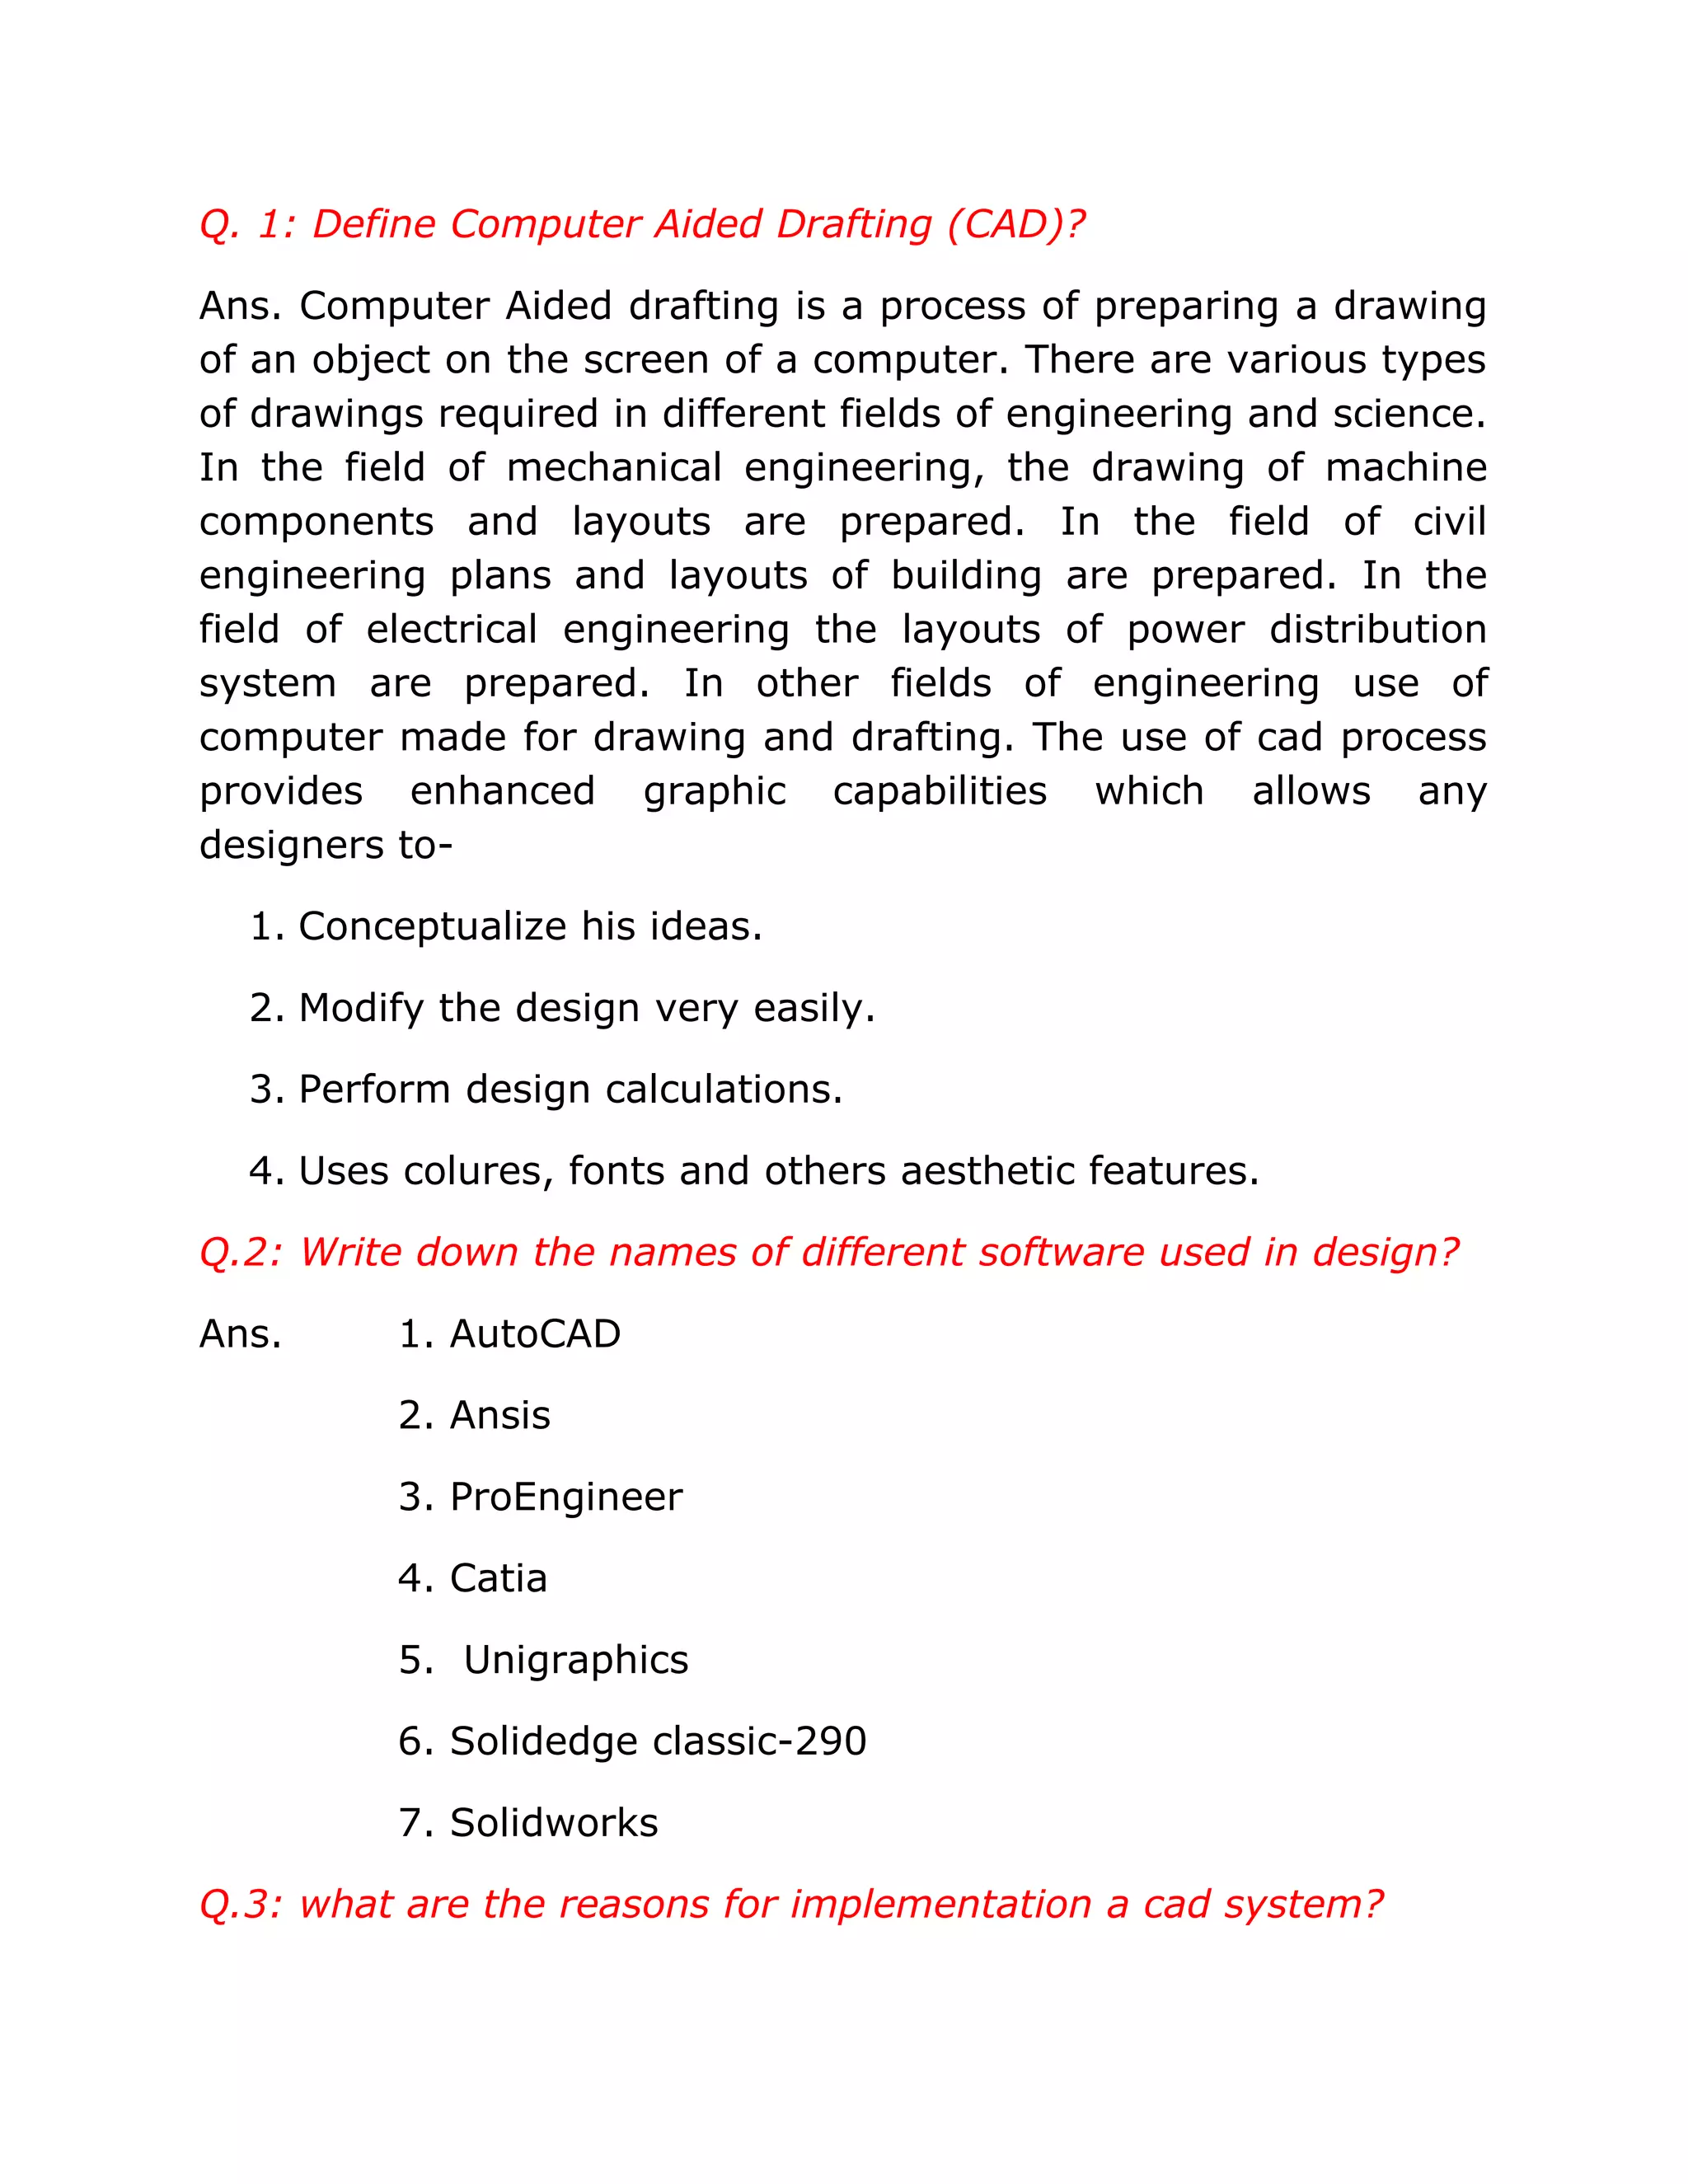
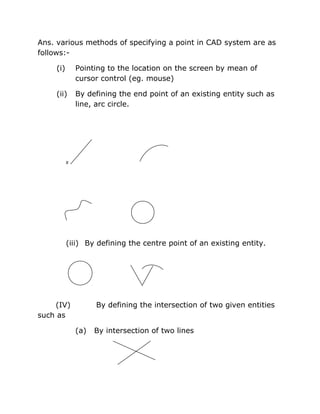
![Centre/ < corner of box> < 0, 0, 0>: 2, 2, 0
Cube / length / < other corner >: C
Height: 7
Ques: 16 Give the command sequence for constructing a
solid cylinder in AUTOCAD?
Ans: Command: - CYLINDER
Elliptical/<center point><0, 0, 0>: [enter point 1]
Diameter/ <radius >: [enter point 2]
Enter point of other end/<height>: 30
Ques: 17 Explain the following transformations in 2D
drawing?
A) Translation B) Rotation C) Scaling
Ans. It is as follows:
a) Translation: Repositioning the image.
b) Rotation: Repositioning the image through an angle θ.
c) Scaling: Enlarging or reducing the image.
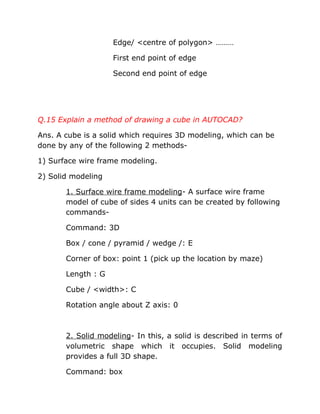
Ques: 18 Write about the following commands?
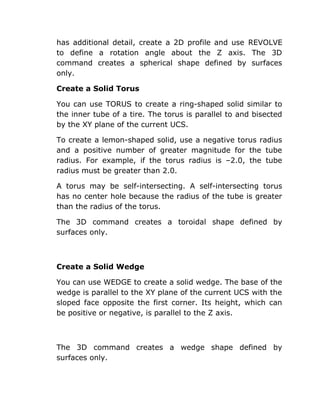
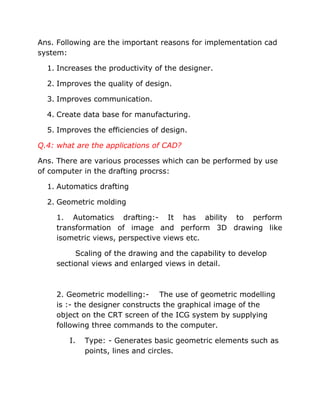
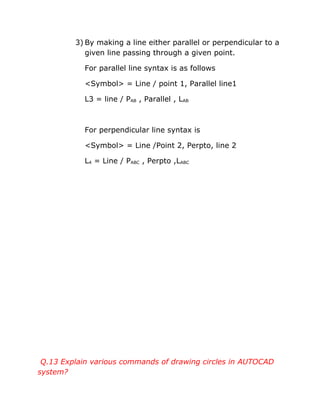
Ans: a) Move: It is used to move one or more existing
drawing entities from one location to another. Select the object to](https://image.slidesharecdn.com/cadnotes-131212040727-phpapp02/85/Cad-notes-12-320.jpg)
![be moved and then enter move command and drag the object
from one location to another.
b) Dimscale: It is used to set or change the scale used for
dimensioning .This command reduces all dimensions of the
drawing to the new scale .Default setting of this command 1.000.
c) Mirror: It creates a mirror image of the selected geometry
element.This command creates mirror image of the entities by
reflecting them symmetrically with reference to a defined axis.
d) Array: It makes multiple copies of selected objects in a
rectangular or circular pattern.
Ques: 19 Name the different types of edit command?
Ans. REDO, UNDO, OFFSET, SELECT, CHANGE.
Ques: 20 For copy of drawing different commands used are-----?
Ans. COPY,
ARRAY, OFFSET.
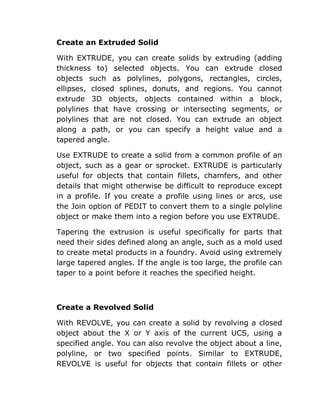
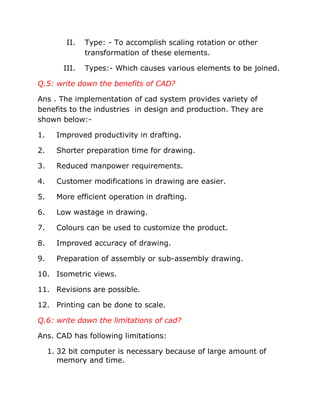
Ques: 21 what is the need of defining drawing size? How is it
done?
Ans. Defining drawing limits gives us a frame of reference
between our work in AutoCAD and the final printed output. In
order to set up the drawing work area we need to know how
standard sheet sizes translate into full scale drawing sizes.
For eg: if we need to draw a room of actual size of 8.5 ft * 11 ft,
we will take a scale of 1” = 1’ and define drawing area as
102*132.
This can be done in following steps:
1) Choose format
>>> Drawing limits
2) Specify at the lower left corner or [on/off] accept the default](https://image.slidesharecdn.com/cadnotes-131212040727-phpapp02/85/Cad-notes-13-320.jpg)