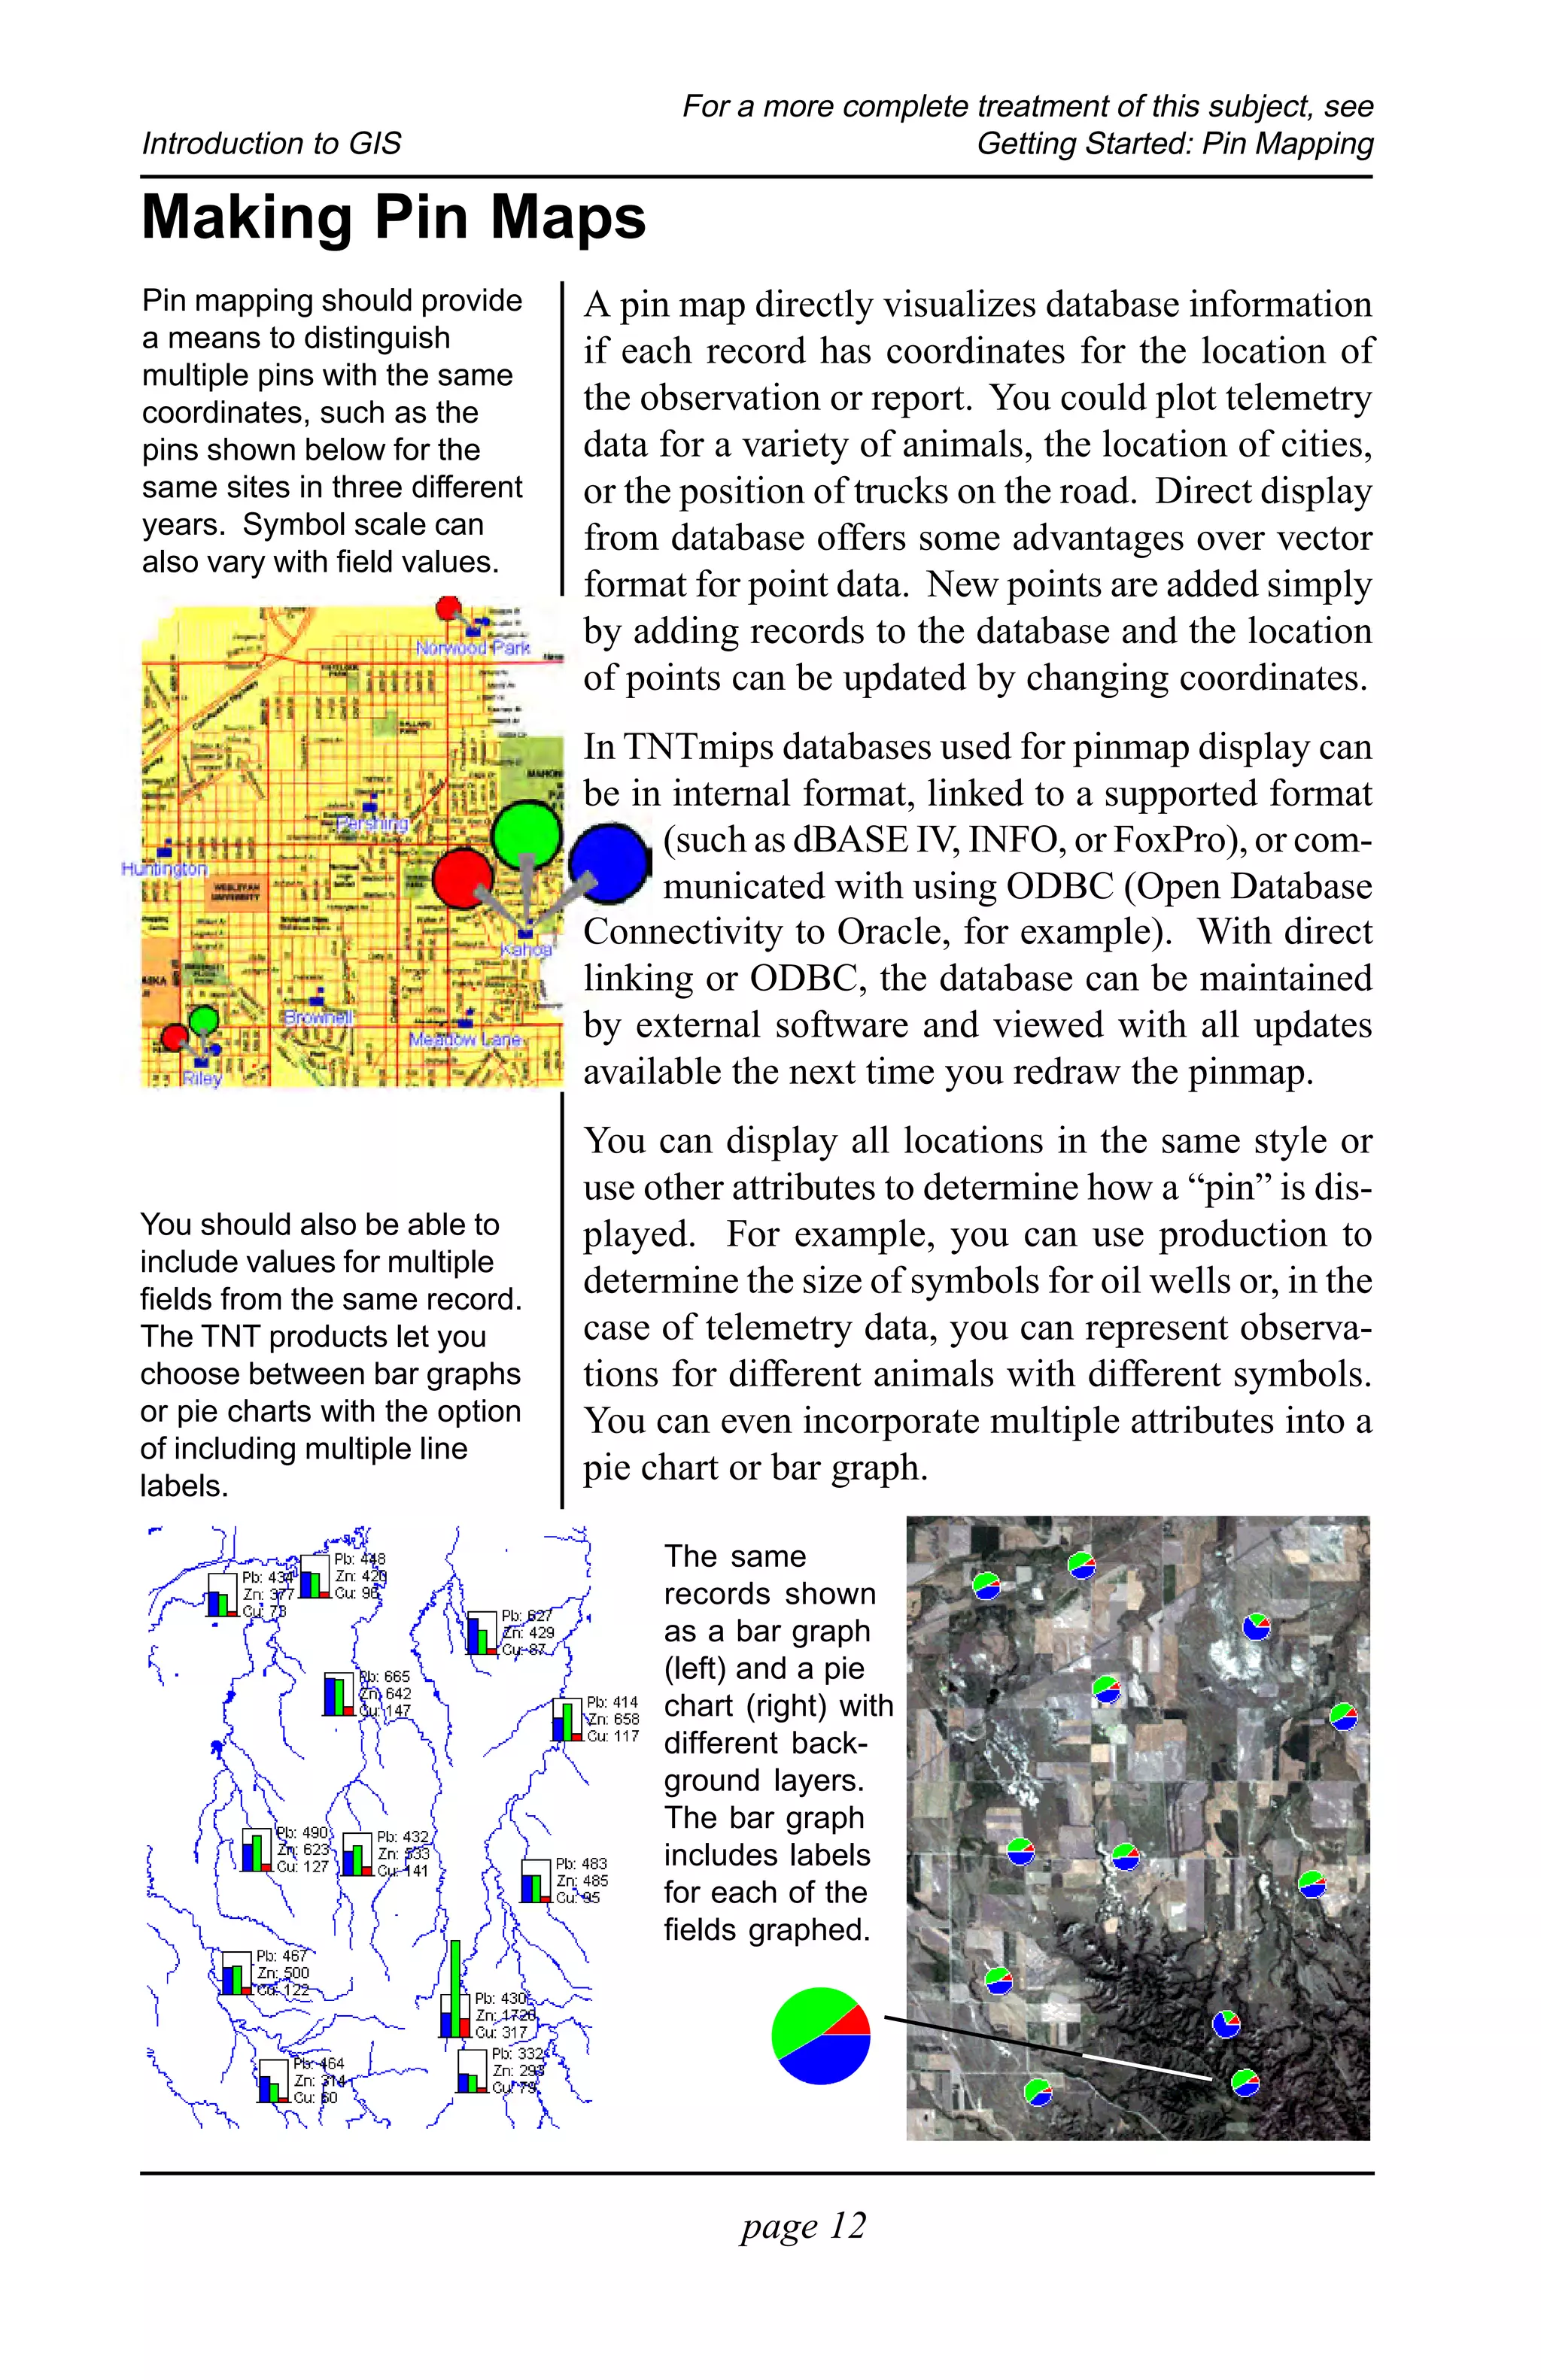
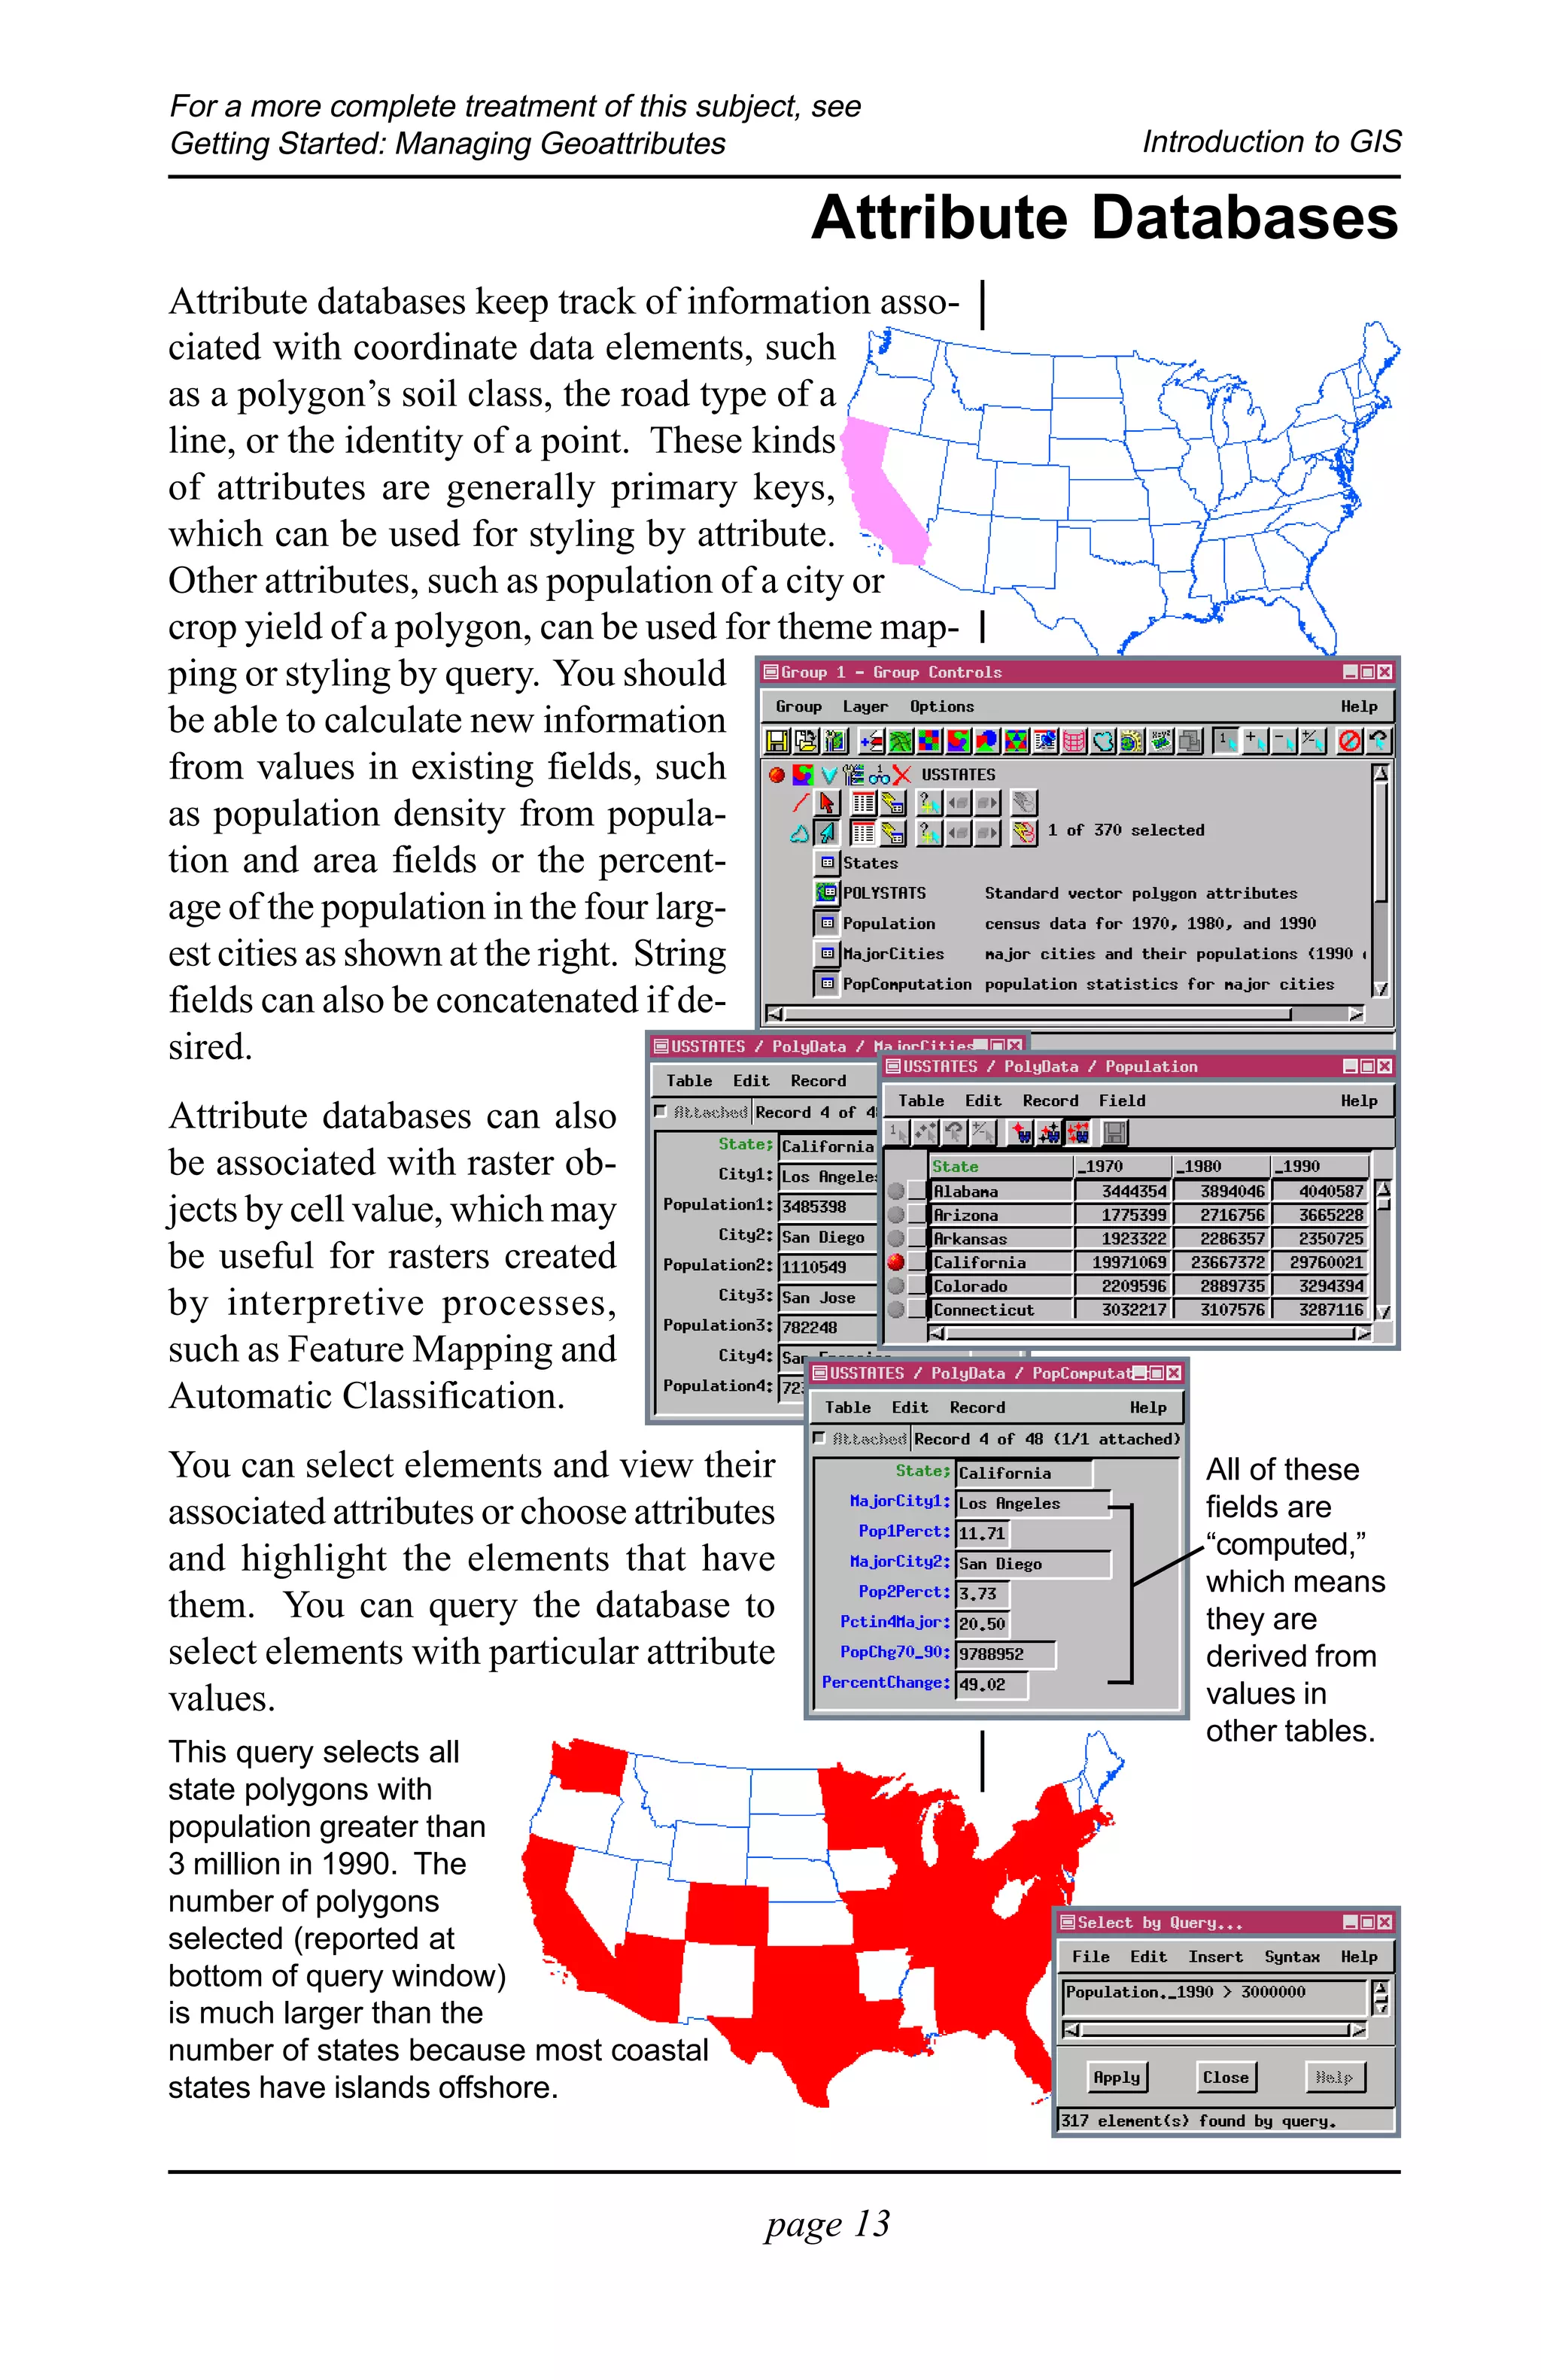
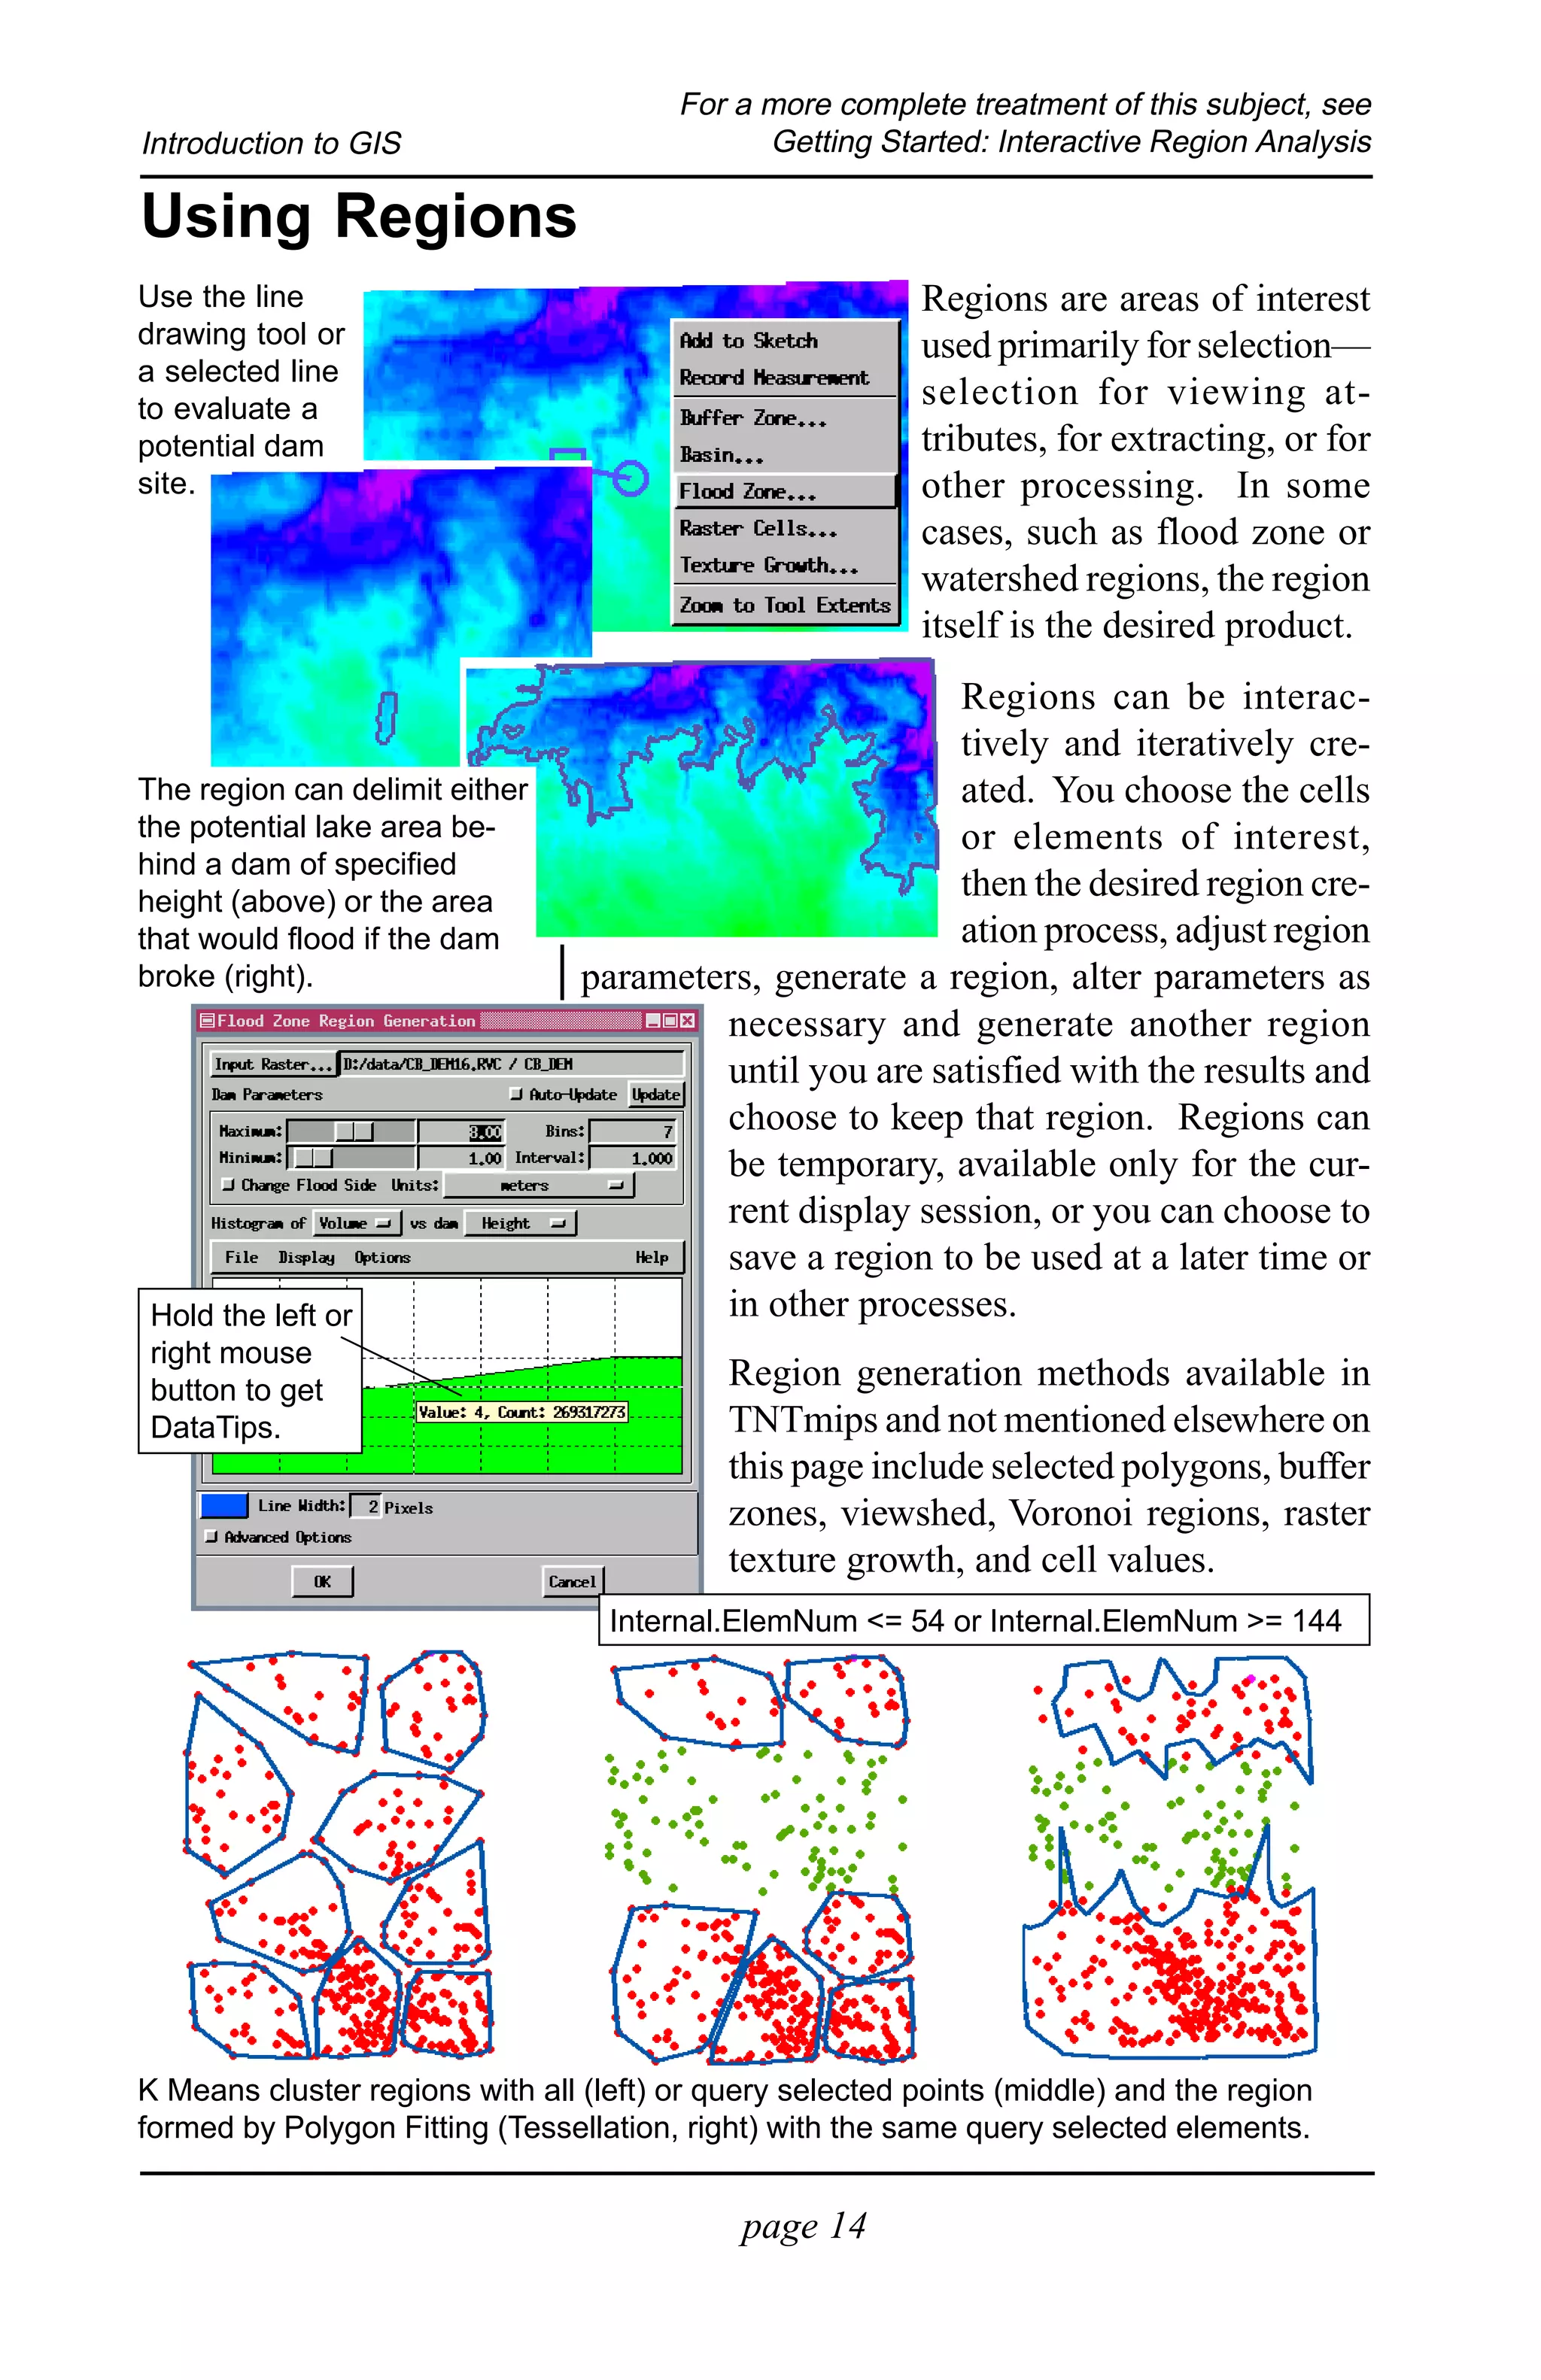
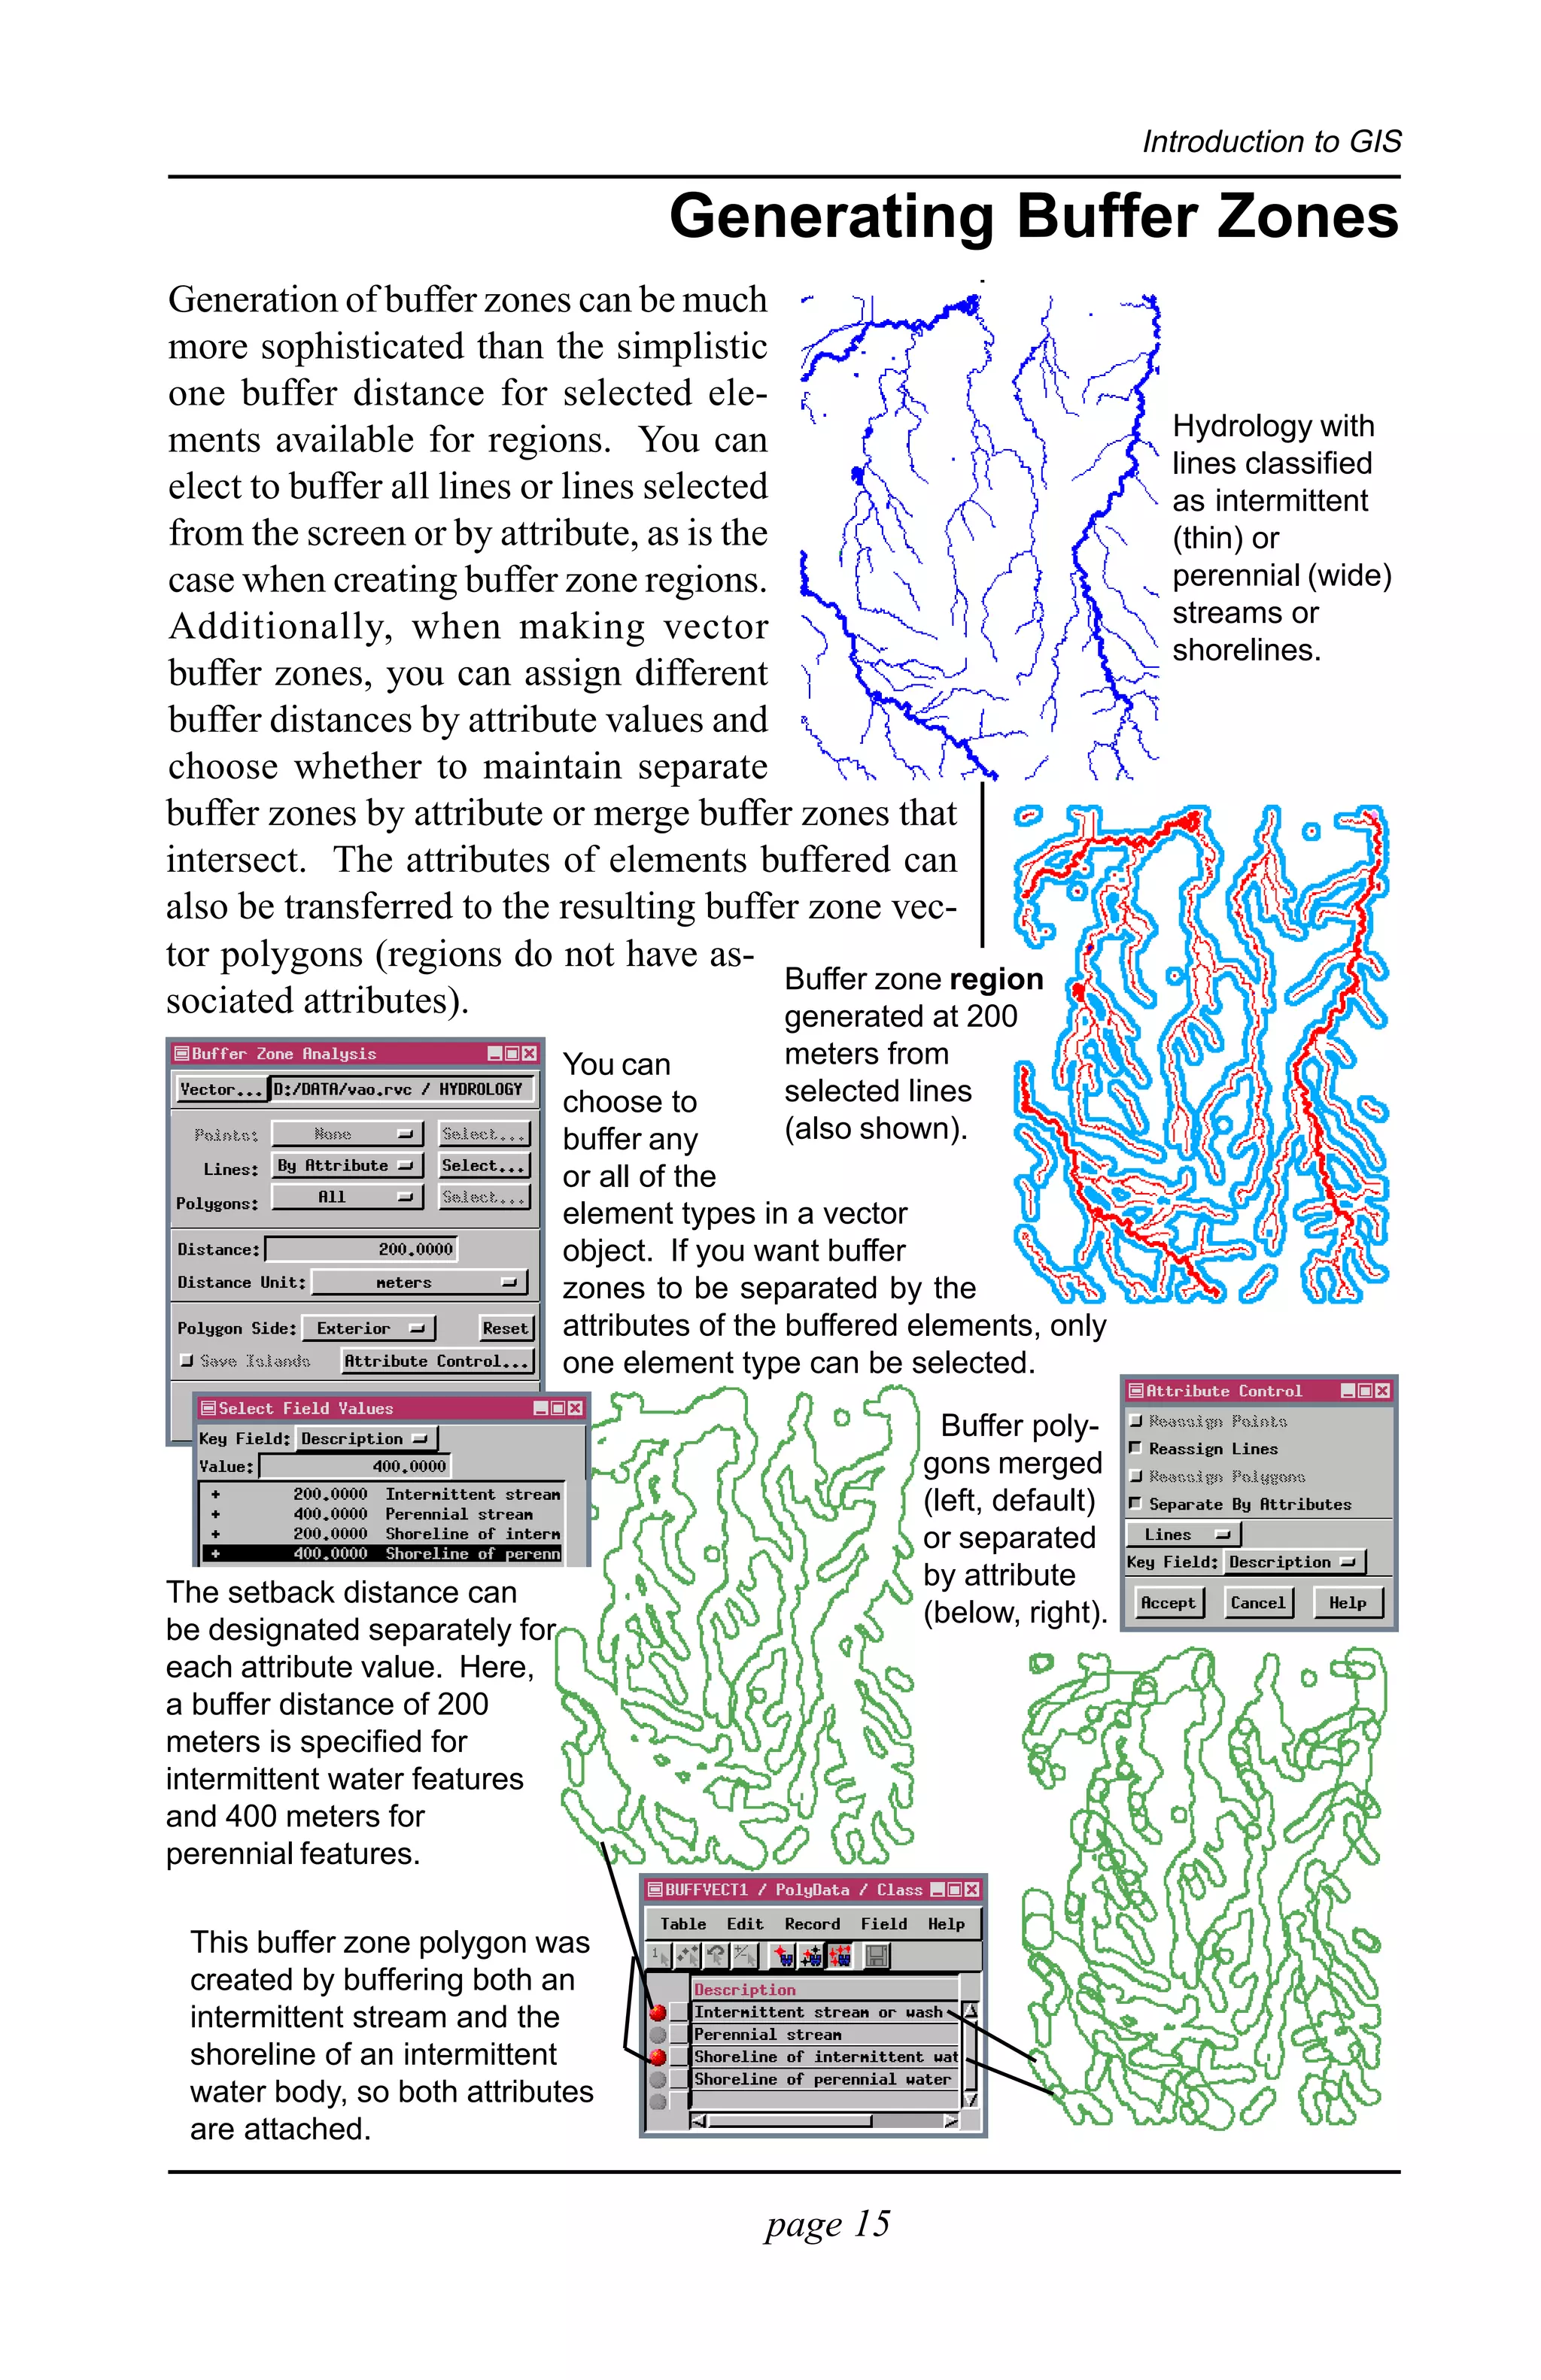
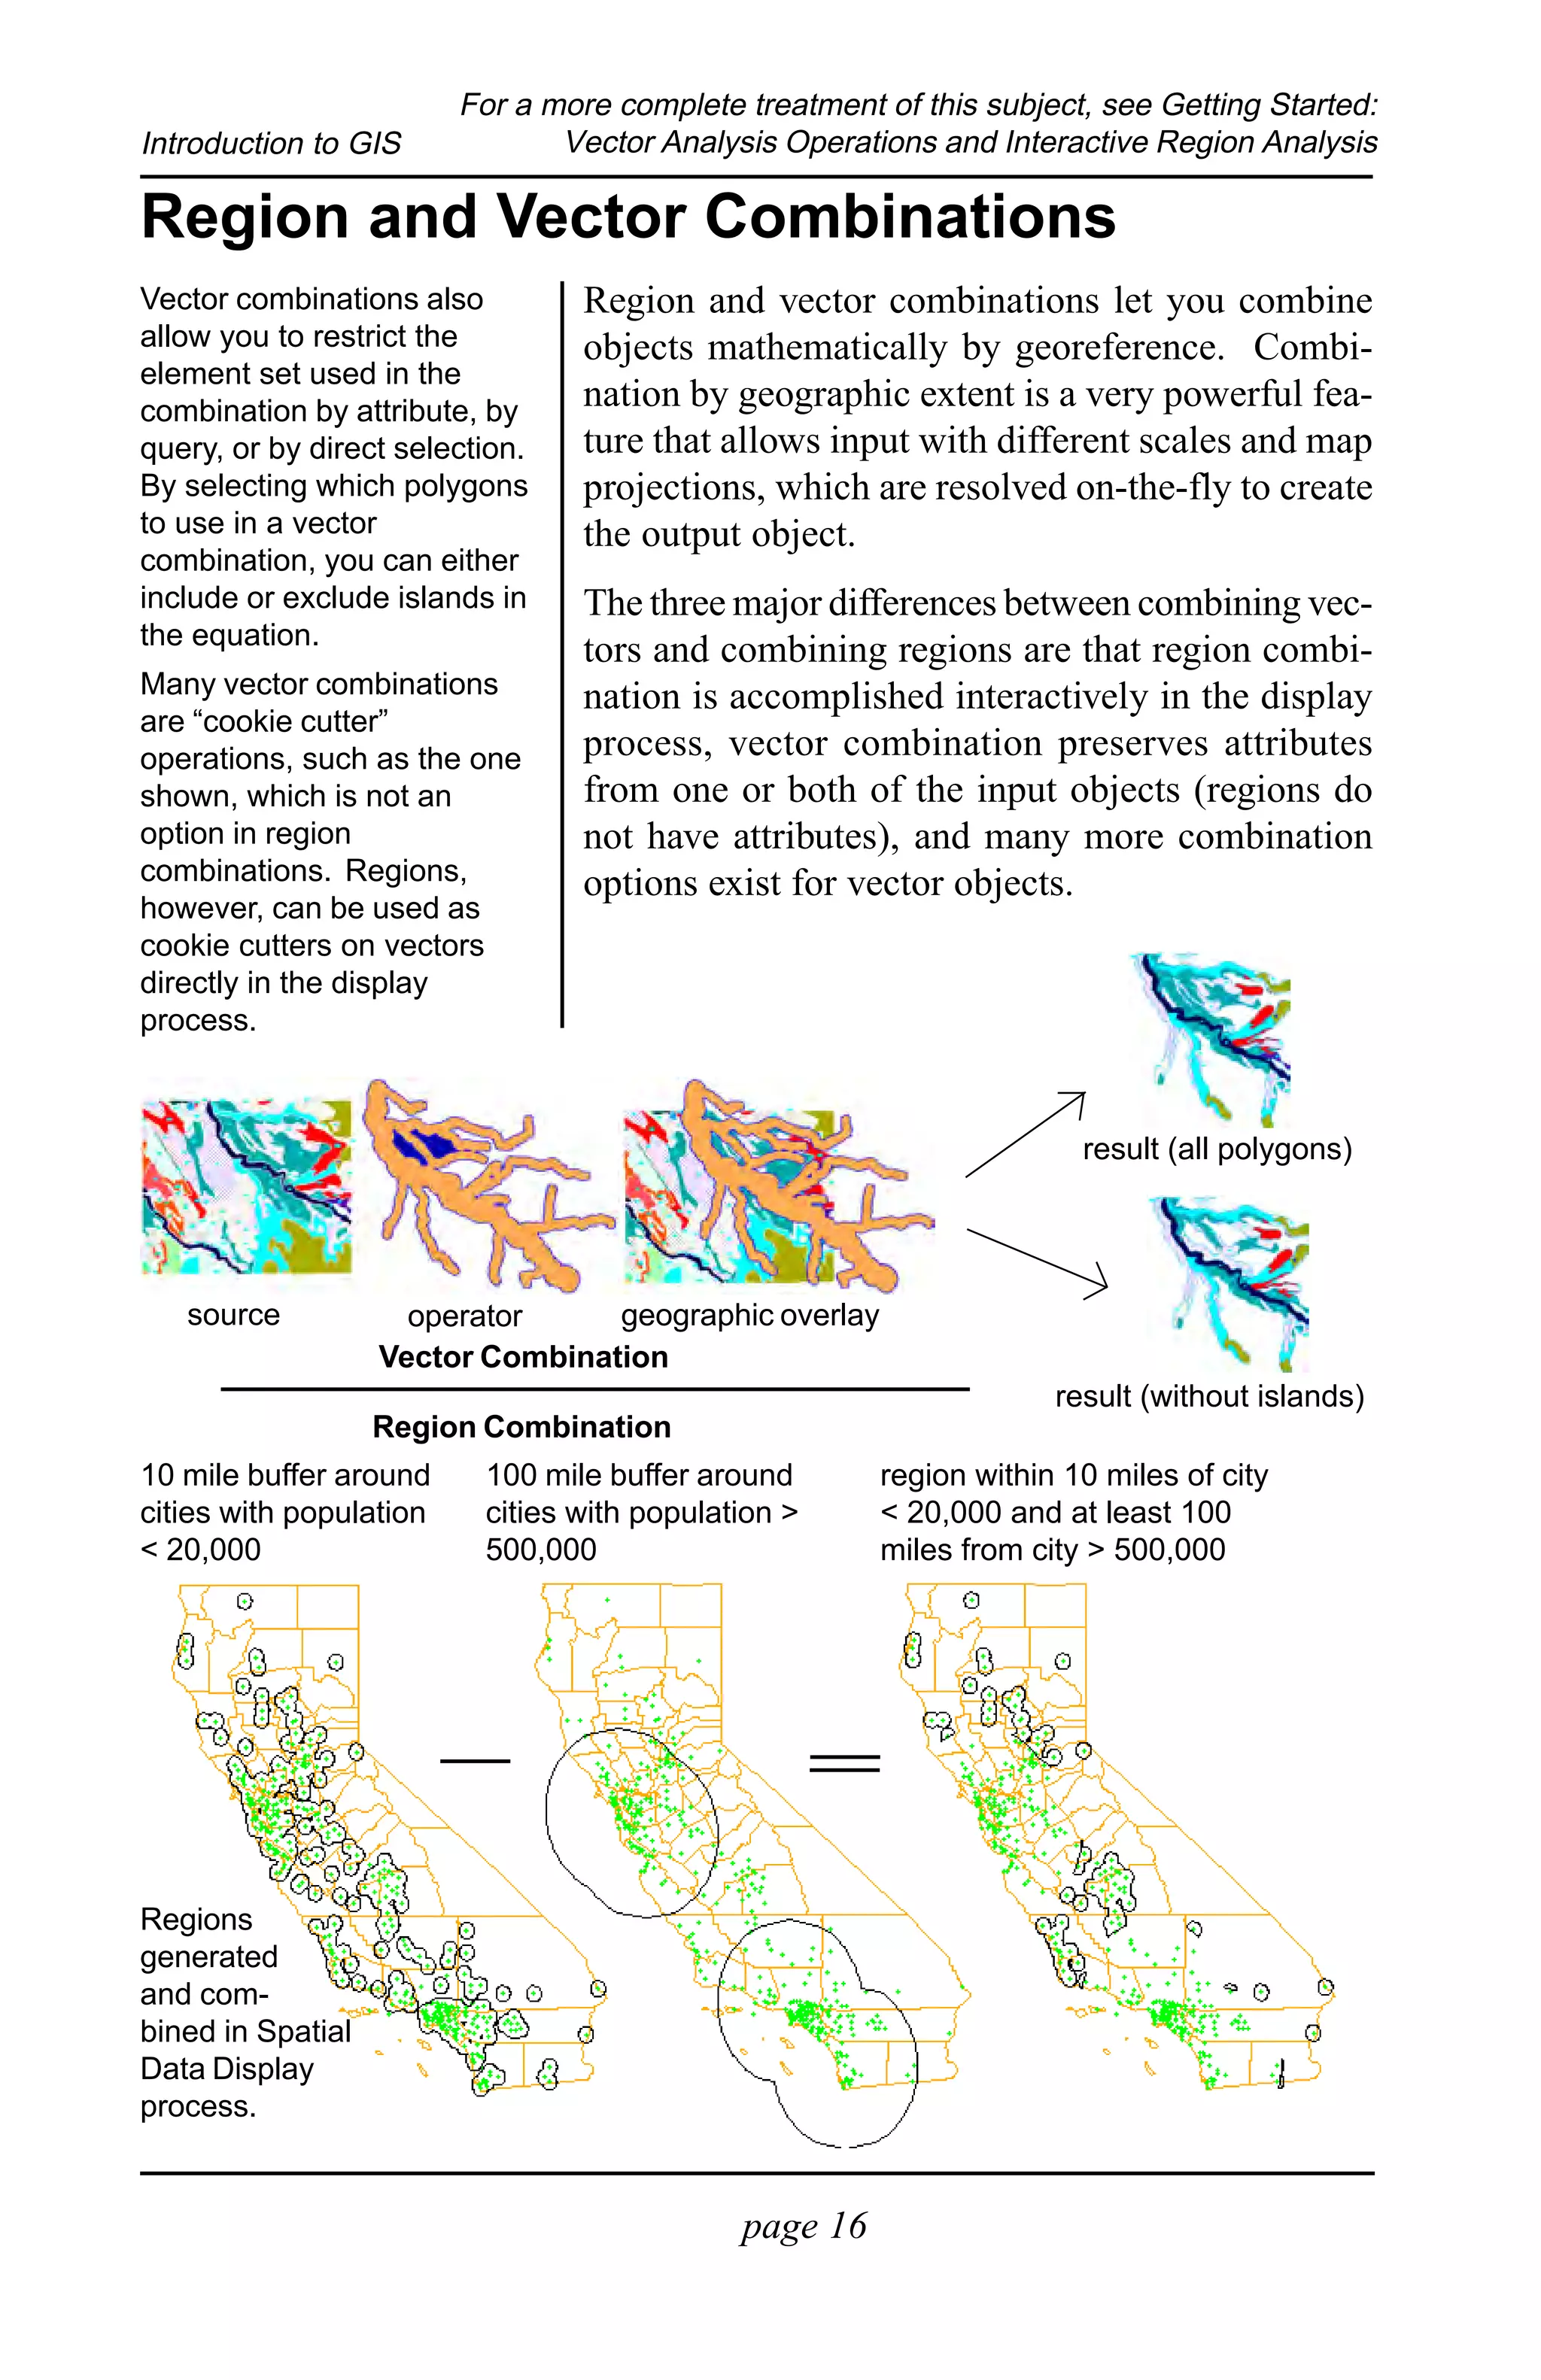
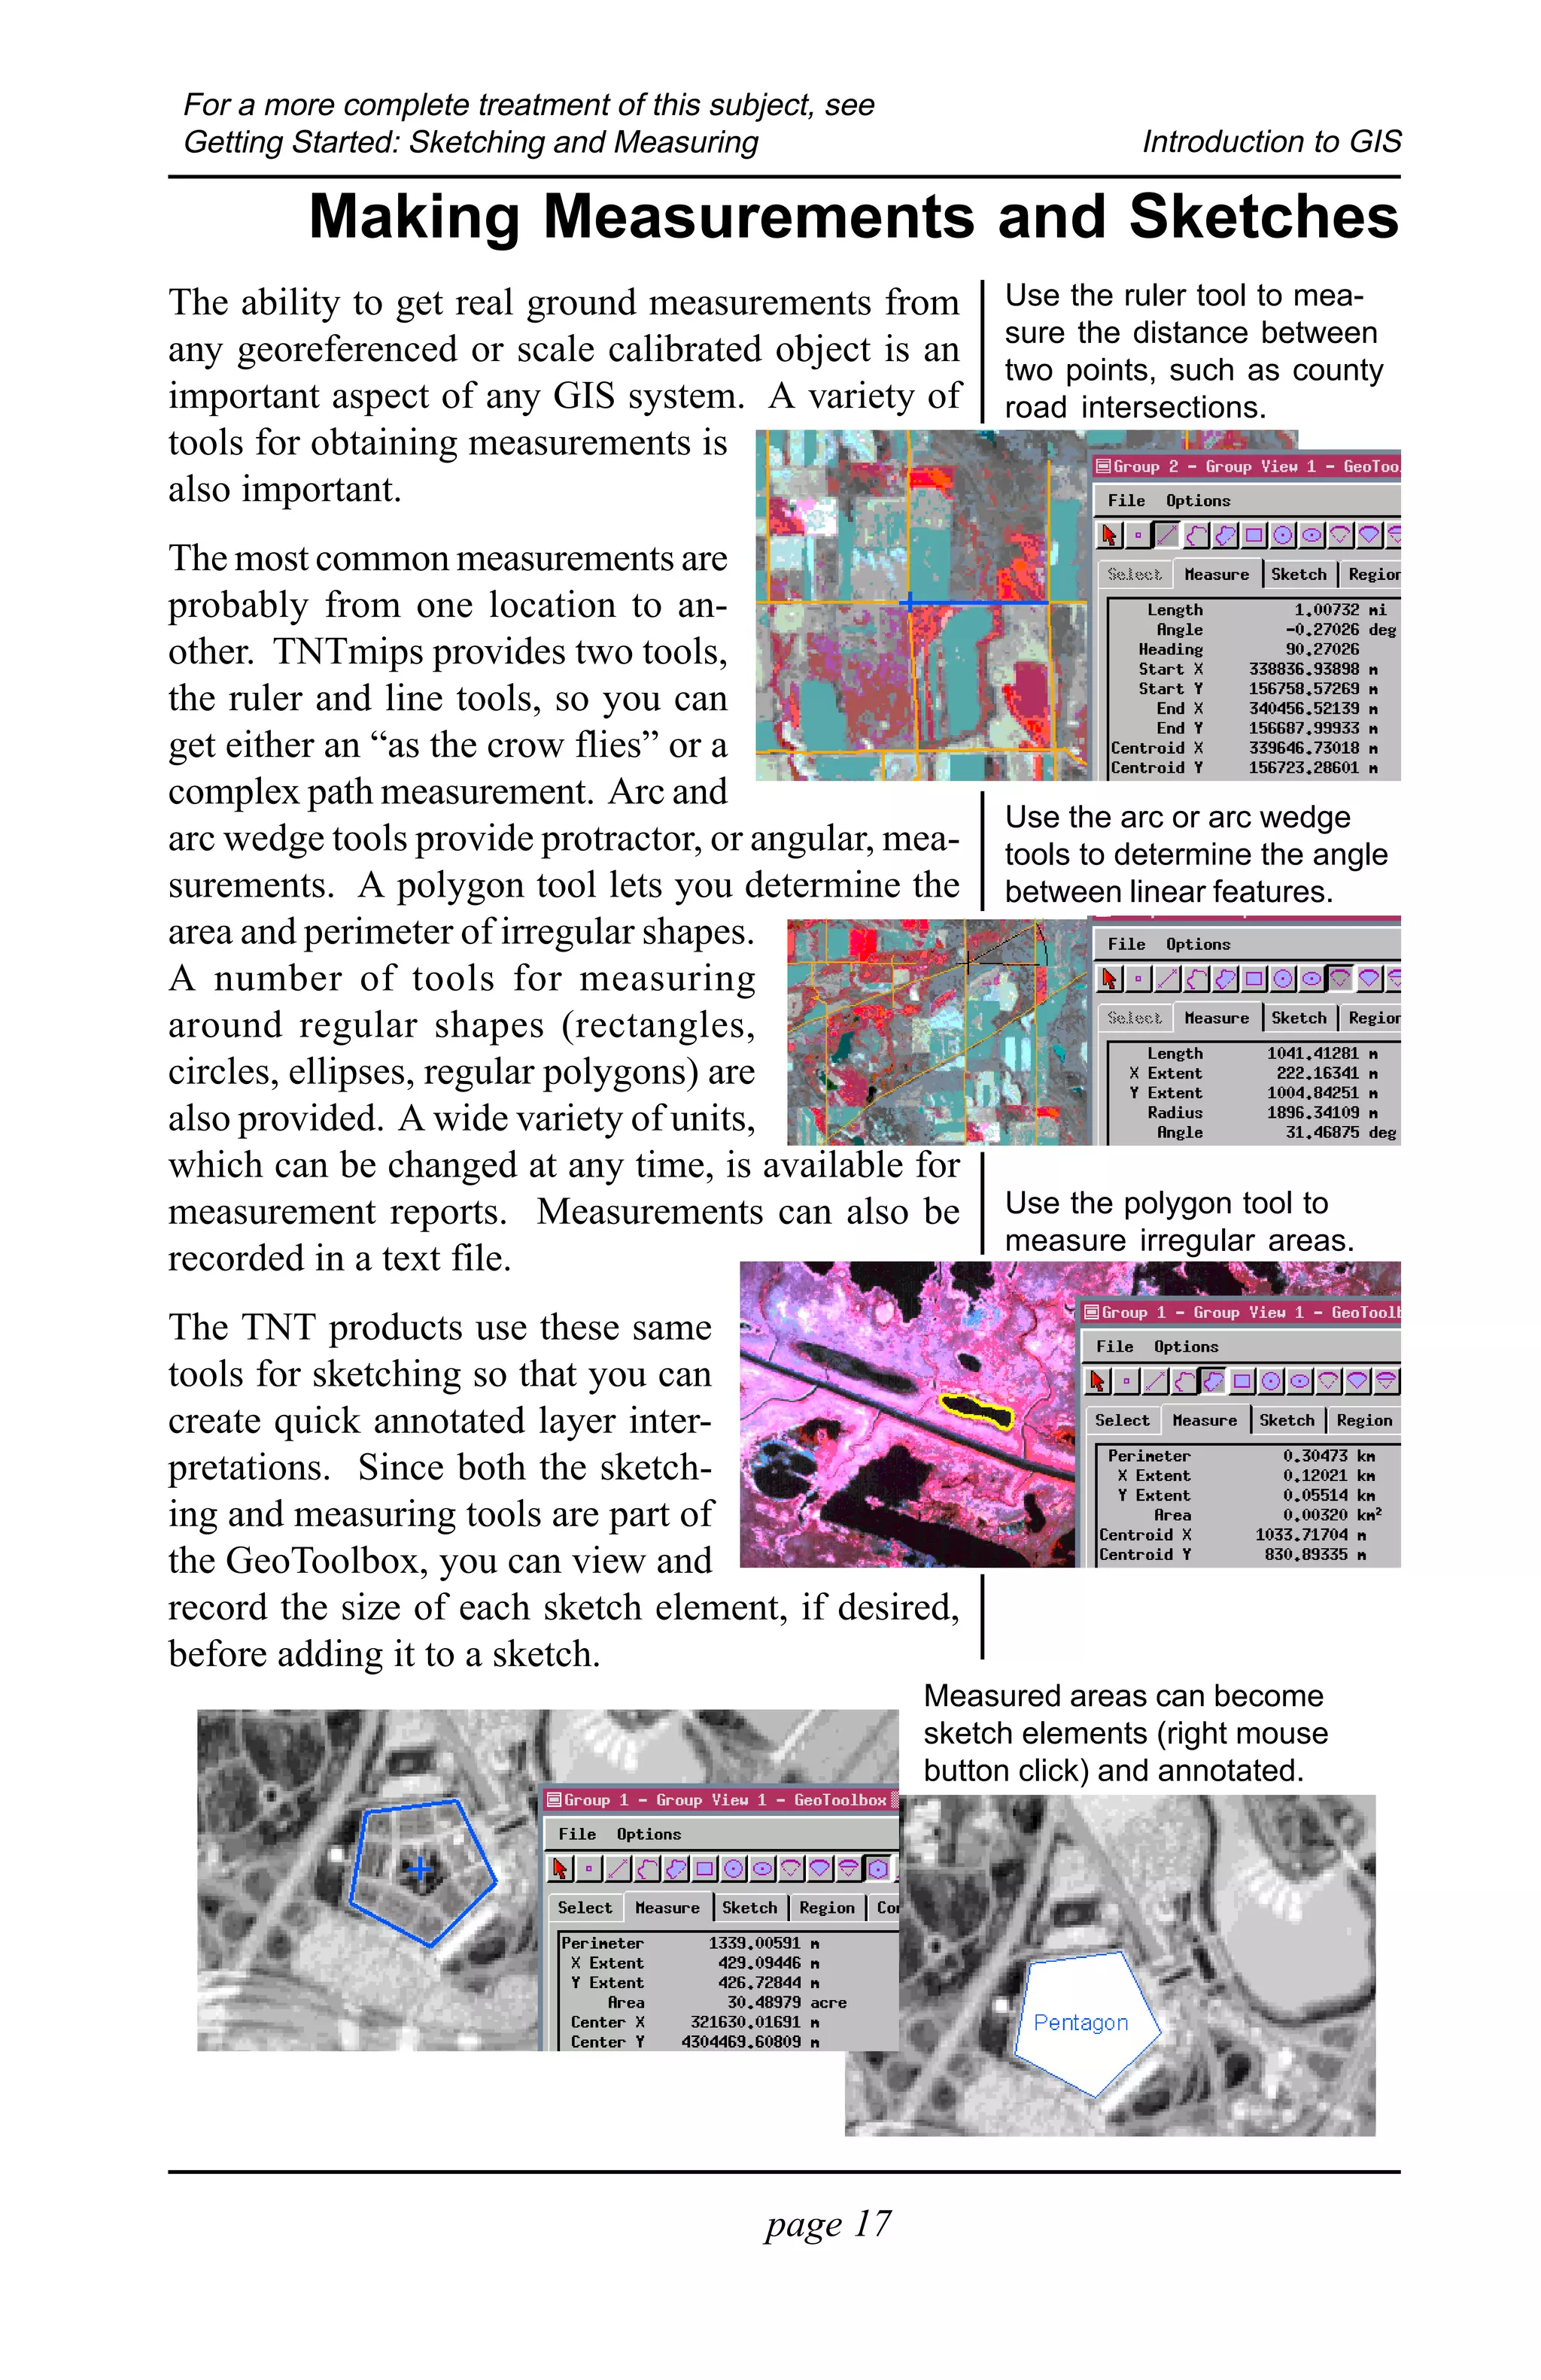
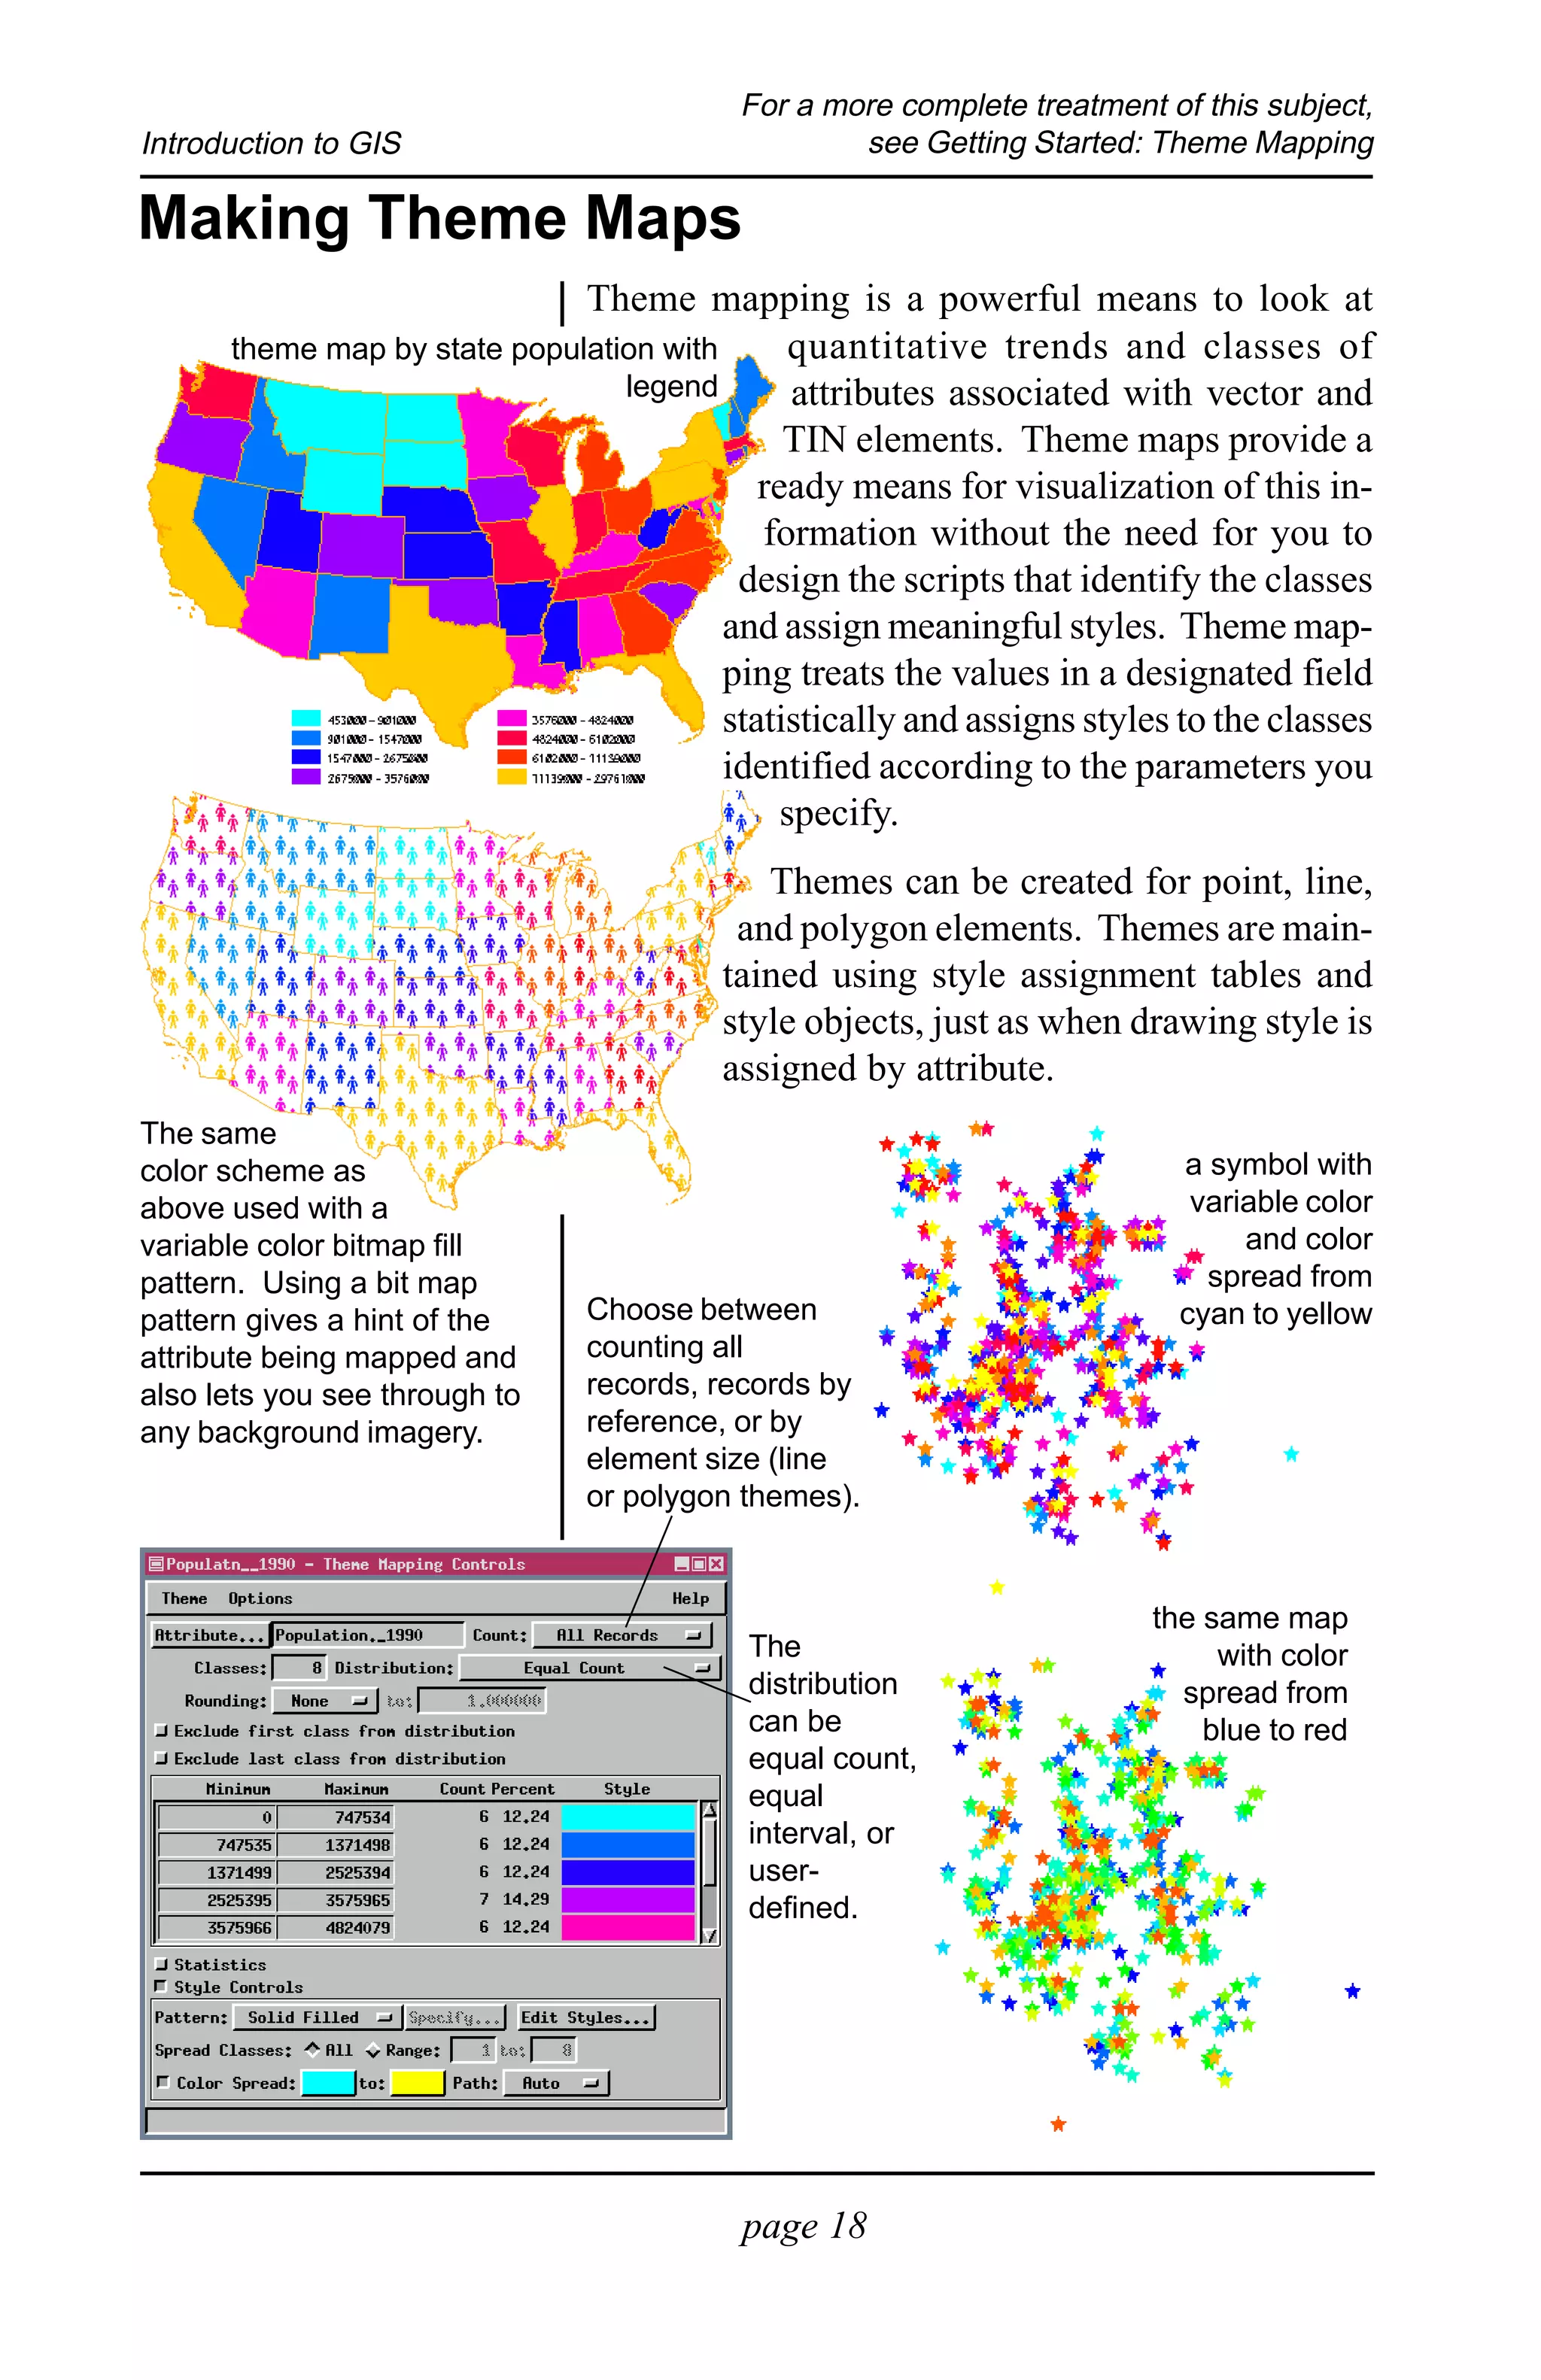
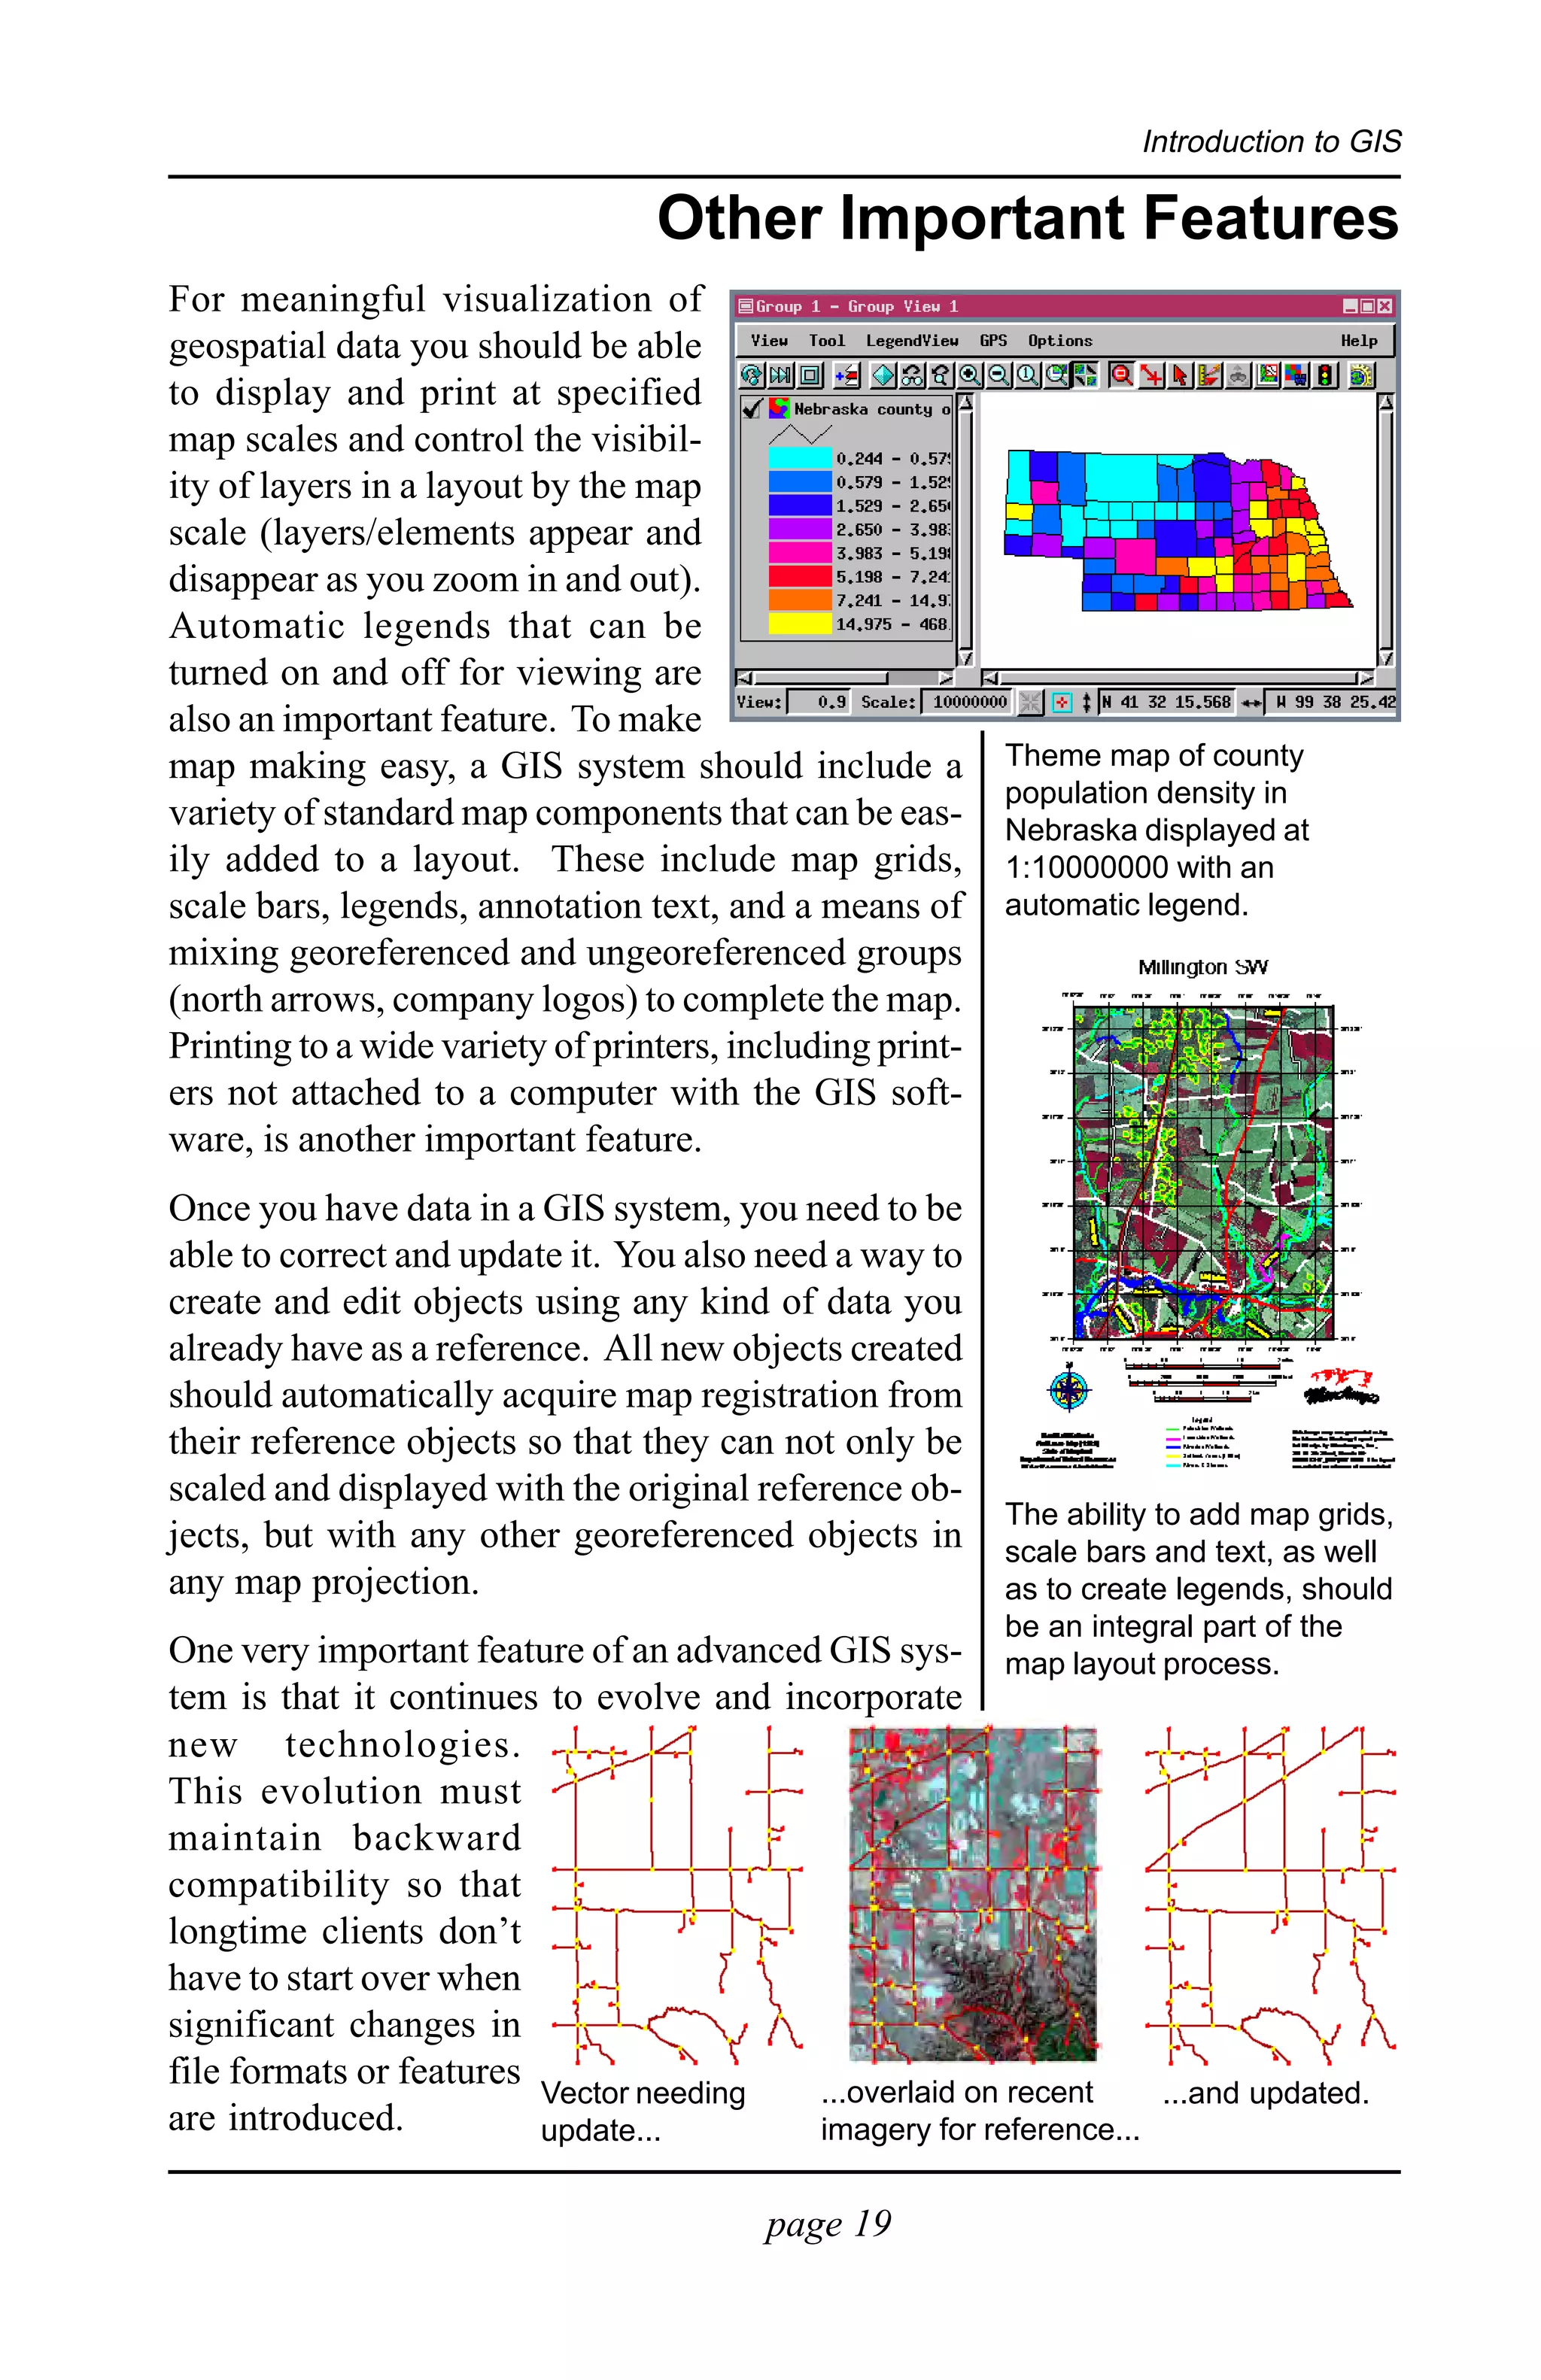
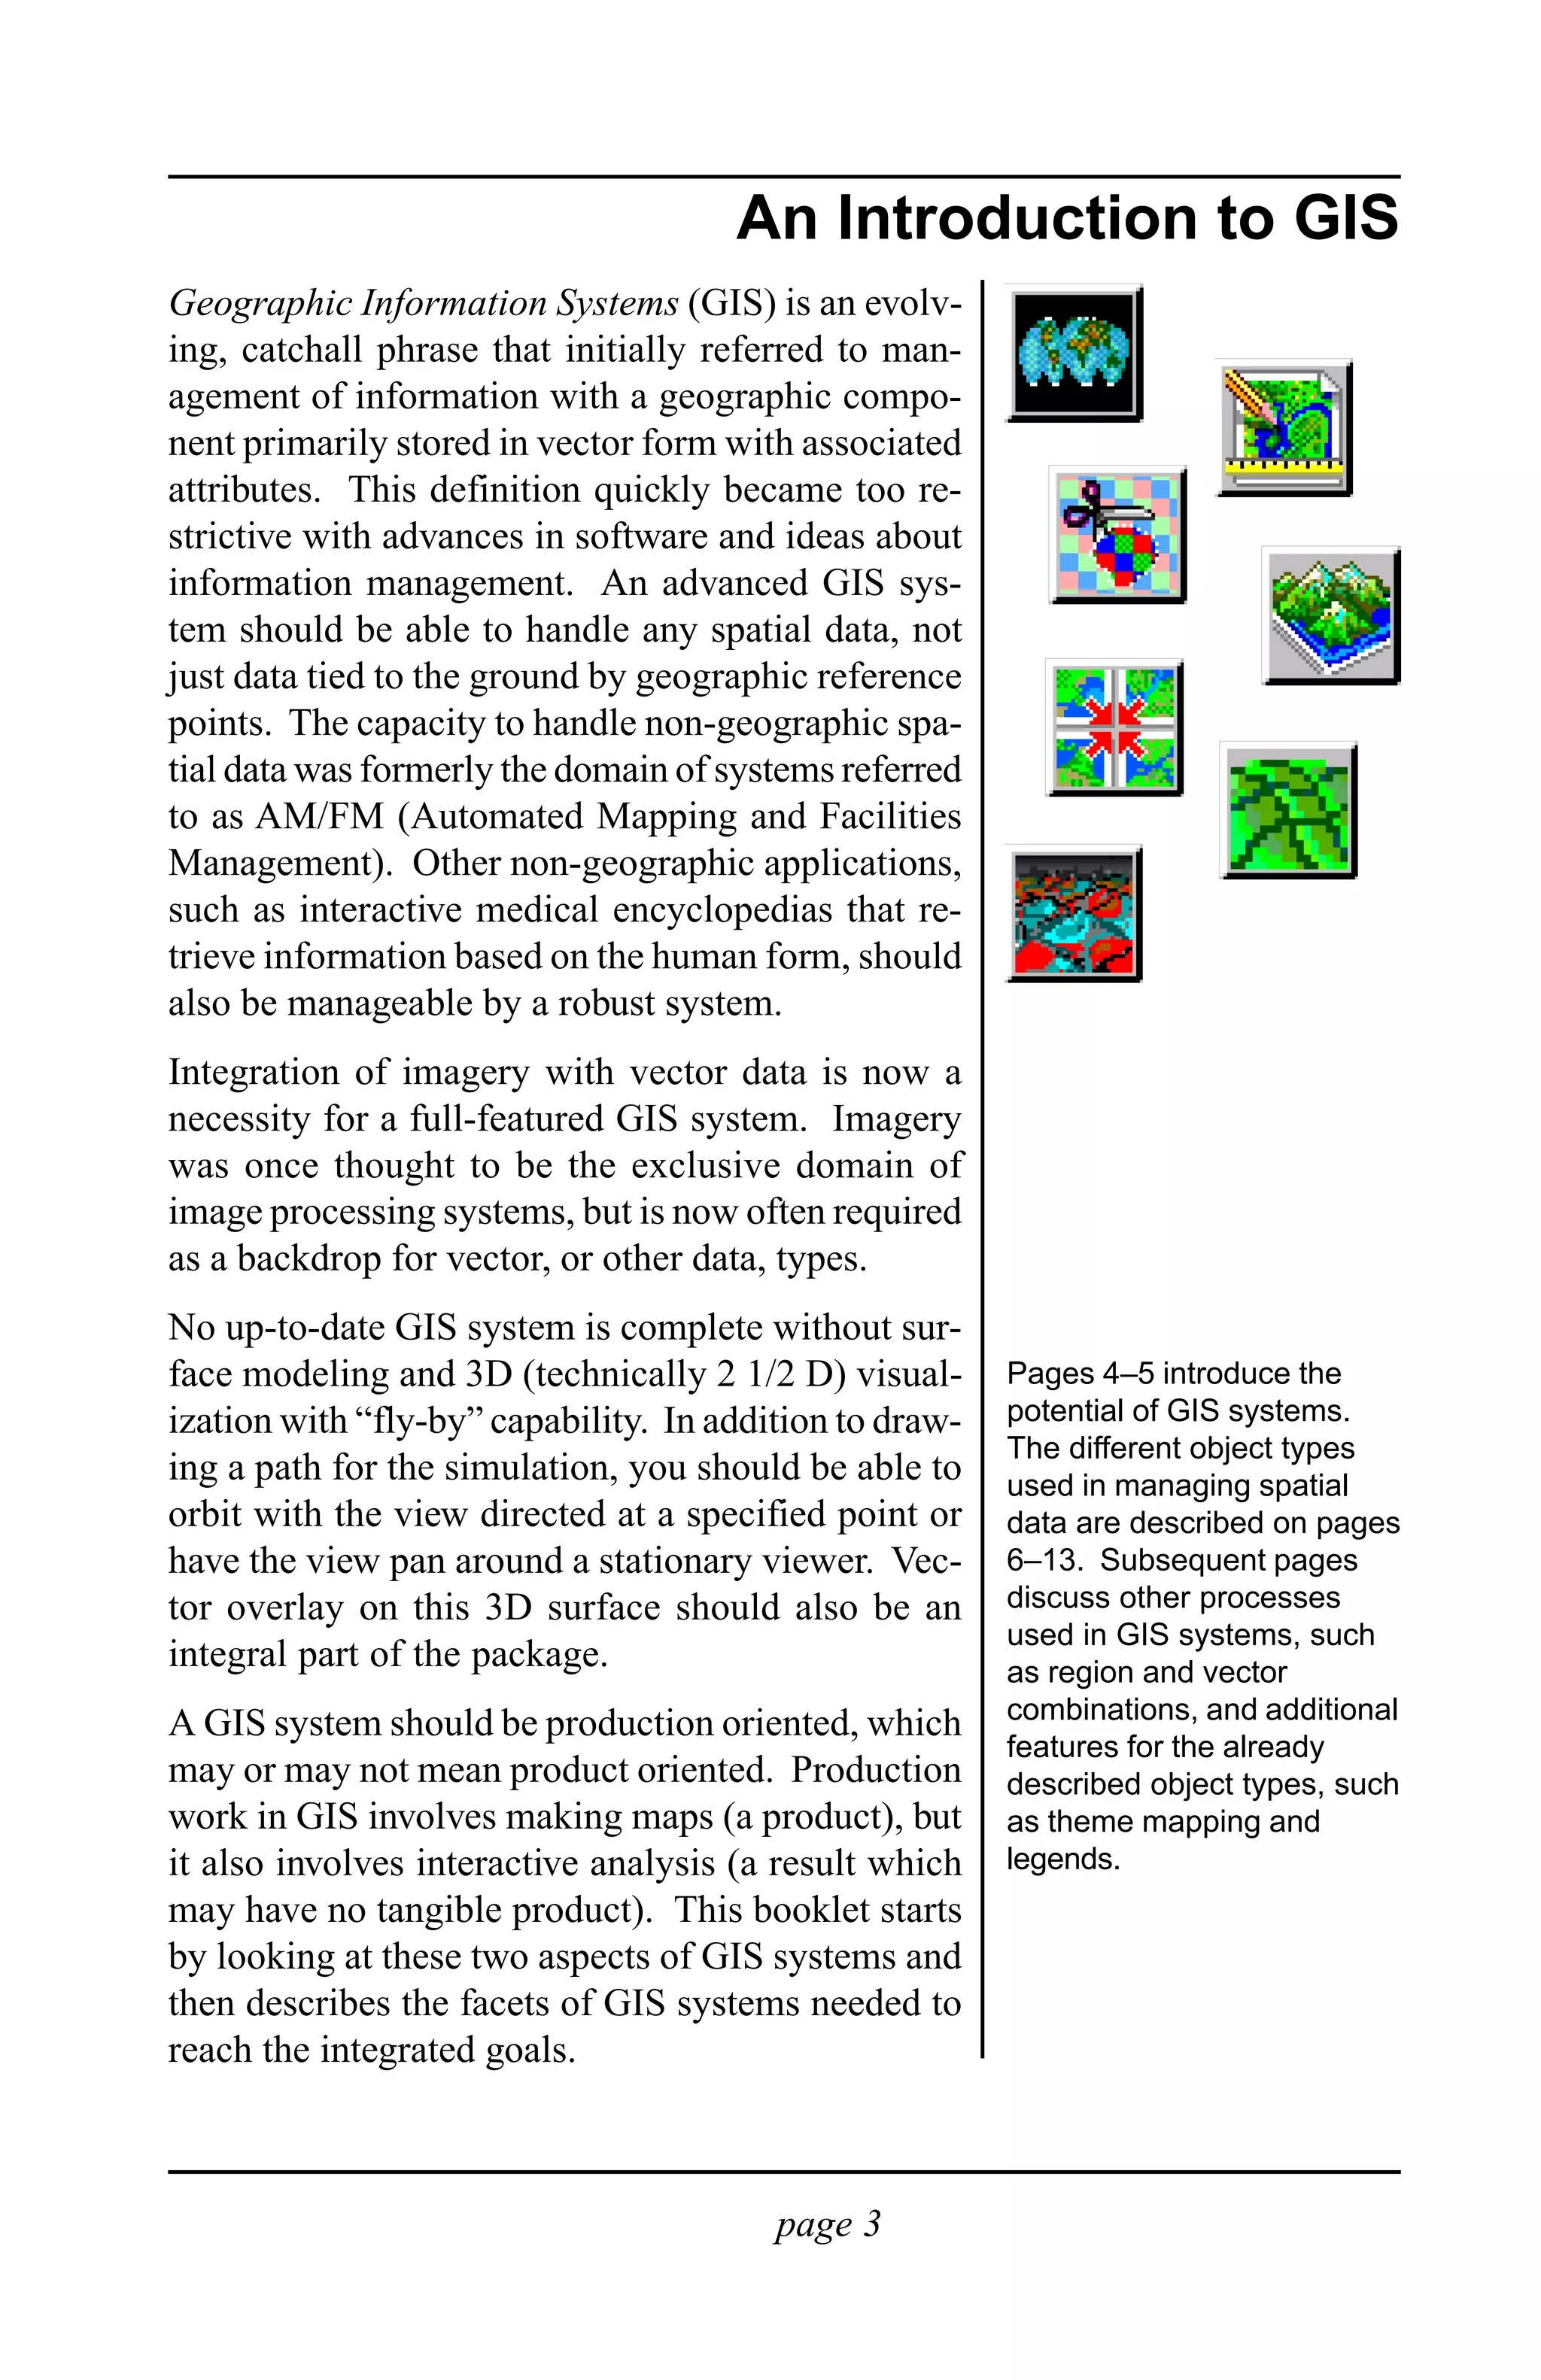
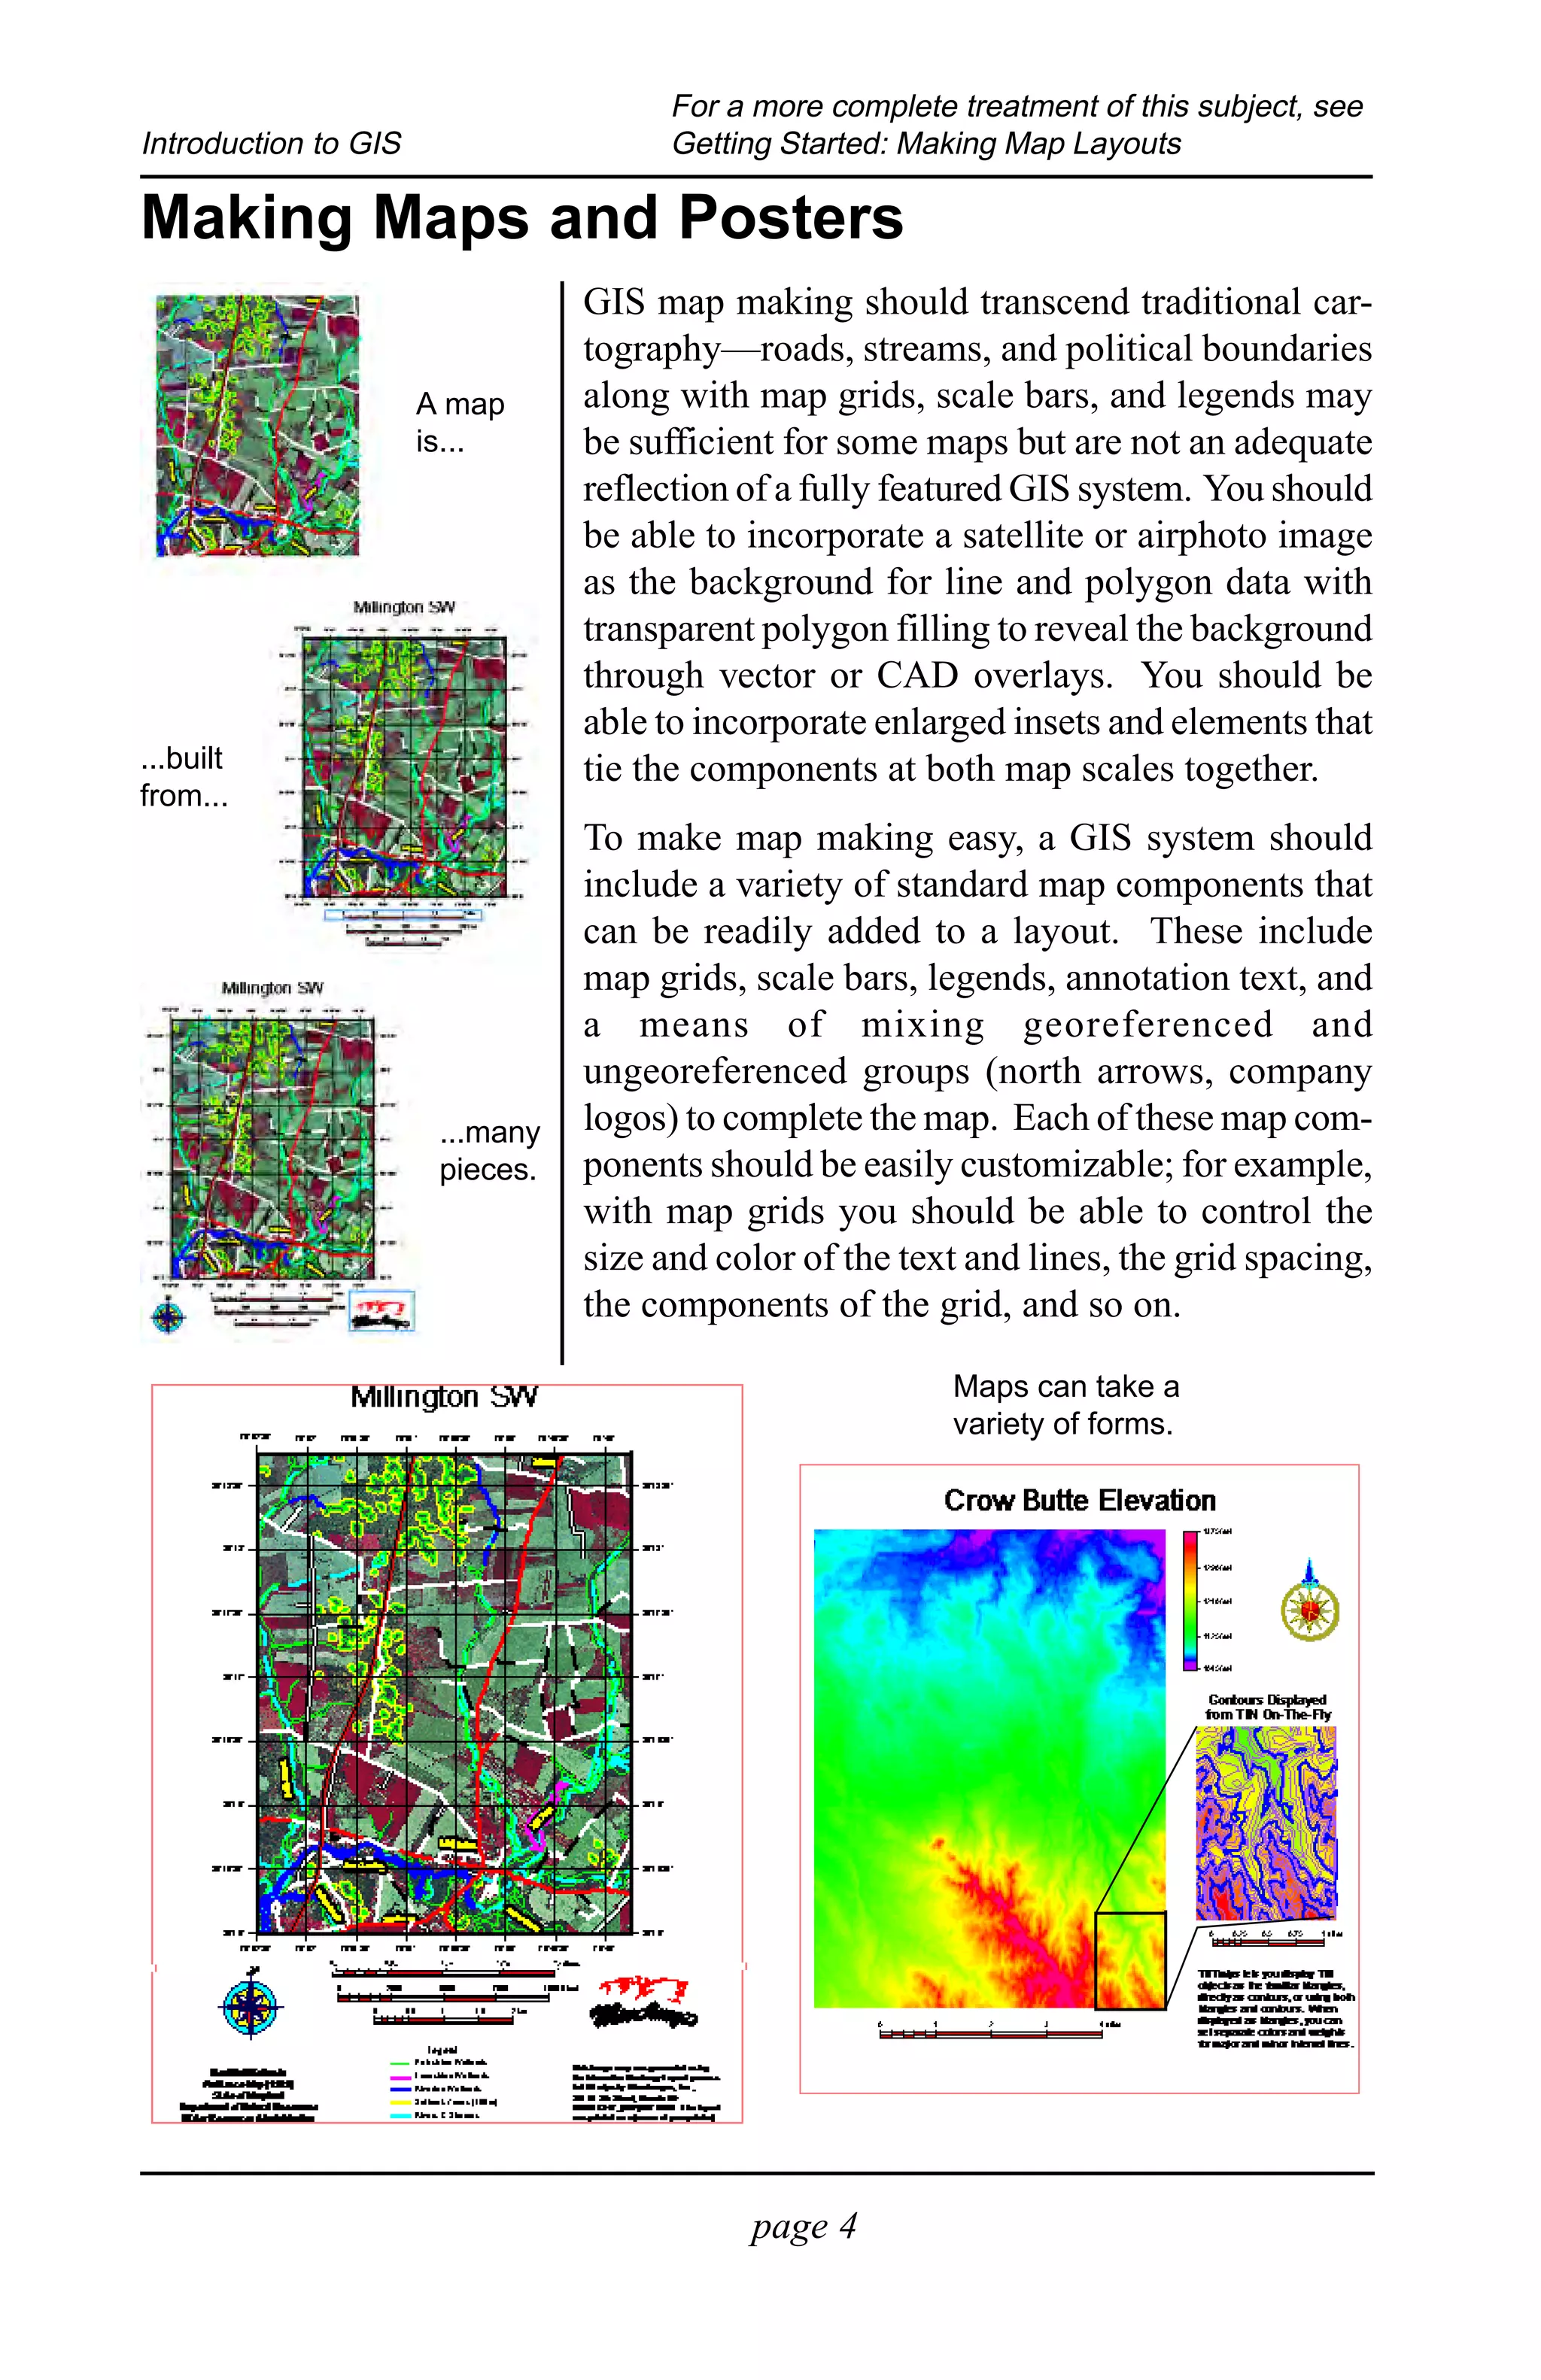
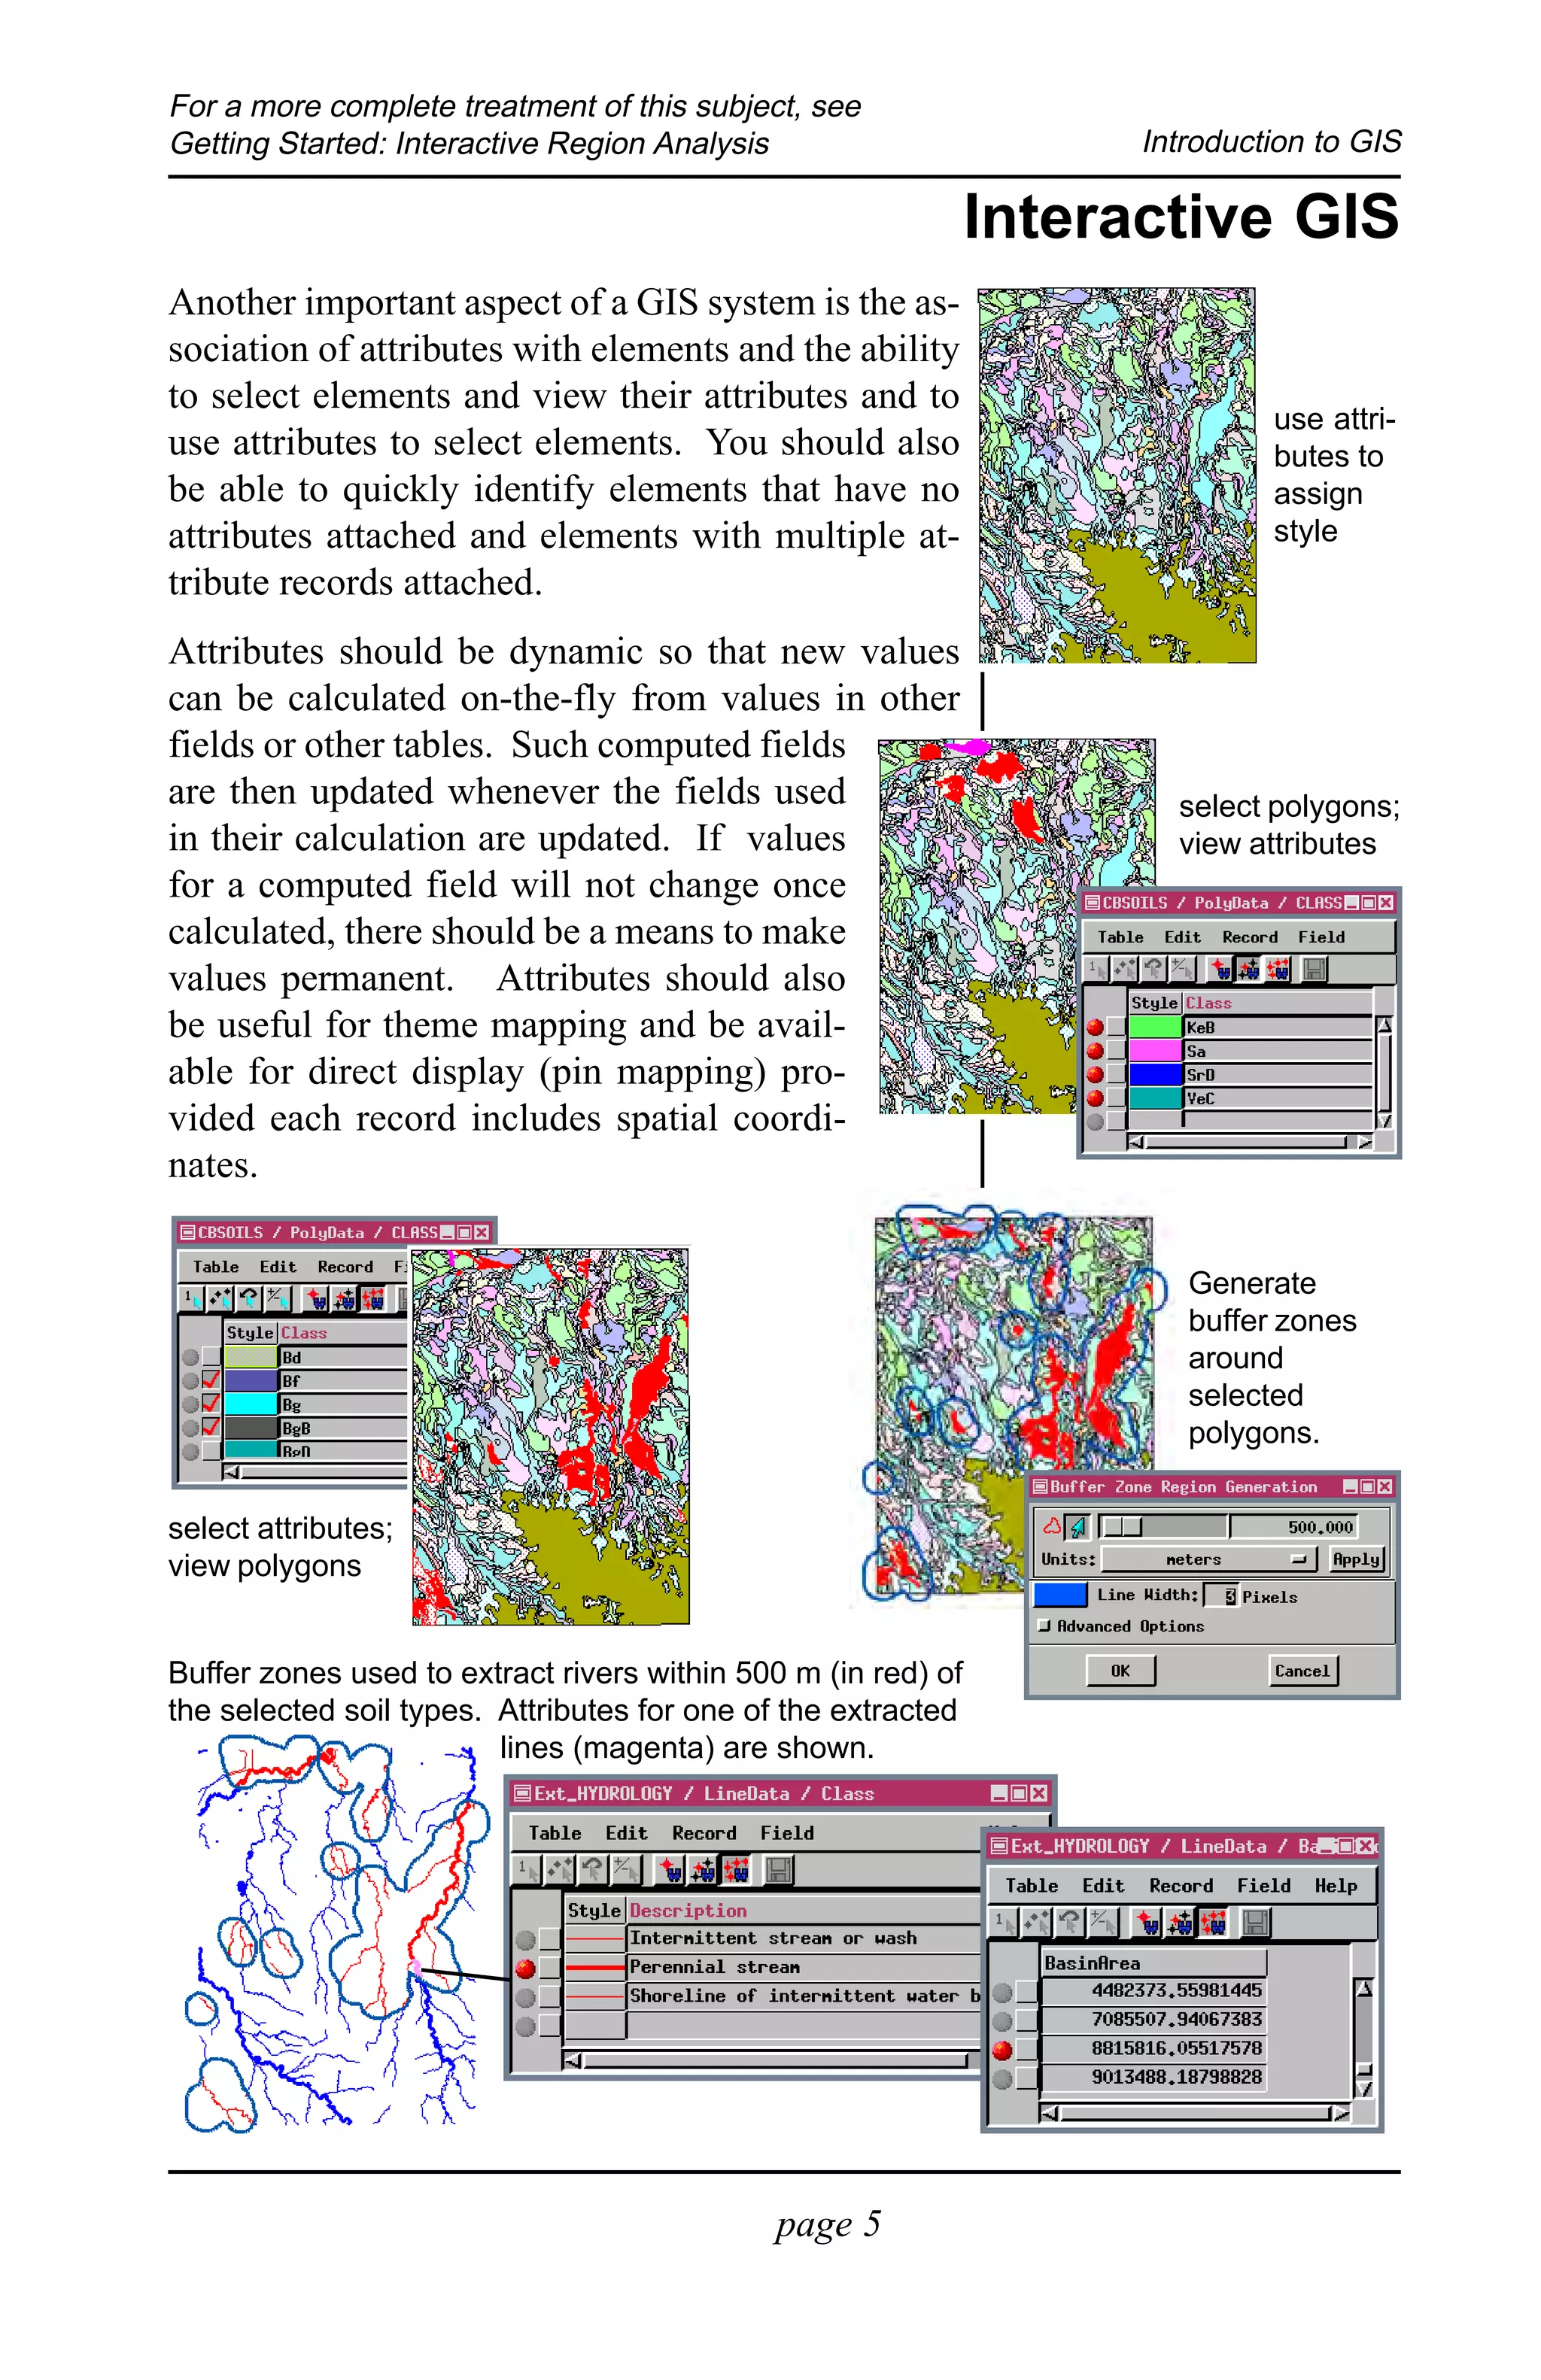
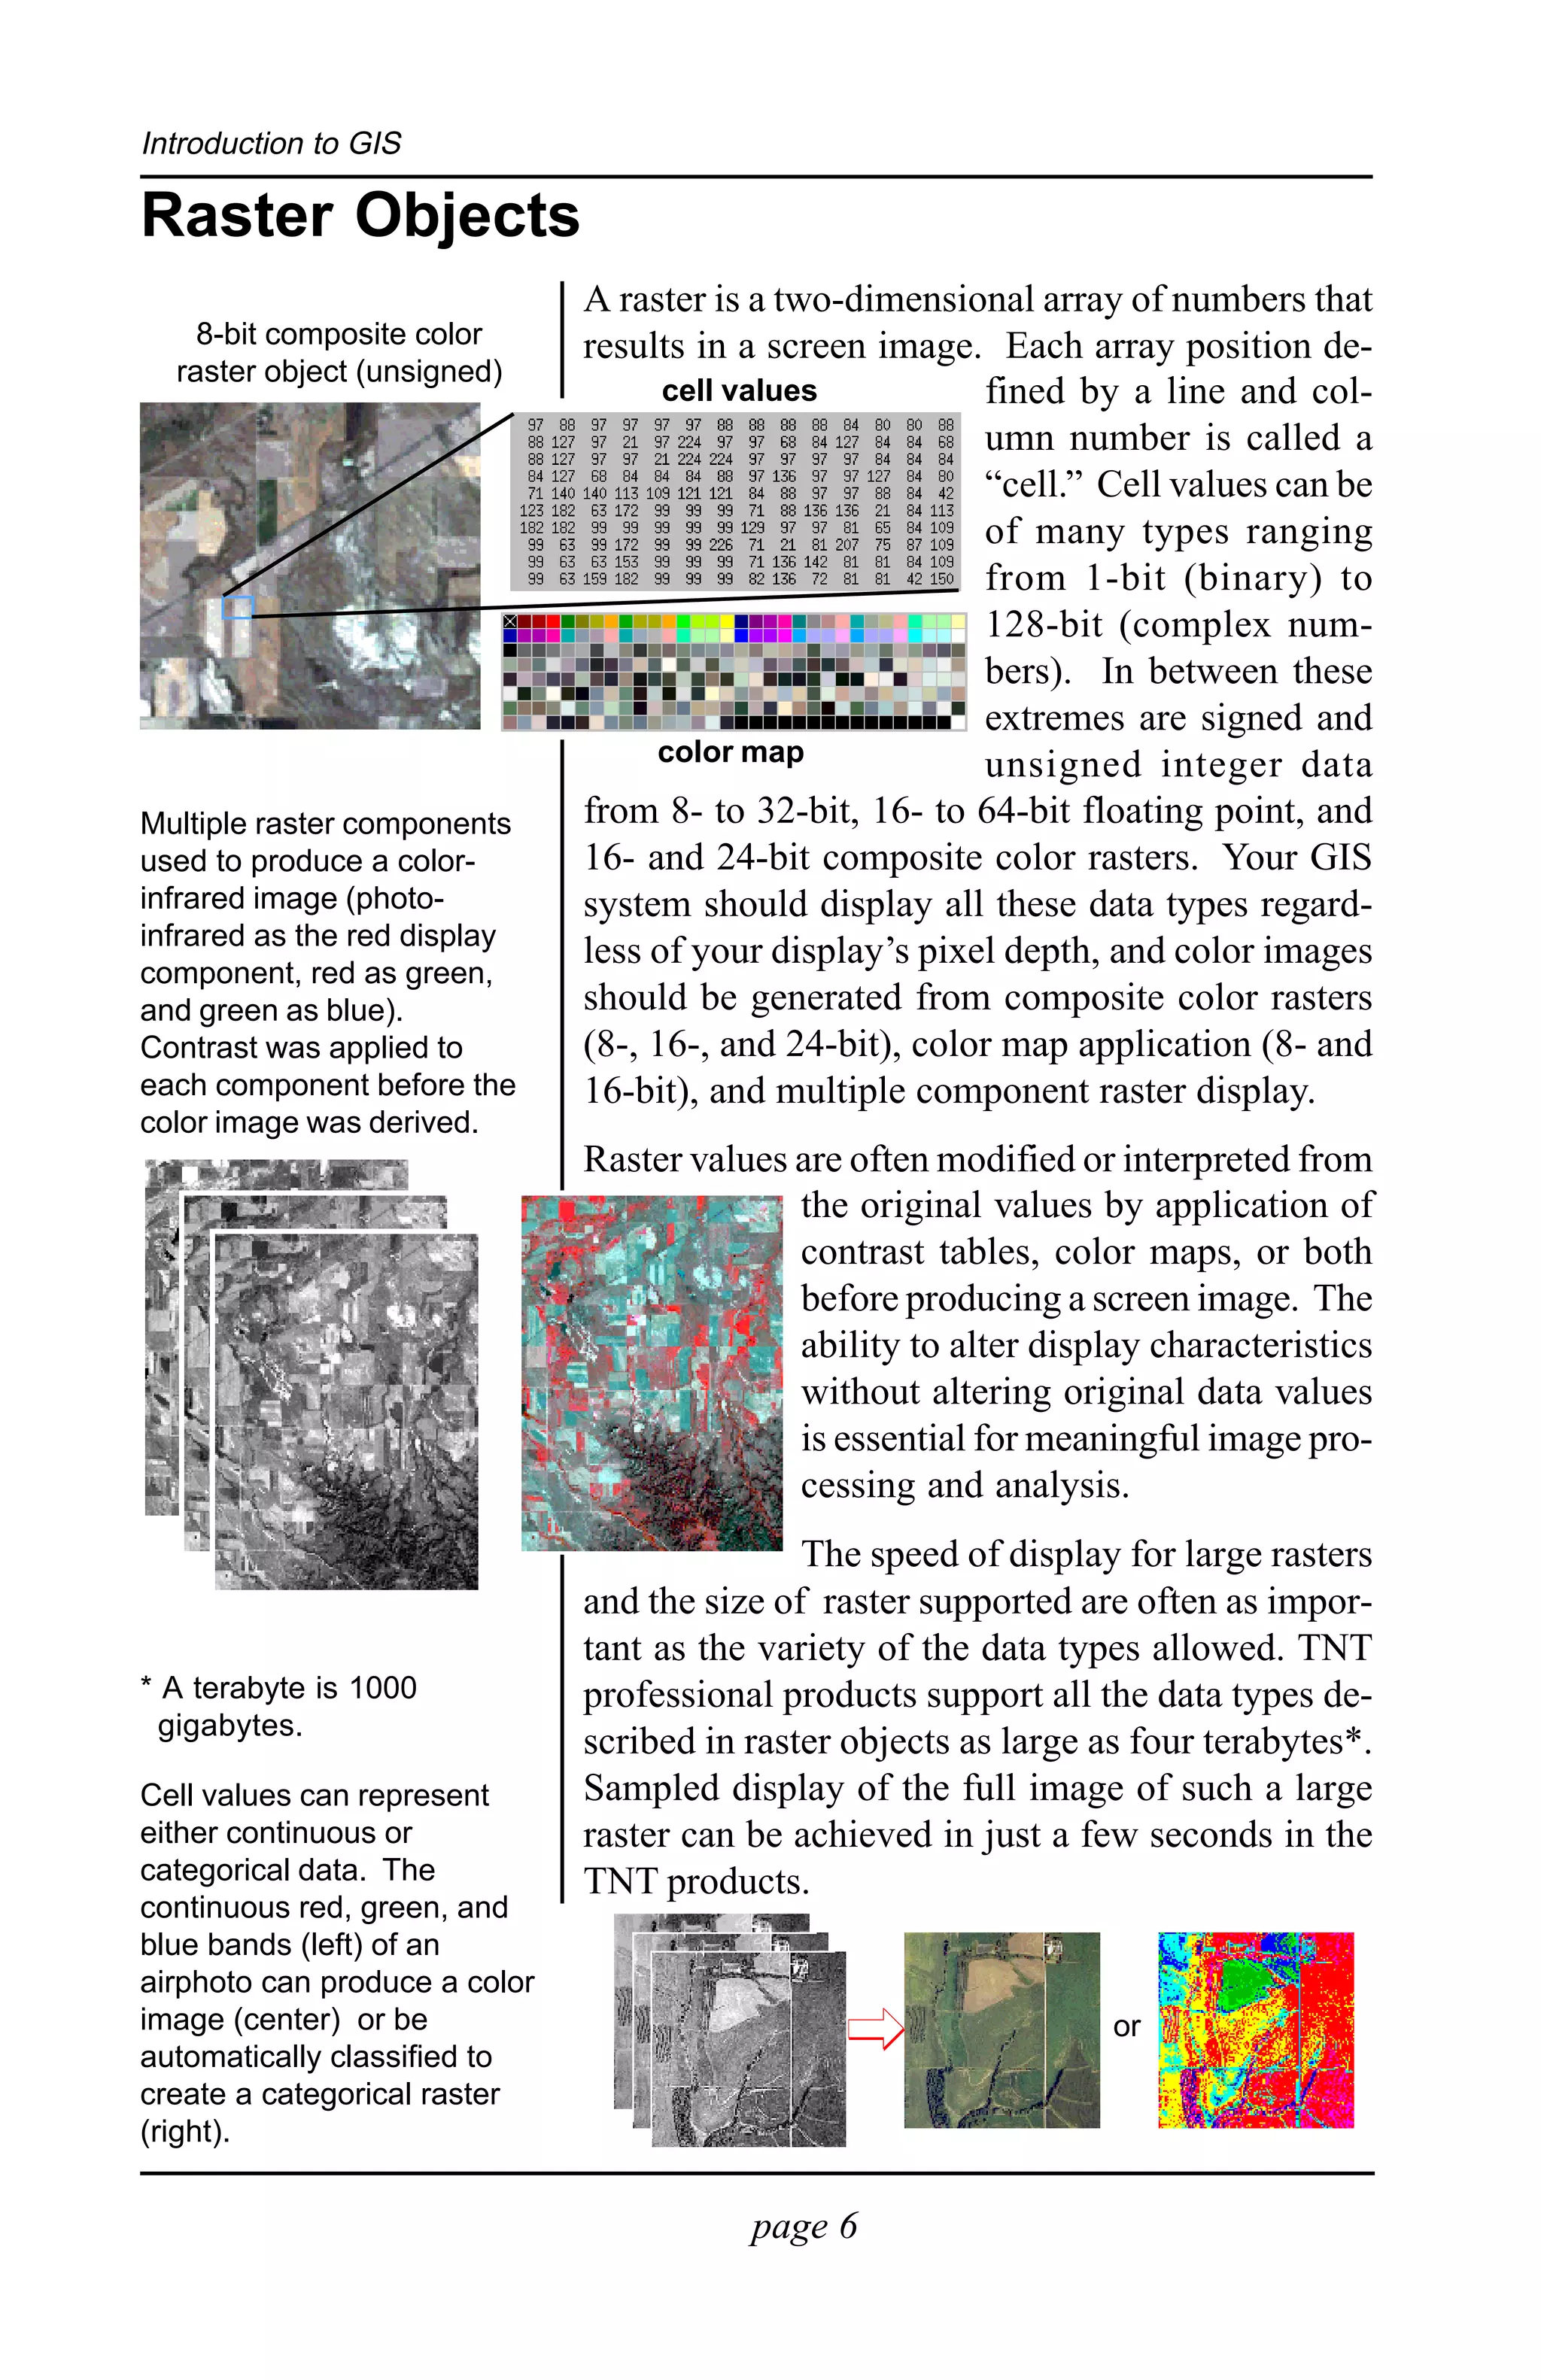
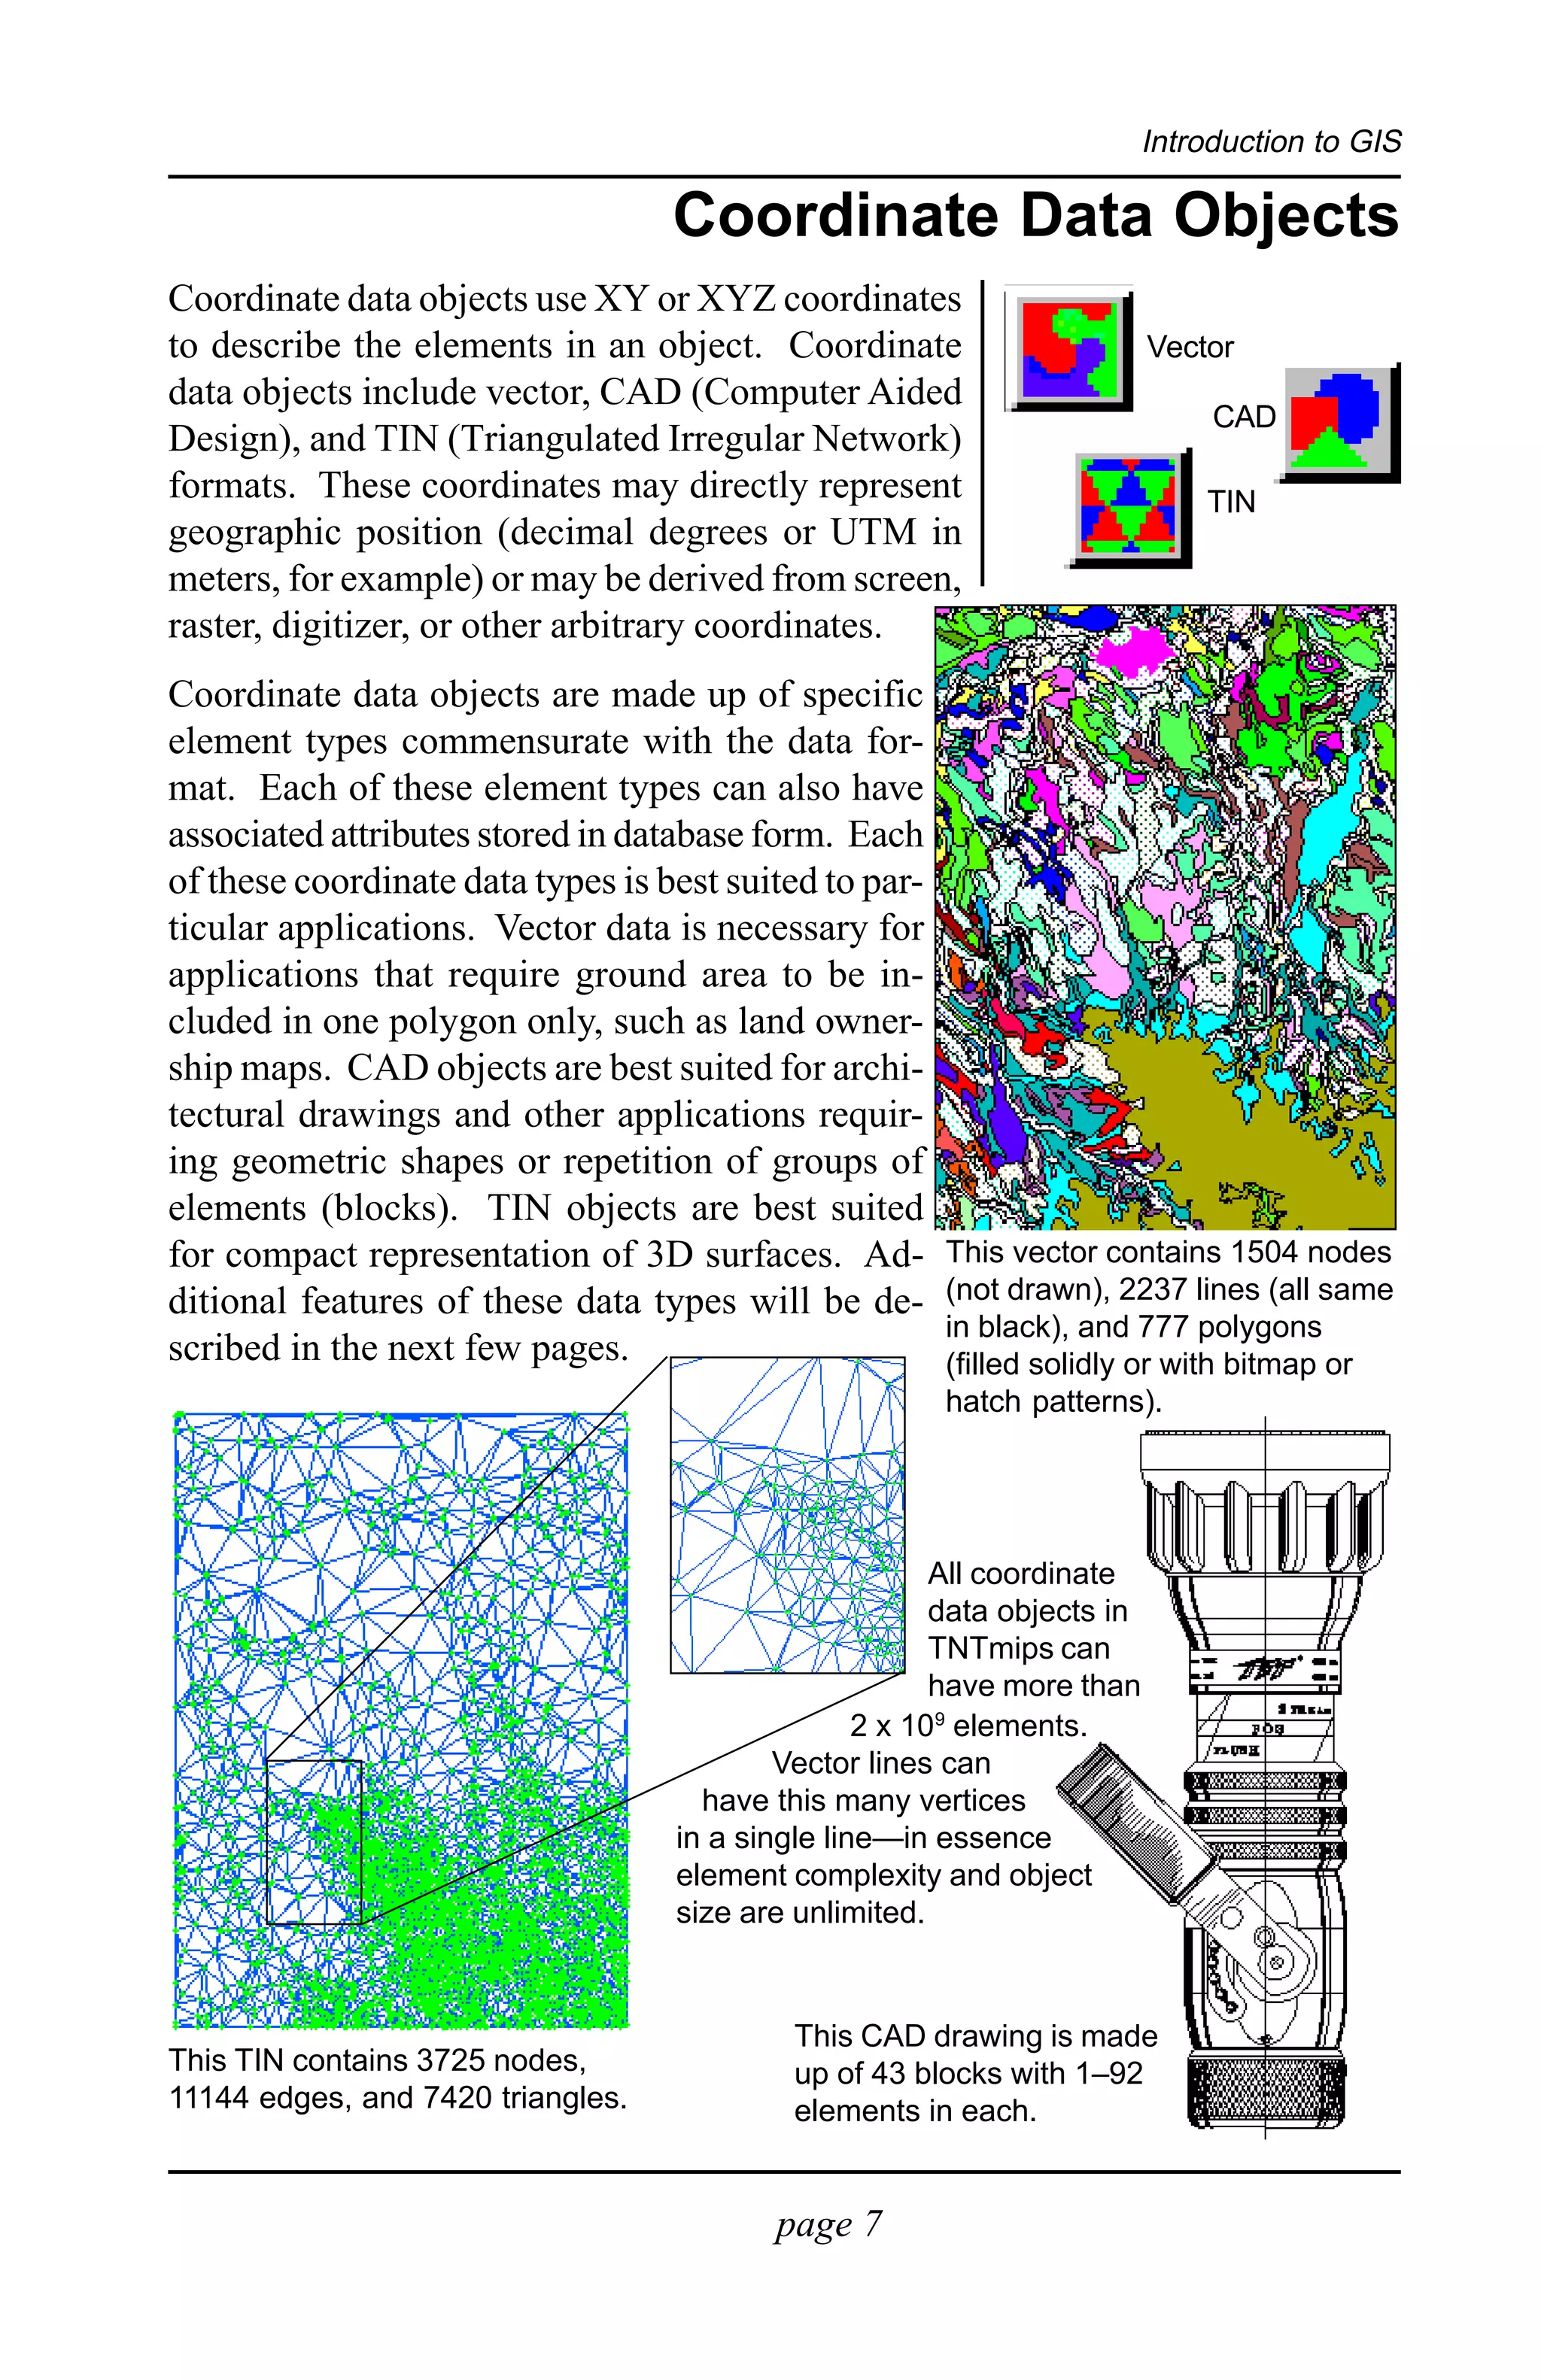
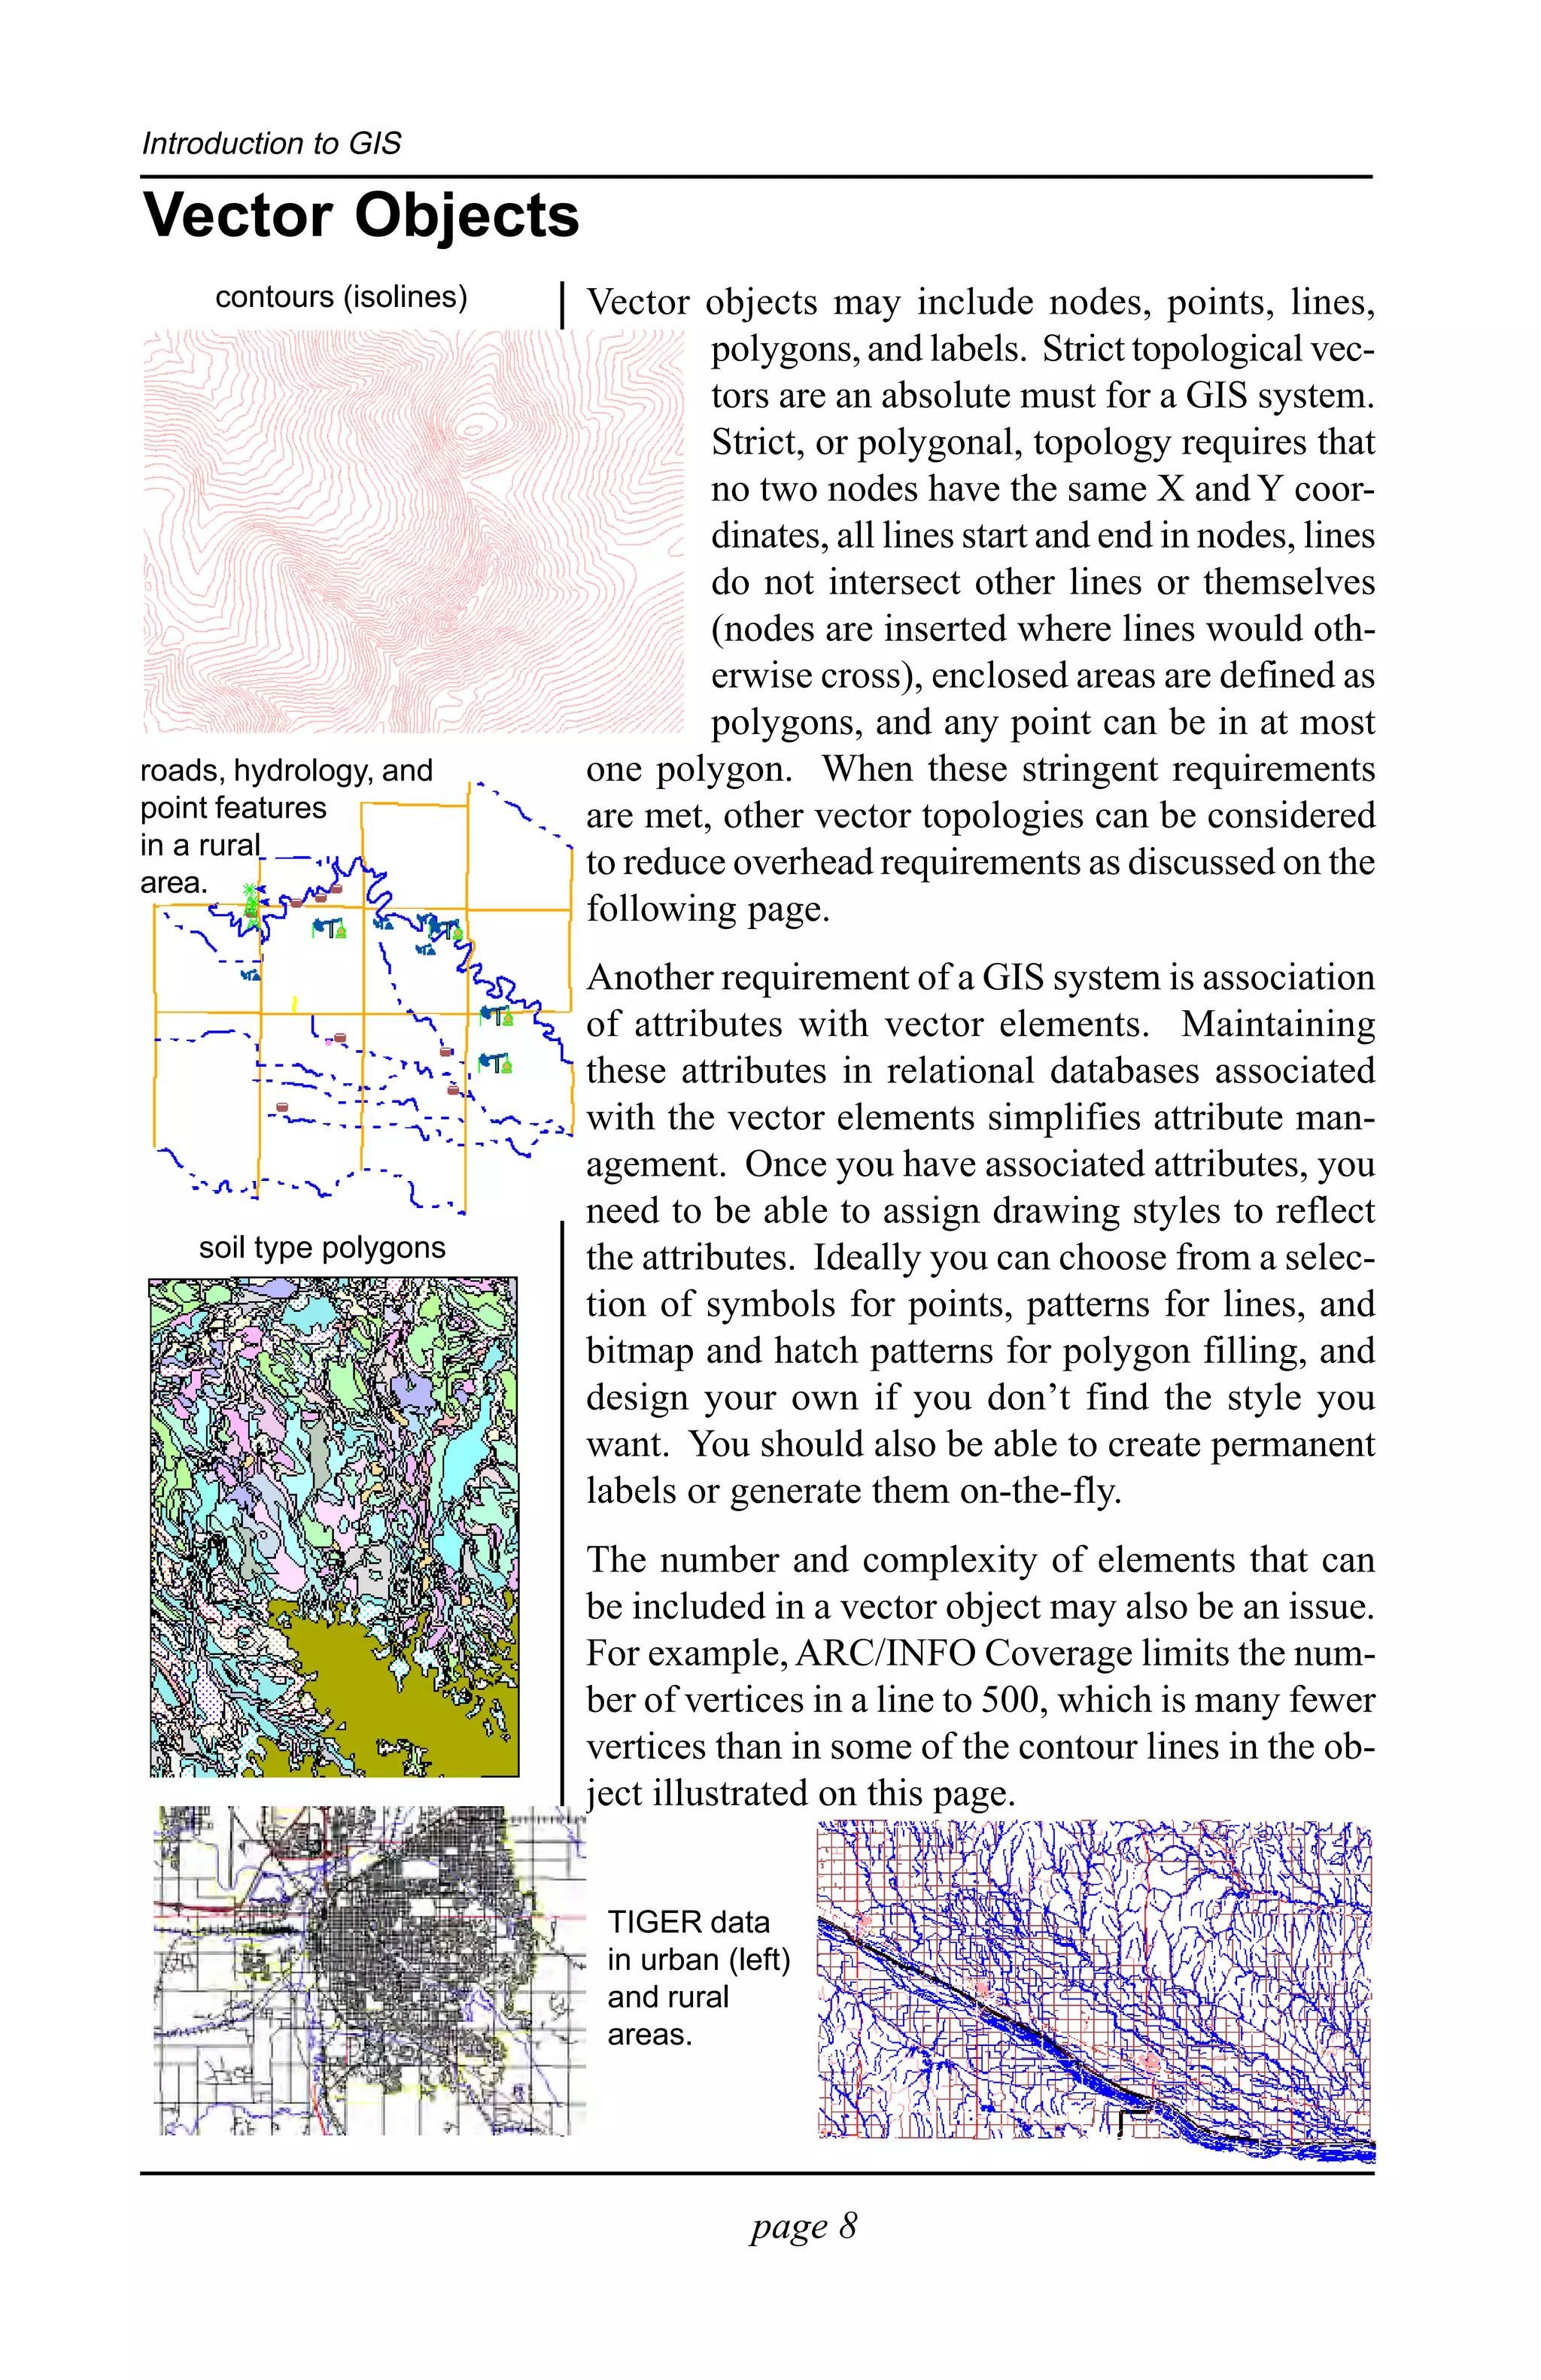
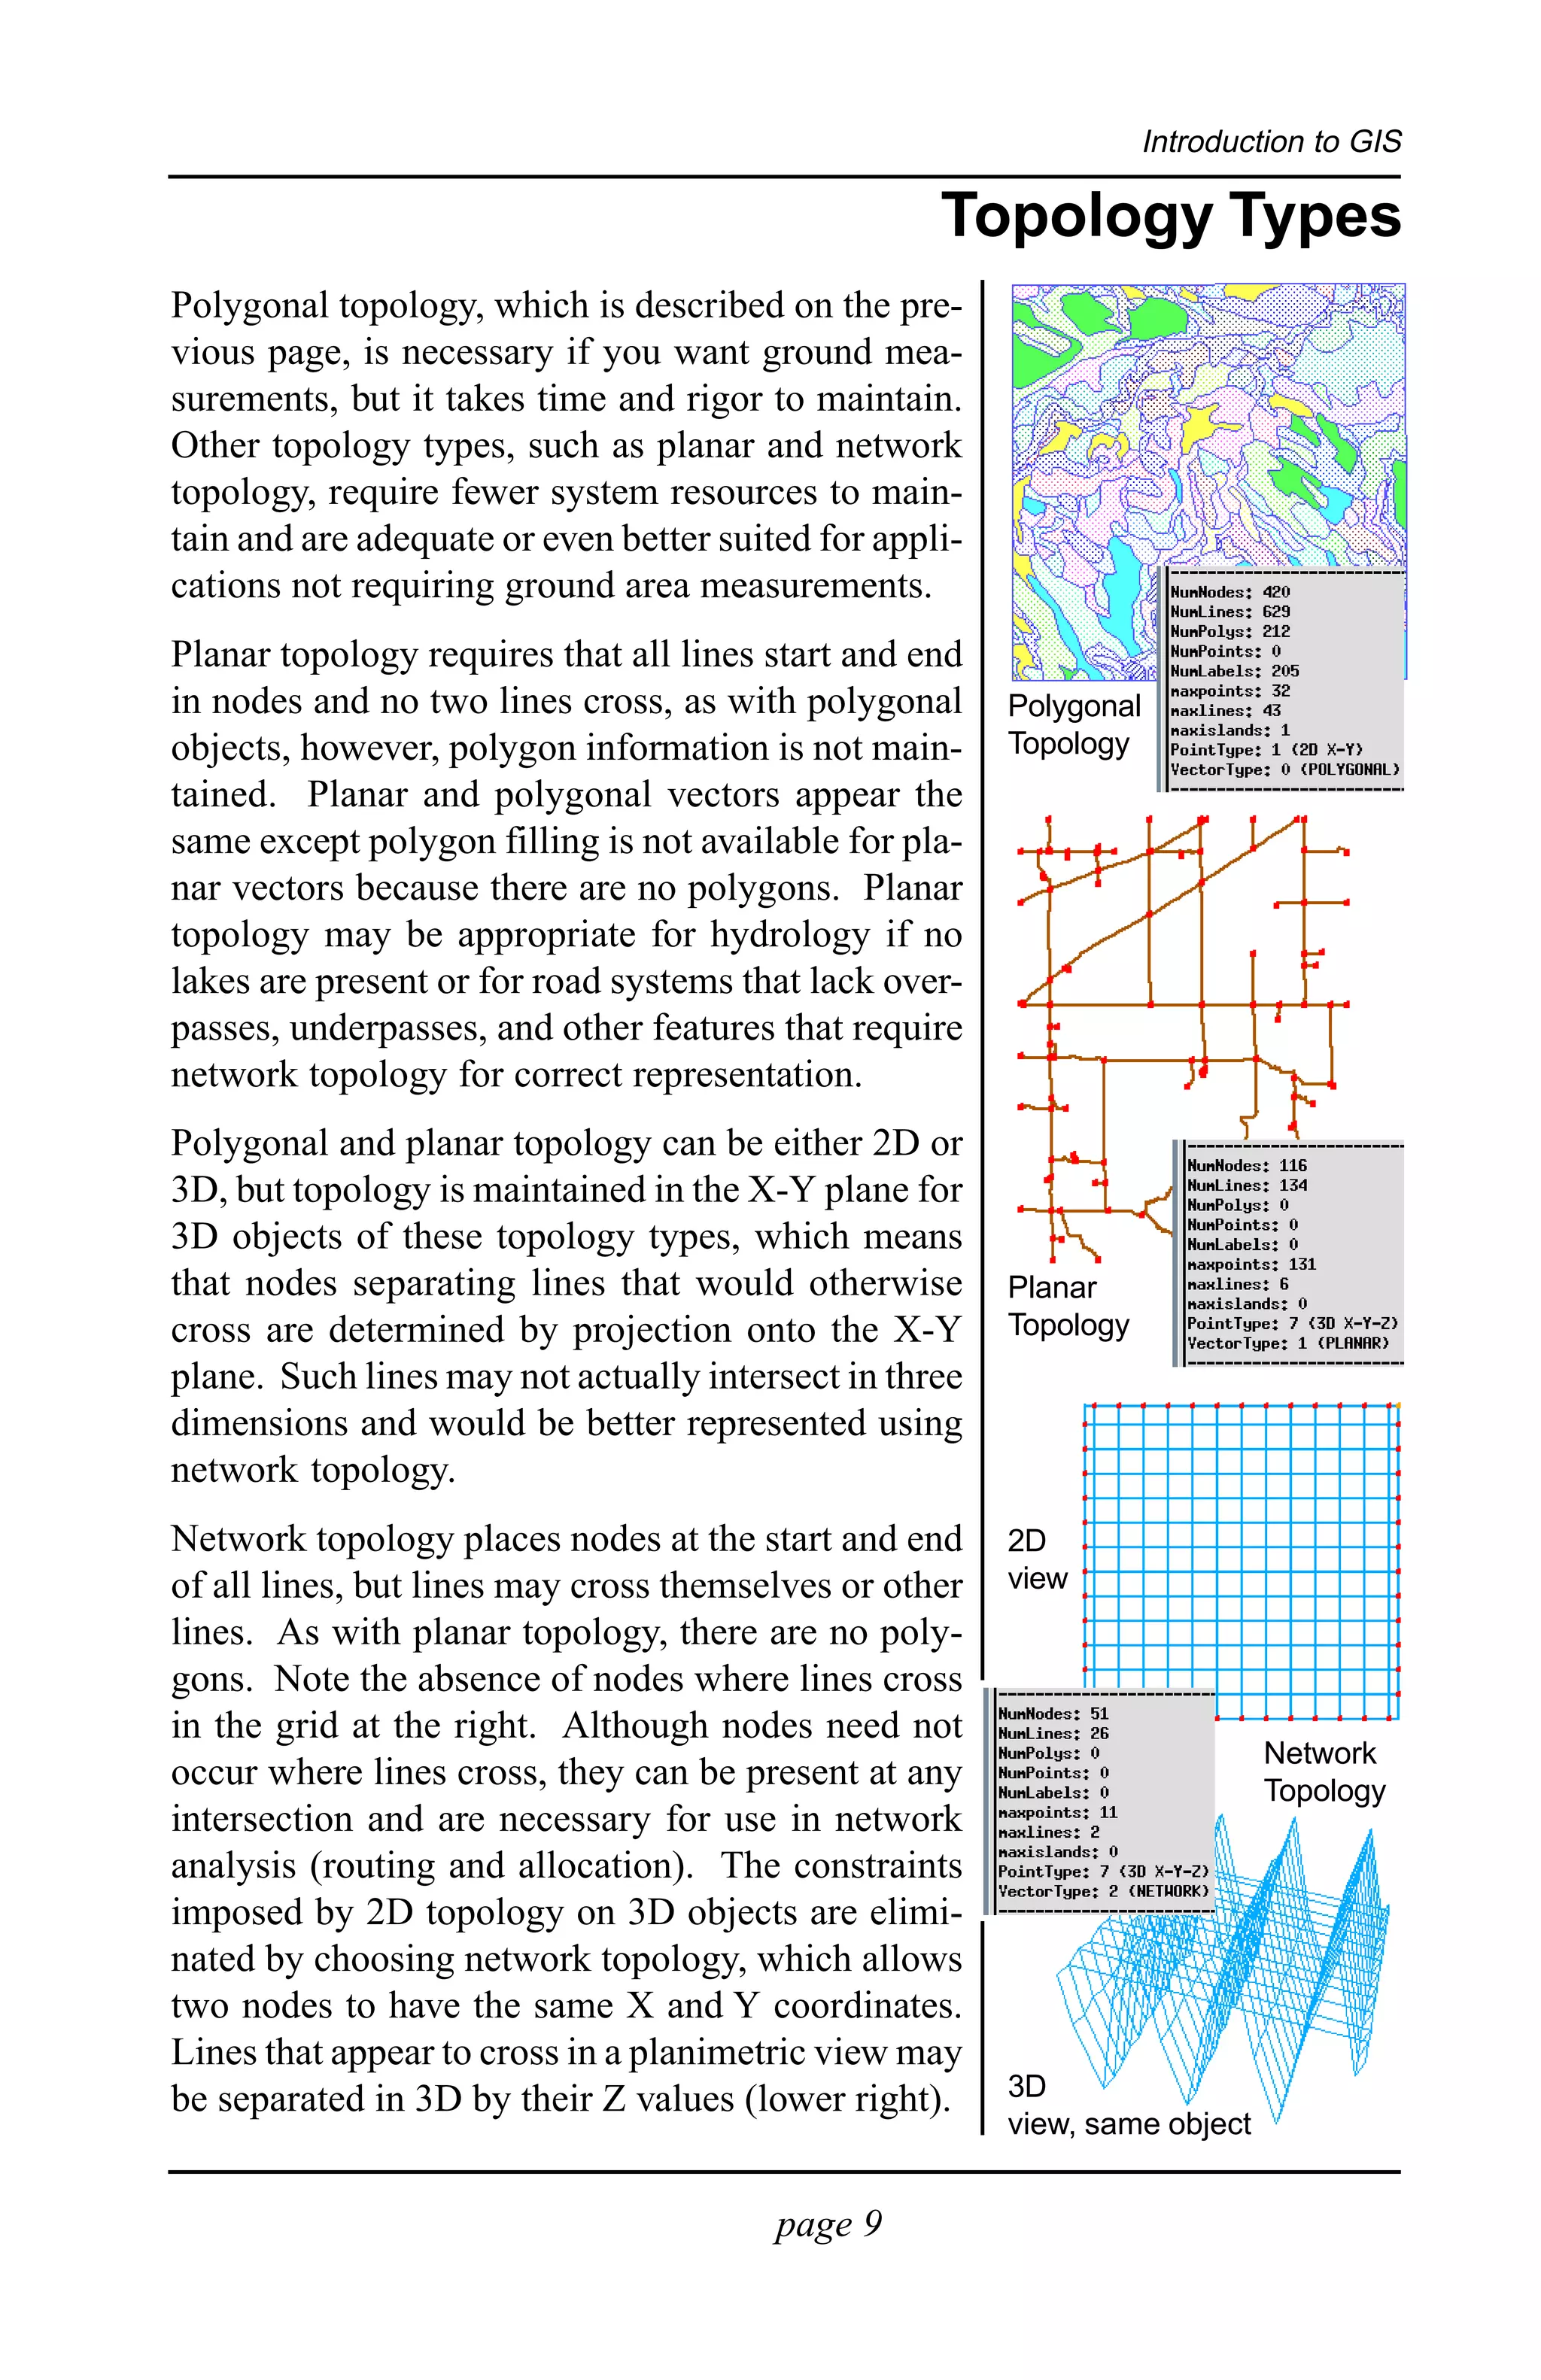
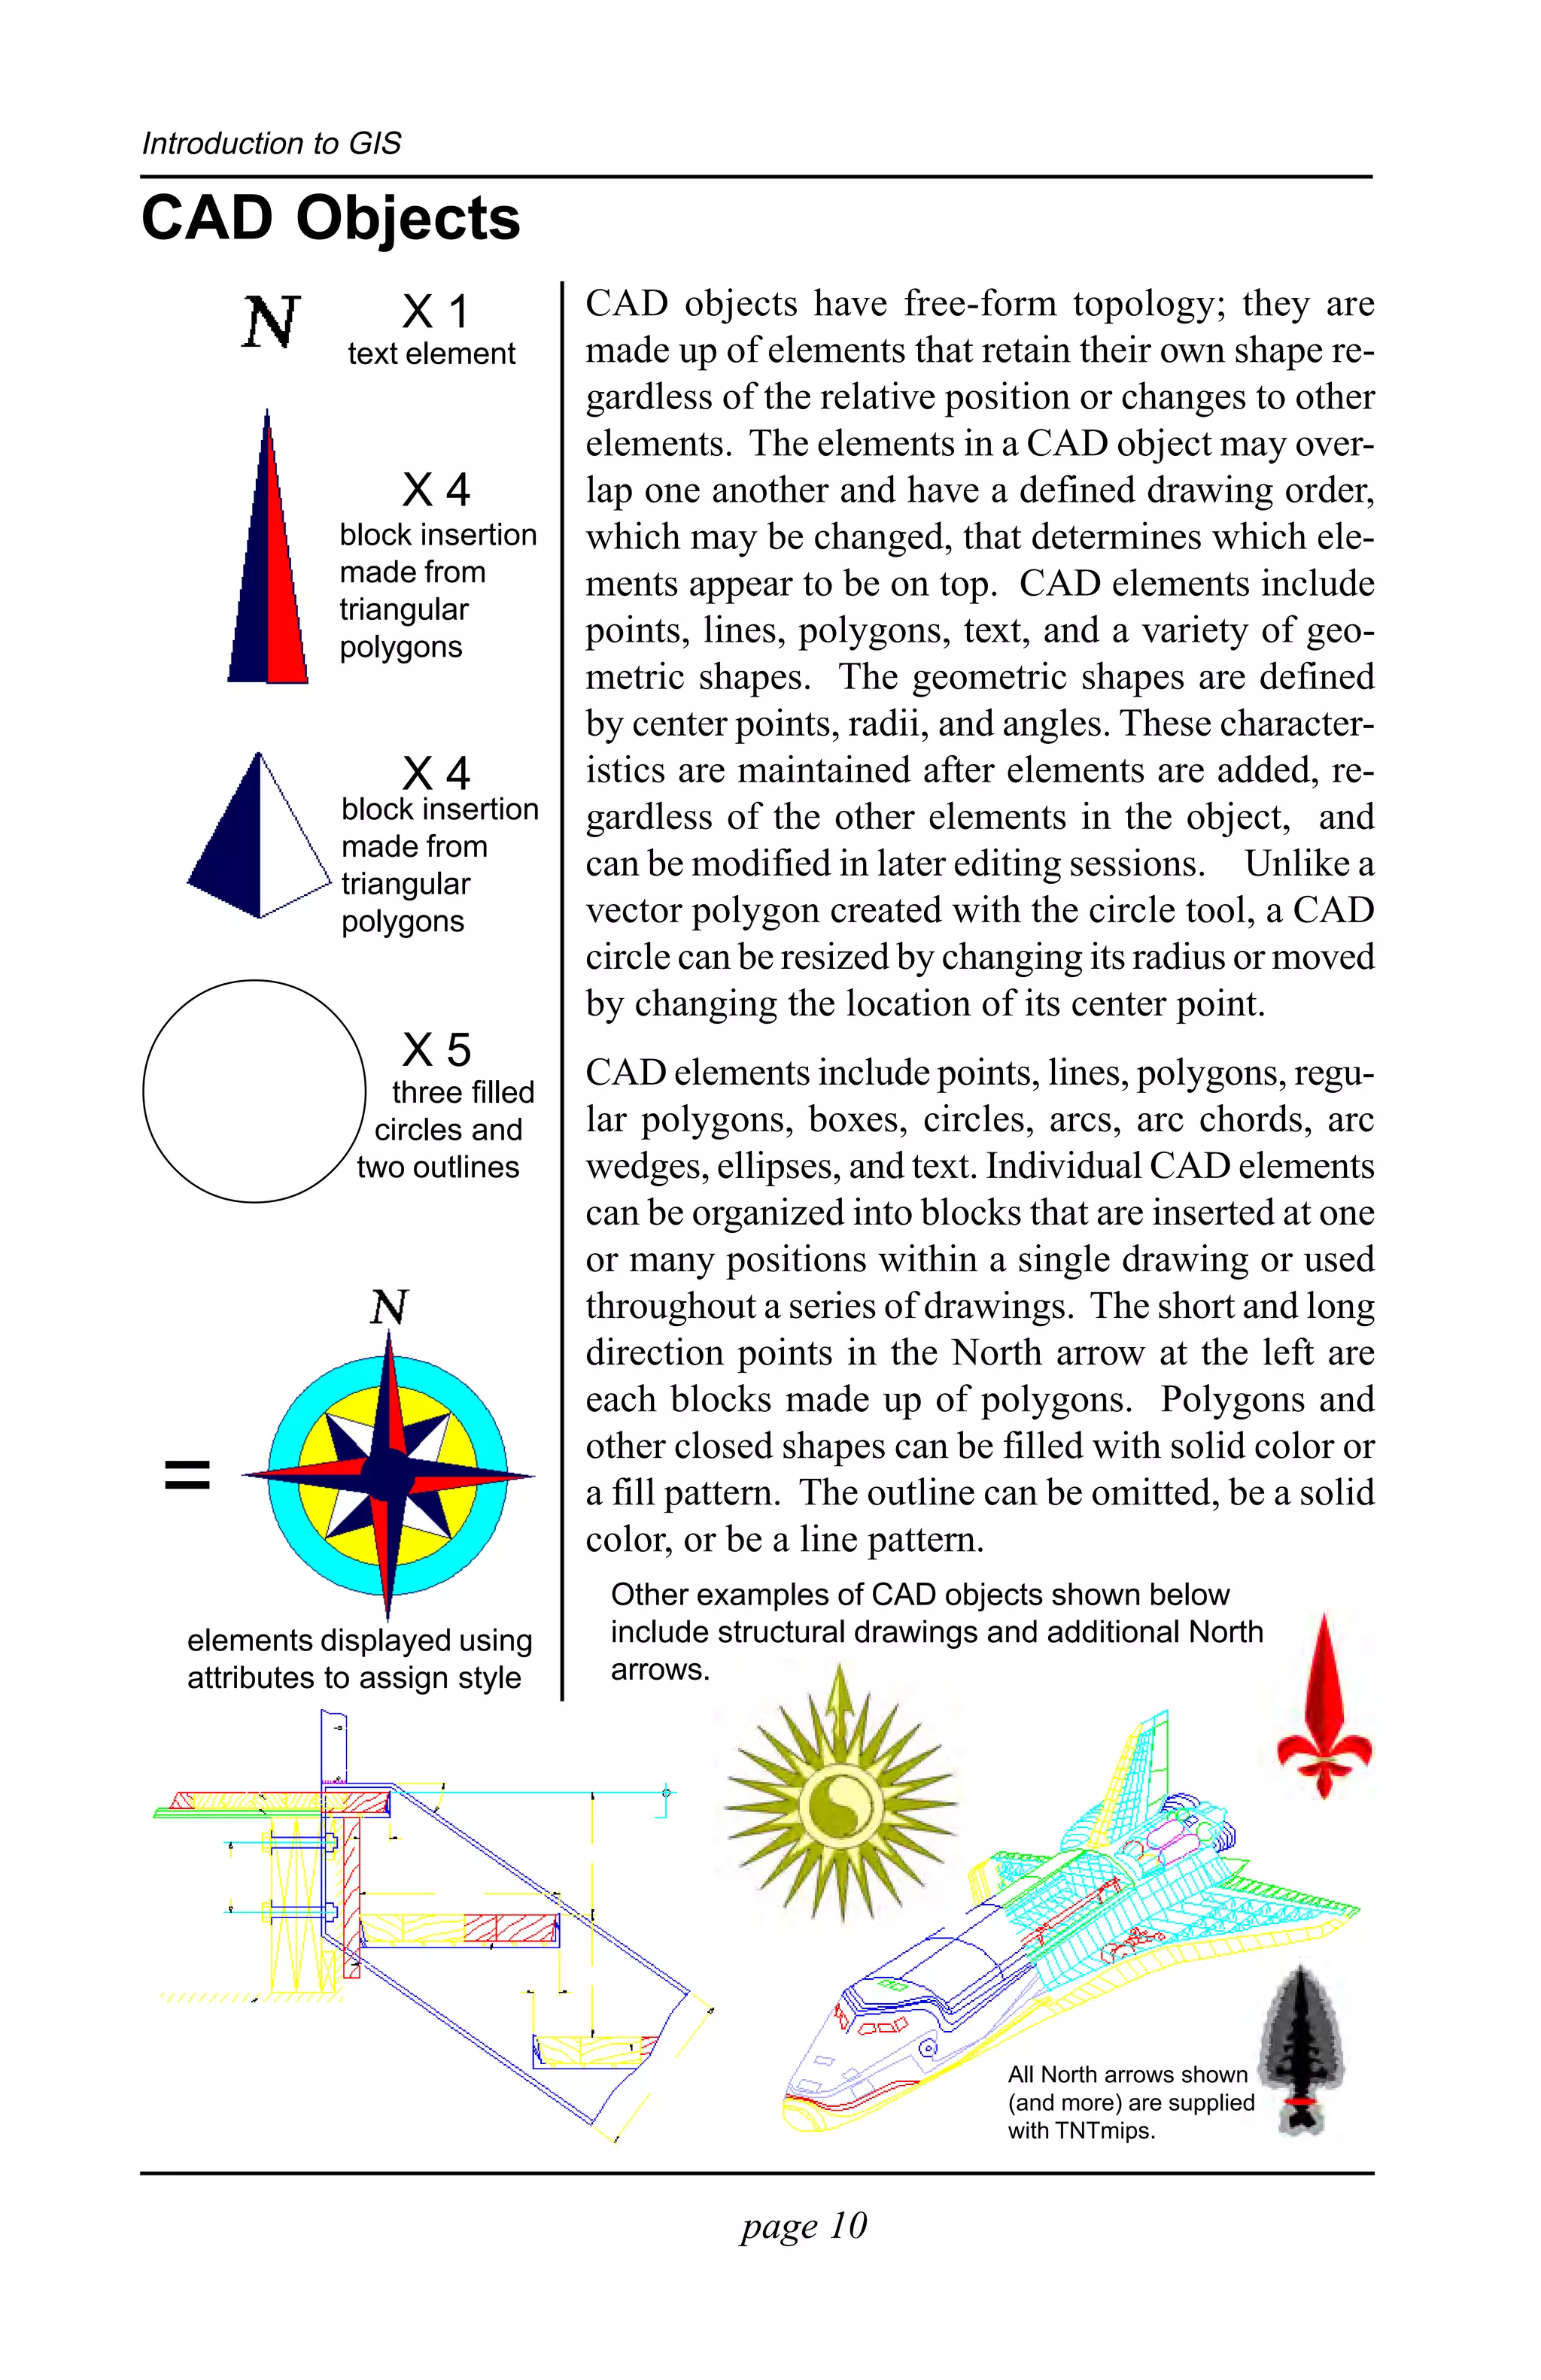
SlideShare a Scribd company logo
1 of 20
Download to read offline
I
N
T
    Introduction to         Introduction to GIS


R
O

G


              GIS
I
S


                                      with

                      TNTmips®
                   page 1
              TNTedit™ and TNTview®
Introduction to GIS

                      Before Getting Started
TNTmips®, TNTview®, and TNTedit™ all offer a wide variety of tools for those
working in the many fields that make use of Geographic Information Systems
(GIS). The purpose of this booklet is to acquaint you with the concepts and
tools required for the management and analysis of spatial data, which is the
primary focus of GIS. All of the features required for a robust GIS system are
available in TNTmips, which is used to demonstrate some of the tools and con-
cepts described throughout this book.
Prerequisite Skills This booklet assumes you have completed the exercises in
Displaying Geospatial Data and Navigating tutorial booklets. Those exercises
introduce essential skills and basic techniques that are not covered again here.
Please consult these booklets for any review you need.
Sample Data This booklet does not use exercises with specific sample data to
develop the topics presented in this booklet. You can, however, use the sample
data distributed with the TNT products to explore the ideas discussed on these
pages. If you do not have access to a TNT products CD, you can download the
data from MicroImages’ web site. Make a read-write copy on your hard drive of
data sets you want to use so changes can be saved.
More Documentation This booklet is intended only as an introduction to the
GIS functions in TNTmips, TNTedit, and TNTview. Consult the TNTmips ref-
erence manual and booklets in the Getting Started series for more information.
TNTmips and TNTlite® TNTmips comes in two versions: the professional ver-
sion and the free TNTlite version. This booklet refers to both versions as “TNT-
mips.” If you did not purchase the professional version (which requires a soft-
ware license key), TNTmips operates in TNTlite mode, which limits the size of
your project materials and enables data sharing only with other copies of TNT-
lite. All of the GIS processes described in this booklet can be performed in
TNTlite.


                                                Merri P. Skrdla, Ph.D., 6 May 2005
                                                  ©MicroImages, Inc. 2000–2005


 It may be difficult to identify the important points in some illustrations without a
 color copy of this booklet. You can print or read this booklet in color from
 MicroImages’ web site. The web site is also your source of the newest Getting
 Started booklets on other topics. You can download an installation guide, sample
 data, and the latest version of TNTlite.
                           http://www.microimages.com

                                           page 2
Introduction to GIS

                                      An Introduction to GIS
Geographic Information Systems (GIS) is an evolv-
ing, catchall phrase that initially referred to man-
agement of information with a geographic compo-
nent primarily stored in vector form with associated
attributes. This definition quickly became too re-
strictive with advances in software and ideas about
information management. An advanced GIS sys-
tem should be able to handle any spatial data, not
just data tied to the ground by geographic reference
points. The capacity to handle non-geographic spa-
tial data was formerly the domain of systems referred
to as AM/FM (Automated Mapping and Facilities
Management). Other non-geographic applications,
such as interactive medical encyclopedias that re-
trieve information based on the human form, should
also be manageable by a robust system.
Integration of imagery with vector data is now a
necessity for a full-featured GIS system. Imagery
was once thought to be the exclusive domain of
image processing systems, but is now often required
as a backdrop for vector, or other data, types.
No up-to-date GIS system is complete without sur-
face modeling and 3D (technically 2 1/2 D) visual-       Pages 4–5 introduce the
ization with “fly-by” capability. In addition to draw-   potential of GIS systems.
                                                         The different object types
ing a path for the simulation, you should be able to     used in managing spatial
orbit with the view directed at a specified point or     data are described on pages
have the view pan around a stationary viewer. Vec-       6–13. Subsequent pages
tor overlay on this 3D surface should also be an         discuss other processes
                                                         used in GIS systems, such
integral part of the package.                            as region and vector
A GIS system should be production oriented, which        combinations, and additional
                                                         features for the already
may or may not mean product oriented. Production         described object types, such
work in GIS involves making maps (a product), but        as theme mapping and
it also involves interactive analysis (a result which    legends.
may have no tangible product). This booklet starts
by looking at these two aspects of GIS systems and
then describes the facets of GIS systems needed to
reach the integrated goals.


                                         page 3
For a more complete treatment of this subject, see
Introduction to GIS                    Getting Started: Making Map Layouts

Making Maps and Posters
                                 GIS map making should transcend traditional car-
                                 tography—roads, streams, and political boundaries
                      A map      along with map grids, scale bars, and legends may
                      is...      be sufficient for some maps but are not an adequate
                                 reflection of a fully featured GIS system. You should
                                 be able to incorporate a satellite or airphoto image
                                 as the background for line and polygon data with
                                 transparent polygon filling to reveal the background
                                 through vector or CAD overlays. You should be
                                 able to incorporate enlarged insets and elements that
...built                         tie the components at both map scales together.
from...
                                 To make map making easy, a GIS system should
                                 include a variety of standard map components that
                                 can be readily added to a layout. These include
                                 map grids, scale bars, legends, annotation text, and
                                 a means of mixing georeferenced and
                                 ungeoreferenced groups (north arrows, company
                       ...many   logos) to complete the map. Each of these map com-
                       pieces.   ponents should be easily customizable; for example,
                                 with map grids you should be able to control the
                                 size and color of the text and lines, the grid spacing,
                                 the components of the grid, and so on.

                                                           Maps can take a
                                                           variety of forms.


                                            page 4
For a more complete treatment of this subject, see
Getting Started: Interactive Region Analysis                         Introduction to GIS

                                                               Interactive GIS
Another important aspect of a GIS system is the as-
sociation of attributes with elements and the ability
to select elements and view their attributes and to
                                                                              use attri-
use attributes to select elements. You should also                            butes to
be able to quickly identify elements that have no                             assign
attributes attached and elements with multiple at-                            style
tribute records attached.
Attributes should be dynamic so that new values
can be calculated on-the-fly from values in other
fields or other tables. Such computed fields
are then updated whenever the fields used                              select polygons;
in their calculation are updated. If values                            view attributes
for a computed field will not change once
calculated, there should be a means to make
values permanent. Attributes should also
be useful for theme mapping and be avail-
able for direct display (pin mapping) pro-
vided each record includes spatial coordi-
nates.


                                                                        Generate
                                                                        buffer zones
                                                                        around
                                                                        selected
                                                                        polygons.


select attributes;
view polygons


Buffer zones used to extract rivers within 500 m (in red) of
the selected soil types. Attributes for one of the extracted
                         lines (magenta) are shown.


                                             page 5
Introduction to GIS

Raster Objects
                               A raster is a two-dimensional array of numbers that
    8-bit composite color      results in a screen image. Each array position de-
  raster object (unsigned)
                                     cell values          fined by a line and col-
                                                          umn number is called a
                                                          “cell.” Cell values can be
                                                          of many types ranging
                                                          from 1-bit (binary) to
                                                          128-bit (complex num-
                                                          bers). In between these
                                                          extremes are signed and
                                    color map             unsigned integer data
Multiple raster components     from 8- to 32-bit, 16- to 64-bit floating point, and
used to produce a color-       16- and 24-bit composite color rasters. Your GIS
infrared image (photo-         system should display all these data types regard-
infrared as the red display
                               less of your display’s pixel depth, and color images
component, red as green,
and green as blue).            should be generated from composite color rasters
Contrast was applied to        (8-, 16-, and 24-bit), color map application (8- and
each component before the      16-bit), and multiple component raster display.
color image was derived.
                               Raster values are often modified or interpreted from
                                             the original values by application of
                                             contrast tables, color maps, or both
                                             before producing a screen image. The
                                             ability to alter display characteristics
                                             without altering original data values
                                             is essential for meaningful image pro-
                                             cessing and analysis.
                                              The speed of display for large rasters
                               and the size of raster supported are often as impor-
                               tant as the variety of the data types allowed. TNT
* A terabyte is 1000           professional products support all the data types de-
  gigabytes.
                               scribed in raster objects as large as four terabytes*.
Cell values can represent      Sampled display of the full image of such a large
either continuous or           raster can be achieved in just a few seconds in the
categorical data. The          TNT products.
continuous red, green, and
blue bands (left) of an
airphoto can produce a color
image (center) or be                                               or
automatically classified to
create a categorical raster
(right).


                                          page 6
Introduction to GIS

                                   Coordinate Data Objects
Coordinate data objects use XY or XYZ coordinates
to describe the elements in an object. Coordinate                         Vector
data objects include vector, CAD (Computer Aided
                                                                              CAD
Design), and TIN (Triangulated Irregular Network)
formats. These coordinates may directly represent                             TIN
geographic position (decimal degrees or UTM in
meters, for example) or may be derived from screen,
raster, digitizer, or other arbitrary coordinates.
Coordinate data objects are made up of specific
element types commensurate with the data for-
mat. Each of these element types can also have
associated attributes stored in database form. Each
of these coordinate data types is best suited to par-
ticular applications. Vector data is necessary for
applications that require ground area to be in-
cluded in one polygon only, such as land owner-
ship maps. CAD objects are best suited for archi-
tectural drawings and other applications requir-
ing geometric shapes or repetition of groups of
elements (blocks). TIN objects are best suited
for compact representation of 3D surfaces. Ad-          This vector contains 1504 nodes
ditional features of these data types will be de-       (not drawn), 2237 lines (all same
                                                        in black), and 777 polygons
scribed in the next few pages.                          (filled solidly or with bitmap or
                                                        hatch patterns).


                                                        All coordinate
                                                        data objects in
                                                        TNTmips can
                                                        have more than
                                                  2 x 10⁹ elements.
                                           Vector lines can
                                     have this many vertices
                                   in a single line—in essence
                                   element complexity and object
                                   size are unlimited.


                                            This CAD drawing is made
This TIN contains 3725 nodes,               up of 43 blocks with 1–92
11144 edges, and 7420 triangles.            elements in each.


                                          page 7
Introduction to GIS

Vector Objects
     contours (isolines)   Vector objects may include nodes, points, lines,
                                   polygons, and labels. Strict topological vec-
                                   tors are an absolute must for a GIS system.
                                   Strict, or polygonal, topology requires that
                                   no two nodes have the same X and Y coor-
                                   dinates, all lines start and end in nodes, lines
                                   do not intersect other lines or themselves
                                   (nodes are inserted where lines would oth-
                                   erwise cross), enclosed areas are defined as
                                   polygons, and any point can be in at most
roads, hydrology, and      one polygon. When these stringent requirements
point features             are met, other vector topologies can be considered
in a rural
area.
                           to reduce overhead requirements as discussed on the
                           following page.
                           Another requirement of a GIS system is association
                           of attributes with vector elements. Maintaining
                           these attributes in relational databases associated
                           with the vector elements simplifies attribute man-
                           agement. Once you have associated attributes, you
                           need to be able to assign drawing styles to reflect
    soil type polygons     the attributes. Ideally you can choose from a selec-
                           tion of symbols for points, patterns for lines, and
                           bitmap and hatch patterns for polygon filling, and
                           design your own if you don’t find the style you
                           want. You should also be able to create permanent
                           labels or generate them on-the-fly.
                           The number and complexity of elements that can
                           be included in a vector object may also be an issue.
                           For example, ARC/INFO Coverage limits the num-
                           ber of vertices in a line to 500, which is many fewer
                           vertices than in some of the contour lines in the ob-
                           ject illustrated on this page.


                            TIGER data
                            in urban (left)
                            and rural
                            areas.


                                       page 8
Introduction to GIS

                                                    Topology Types
Polygonal topology, which is described on the pre-
vious page, is necessary if you want ground mea-
surements, but it takes time and rigor to maintain.
Other topology types, such as planar and network
topology, require fewer system resources to main-
tain and are adequate or even better suited for appli-
cations not requiring ground area measurements.
Planar topology requires that all lines start and end
in nodes and no two lines cross, as with polygonal       Polygonal
objects, however, polygon information is not main-       Topology
tained. Planar and polygonal vectors appear the
same except polygon filling is not available for pla-
nar vectors because there are no polygons. Planar
topology may be appropriate for hydrology if no
lakes are present or for road systems that lack over-
passes, underpasses, and other features that require
network topology for correct representation.
Polygonal and planar topology can be either 2D or
3D, but topology is maintained in the X-Y plane for
3D objects of these topology types, which means
that nodes separating lines that would otherwise         Planar
cross are determined by projection onto the X-Y          Topology
plane. Such lines may not actually intersect in three
dimensions and would be better represented using
network topology.
Network topology places nodes at the start and end       2D
of all lines, but lines may cross themselves or other    view
lines. As with planar topology, there are no poly-
gons. Note the absence of nodes where lines cross
in the grid at the right. Although nodes need not
                                                                             Network
occur where lines cross, they can be present at any                          Topology
intersection and are necessary for use in network
analysis (routing and allocation). The constraints
imposed by 2D topology on 3D objects are elimi-
nated by choosing network topology, which allows
two nodes to have the same X and Y coordinates.
Lines that appear to cross in a planimetric view may
be separated in 3D by their Z values (lower right).      3D
                                                         view, same object


                                         page 9
Introduction to GIS

CAD Objects
                      X1        CAD objects have free-form topology; they are
               text element     made up of elements that retain their own shape re-
                                gardless of the relative position or changes to other
                                elements. The elements in a CAD object may over-
                      X4        lap one another and have a defined drawing order,
              block insertion   which may be changed, that determines which ele-
              made from         ments appear to be on top. CAD elements include
              triangular
              polygons          points, lines, polygons, text, and a variety of geo-
                                metric shapes. The geometric shapes are defined
                                by center points, radii, and angles. These character-
                      X4        istics are maintained after elements are added, re-
              block insertion   gardless of the other elements in the object, and
              made from
              triangular
                                can be modified in later editing sessions. Unlike a
              polygons          vector polygon created with the circle tool, a CAD
                                circle can be resized by changing its radius or moved
                                by changing the location of its center point.
                      X5        CAD elements include points, lines, polygons, regu-
                 three filled
                circles and     lar polygons, boxes, circles, arcs, arc chords, arc
               two outlines     wedges, ellipses, and text. Individual CAD elements
                                can be organized into blocks that are inserted at one
                                or many positions within a single drawing or used
                                throughout a series of drawings. The short and long
                                direction points in the North arrow at the left are
                                each blocks made up of polygons. Polygons and
                                other closed shapes can be filled with solid color or
 =                              a fill pattern. The outline can be omitted, be a solid
                                color, or be a line pattern.
                                 Other examples of CAD objects shown below
   elements displayed using      include structural drawings and additional North
   attributes to assign style    arrows.


                                                              All North arrows shown
                                                              (and more) are supplied
                                                              with TNTmips.


                                          page 10
Introduction to GIS

                                                            TIN Objects
TINs (Triangulated Irregular Networks) are com-
posed of nodes, edges, and triangles. The nodes are
irregularly spaced three-dimensional points, con-
nected by edges to represent a surface as a set of
adjacent, conterminous triangles constructed so that
every triangle satisfies the Delaunay criterion.
Delaunay triangulation requires that triangles con-
structed from a randomly dispersed set of points are
as small and equilateral as possible. Choosing points
for a triangle is an arbitrary process; results are
unique; from a set of points there is only one set of
triangles that meet the Delaunay criterion.
                                                         When standard attributes
TINs are one of three formats commonly used to           are generated for a TIN
represent functional surfaces, such as the Earth’s       object, slope and aspect are
                                                         calculated for each triangle
surface. [The other two are Digital Elevation Mod-       (in addition to area,
els (DEMs) and contour maps.] The TIN data struc-        perimeter, and center
ture minimizes the number of points needed to ac-        coordinates). These
curately represent surface variations.                   attributes can be used to
                                                         determine fill colors for the
TINs can be represented directly as contours, either     triangles that convey a good
                                                         deal about the topography
alone or in combination with nodes, edges, and / or
                                                         even in a 2D view (below).
triangles. The standard attributes calculated for TIN
objects include slope and aspect, which can be used
to shade the triangles so these attributes are readily
conveyed even in 2D representations.


A TIN object shown in 3D perspective view
with overlaid contours generated on-the-fly
(above) and the contours alone (below). The
2D view of the same TIN (right) shows the
triangles filled with a color assigned by a
script that uses the slope and aspect of the
triangles to determine the color.


                                          page 11
For a more complete treatment of this subject, see
Introduction to GIS                                       Getting Started: Pin Mapping

Making Pin Maps
Pin mapping should provide      A pin map directly visualizes database information
a means to distinguish          if each record has coordinates for the location of
multiple pins with the same
coordinates, such as the        the observation or report. You could plot telemetry
pins shown below for the        data for a variety of animals, the location of cities,
same sites in three different   or the position of trucks on the road. Direct display
years. Symbol scale can         from database offers some advantages over vector
also vary with field values.
                                format for point data. New points are added simply
                                by adding records to the database and the location
                                of points can be updated by changing coordinates.
                                In TNTmips databases used for pinmap display can
                                be in internal format, linked to a supported format
                                     (such as dBASE IV, INFO, or FoxPro), or com-
                                     municated with using ODBC (Open Database
                                Connectivity to Oracle, for example). With direct
                                linking or ODBC, the database can be maintained
                                by external software and viewed with all updates
                                available the next time you redraw the pinmap.
                                You can display all locations in the same style or
                                use other attributes to determine how a “pin” is dis-
You should also be able to      played. For example, you can use production to
include values for multiple
fields from the same record.
                                determine the size of symbols for oil wells or, in the
The TNT products let you        case of telemetry data, you can represent observa-
choose between bar graphs       tions for different animals with different symbols.
or pie charts with the option   You can even incorporate multiple attributes into a
of including multiple line
labels.
                                pie chart or bar graph.

                                     The same
                                     records shown
                                     as a bar graph
                                     (left) and a pie
                                     chart (right) with
                                     different back-
                                     ground layers.
                                     The bar graph
                                     includes labels
                                     for each of the
                                     fields graphed.


                                           page 12
For a more complete treatment of this subject, see
Getting Started: Managing Geoattributes                 Introduction to GIS

                                              Attribute Databases
Attribute databases keep track of information asso-
ciated with coordinate data elements, such
as a polygon’s soil class, the road type of a
line, or the identity of a point. These kinds
of attributes are generally primary keys,
which can be used for styling by attribute.
Other attributes, such as population of a city or
crop yield of a polygon, can be used for theme map-
ping or styling by query. You should
be able to calculate new information
from values in existing fields, such
as population density from popula-
tion and area fields or the percent-
age of the population in the four larg-
est cities as shown at the right. String
fields can also be concatenated if de-
sired.
Attribute databases can also
be associated with raster ob-
jects by cell value, which may
be useful for rasters created
by interpretive processes,
such as Feature Mapping and
Automatic Classification.
You can select elements and view their                      All of these
associated attributes or choose attributes                  fields are
                                                            “computed,”
and highlight the elements that have
                                                            which means
them. You can query the database to                         they are
select elements with particular attribute                   derived from
values.                                                     values in
                                                            other tables.
This query selects all
state polygons with
population greater than
3 million in 1990. The
number of polygons
selected (reported at
bottom of query window)
is much larger than the
number of states because most coastal
states have islands offshore.


                                           page 13
For a more complete treatment of this subject, see
Introduction to GIS                           Getting Started: Interactive Region Analysis

Using Regions
Use the line                                              Regions are areas of interest
drawing tool or                                           used primarily for selection—
a selected line
to evaluate a                                             selection for viewing at-
potential dam                                             tributes, for extracting, or for
site.                                                     other processing. In some
                                                          cases, such as flood zone or
                                                          watershed regions, the region
                                                          itself is the desired product.
                                                         Regions can be interac-
                                                         tively and iteratively cre-
The region can delimit either                            ated. You choose the cells
the potential lake area be-                              or elements of interest,
hind a dam of specified
height (above) or the area
                                                         then the desired region cre-
that would flood if the dam                              ation process, adjust region
broke (right).                   parameters, generate a region, alter parameters as
                                         necessary and generate another region
                                         until you are satisfied with the results and
                                         choose to keep that region. Regions can
                                         be temporary, available only for the cur-
                                         rent display session, or you can choose to
                                         save a region to be used at a later time or
Hold the left or                         in other processes.
right mouse
button to get                               Region generation methods available in
DataTips.                                   TNTmips and not mentioned elsewhere on
                                            this page include selected polygons, buffer
                                            zones, viewshed, Voronoi regions, raster
                                            texture growth, and cell values.
                                   Internal.ElemNum <= 54 or Internal.ElemNum >= 144


K Means cluster regions with all (left) or query selected points (middle) and the region
formed by Polygon Fitting (Tessellation, right) with the same query selected elements.


                                             page 14
Introduction to GIS

                                      Generating Buffer Zones
Generation of buffer zones can be much
more sophisticated than the simplistic
one buffer distance for selected ele-
ments available for regions. You can                                          Hydrology with
                                                                              lines classified
elect to buffer all lines or lines selected                                   as intermittent
from the screen or by attribute, as is the                                    (thin) or
case when creating buffer zone regions.                                       perennial (wide)
Additionally, when making vector                                              streams or
                                                                              shorelines.
buffer zones, you can assign different
buffer distances by attribute values and
choose whether to maintain separate
buffer zones by attribute or merge buffer zones that
intersect. The attributes of elements buffered can
also be transferred to the resulting buffer zone vec-
tor polygons (regions do not have as-
                                            Buffer zone region
sociated attributes).                       generated at 200
                               You can           meters from
                               choose to         selected lines
                               buffer any        (also shown).
                               or all of the
                               element types in a vector
                               object. If you want buffer
                               zones to be separated by the
                               attributes of the buffered elements, only
                               one element type can be selected.

                                                            Buffer poly-
                                                          gons merged
                                                          (left, default)
                                                          or separated
                                                          by attribute
The setback distance can
                                                          (below, right).
be designated separately for
each attribute value. Here,
a buffer distance of 200
meters is specified for
intermittent water features
and 400 meters for
perennial features.

 This buffer zone polygon was
 created by buffering both an
 intermittent stream and the
 shoreline of an intermittent
 water body, so both attributes
 are attached.


                                              page 15
For a more complete treatment of this subject, see Getting Started:
Introduction to GIS             Vector Analysis Operations and Interactive Region Analysis

Region and Vector Combinations
Vector combinations also          Region and vector combinations let you combine
allow you to restrict the         objects mathematically by georeference. Combi-
element set used in the
combination by attribute, by      nation by geographic extent is a very powerful fea-
query, or by direct selection.    ture that allows input with different scales and map
By selecting which polygons       projections, which are resolved on-the-fly to create
to use in a vector                the output object.
combination, you can either
include or exclude islands in     The three major differences between combining vec-
the equation.
                                  tors and combining regions are that region combi-
Many vector combinations          nation is accomplished interactively in the display
are “cookie cutter”
operations, such as the one       process, vector combination preserves attributes
shown, which is not an            from one or both of the input objects (regions do
option in region                  not have attributes), and many more combination
combinations. Regions,            options exist for vector objects.
however, can be used as
cookie cutters on vectors
directly in the display
process.


                                                                      result (all polygons)


   source            operator     geographic overlay
                   Vector Combination
                                                                    result (without islands)
                   Region Combination
10 mile buffer around     100 mile buffer around       region within 10 miles of city
cities with population    cities with population >     < 20,000 and at least 100
< 20,000                  500,000                      miles from city > 500,000


Regions
generated
and com-
bined in Spatial
Data Display
process.


                                             page 16
For a more complete treatment of this subject, see
Getting Started: Sketching and Measuring                            Introduction to GIS

         Making Measurements and Sketches
The ability to get real ground measurements from          Use the ruler tool to mea-
                                                          sure the distance between
any georeferenced or scale calibrated object is an        two points, such as county
important aspect of any GIS system. A variety of          road intersections.
tools for obtaining measurements is
also important.
The most common measurements are
probably from one location to an-
other. TNTmips provides two tools,
the ruler and line tools, so you can
get either an “as the crow flies” or a
complex path measurement. Arc and
                                                          Use the arc or arc wedge
arc wedge tools provide protractor, or angular, mea-      tools to determine the angle
surements. A polygon tool lets you determine the          between linear features.
area and perimeter of irregular shapes.
A number of tools for measuring
around regular shapes (rectangles,
circles, ellipses, regular polygons) are
also provided. A wide variety of units,
which can be changed at any time, is available for
measurement reports. Measurements can also be             Use the polygon tool to
                                                          measure irregular areas.
recorded in a text file.
The TNT products use these same
tools for sketching so that you can
create quick annotated layer inter-
pretations. Since both the sketch-
ing and measuring tools are part of
the GeoToolbox, you can view and
record the size of each sketch element, if desired,
before adding it to a sketch.
                                                     Measured areas can become
                                                     sketch elements (right mouse
                                                     button click) and annotated.


                                          page 17
For a more complete treatment of this subject,
Introduction to GIS                               see Getting Started: Theme Mapping

Making Theme Maps
                              Theme mapping is a powerful means to look at
      theme map by state population with       quantitative trends and classes of
                                 legend        attributes associated with vector and
                                              TIN elements. Theme maps provide a
                                            ready means for visualization of this in-
                                            formation without the need for you to
                                          design the scripts that identify the classes
                                         and assign meaningful styles. Theme map-
                                         ping treats the values in a designated field
                                         statistically and assigns styles to the classes
                                         identified according to the parameters you
                                              specify.
                                            Themes can be created for point, line,
                                          and polygon elements. Themes are main-
                                         tained using style assignment tables and
                                         style objects, just as when drawing style is
                                         assigned by attribute.
The same
color scheme as                                                           a symbol with
above used with a                                                          variable color
variable color bitmap fill                                                     and color
pattern. Using a bit map                                                    spread from
pattern gives a hint of the    Choose between                             cyan to yellow
attribute being mapped and     counting all
also lets you see through to   records, records by
any background imagery.        reference, or by
                               element size (line
                               or polygon themes).


                                                                        the same map
                                           The                               with color
                                           distribution                   spread from
                                           can be                           blue to red
                                           equal count,
                                           equal
                                           interval, or
                                           user-
                                           defined.


                                          page 18
Introduction to GIS

                                  Other Important Features
For meaningful visualization of
geospatial data you should be able
to display and print at specified
map scales and control the visibil-
ity of layers in a layout by the map
scale (layers/elements appear and
disappear as you zoom in and out).
Automatic legends that can be
turned on and off for viewing are
also an important feature. To make
map making easy, a GIS system should include a             Theme map of county
                                                           population density in
variety of standard map components that can be eas-        Nebraska displayed at
ily added to a layout. These include map grids,            1:10000000 with an
scale bars, legends, annotation text, and a means of       automatic legend.
mixing georeferenced and ungeoreferenced groups
(north arrows, company logos) to complete the map.
Printing to a wide variety of printers, including print-
ers not attached to a computer with the GIS soft-
ware, is another important feature.
Once you have data in a GIS system, you need to be
able to correct and update it. You also need a way to
create and edit objects using any kind of data you
already have as a reference. All new objects created
should automatically acquire map registration from
their reference objects so that they can not only be
scaled and displayed with the original reference ob-
                                                           The ability to add map grids,
jects, but with any other georeferenced objects in         scale bars and text, as well
any map projection.                                        as to create legends, should
                                                           be an integral part of the
One very important feature of an advanced GIS sys-         map layout process.
tem is that it continues to evolve and incorporate
new technologies.
This evolution must
maintain backward
compatibility so that
longtime clients don’t
have to start over when
significant changes in
file formats or features                 ...overlaid on recent
                         Vector needing                           ...and updated.
are introduced.          update...       imagery for reference...


                                          page 19
Advanced Software for Geospatial Analysis                                                                                           I
                                                                                                                                         N
                                                                                                                                         T
 MicroImages, Inc. publishes a complete line of professional software for advanced geospatial                                            R
 data visualization, analysis, and publishing. Contact us or visit our web site for detailed product                                     O
 information.
                                                                                                                                         G
                                                                                                                                         I
 TNTmips TNTmips is a professional system for fully integrated GIS, image analysis,                                                      S
   CAD, TIN, desktop cartography, and geospatial database management.
 TNTedit TNTedit provides interactive tools to create, georeference, and edit vector, image,
   CAD, TIN, and relational database project materials in a wide variety of formats.
 TNTview TNTview has the same powerful display features as TNTmips and is perfect for
   those who do not need the technical processing and preparation features of TNTmips.
 TNTatlas TNTatlas lets you publish and distribute your spatial project materials on CD-
   ROM at low cost. TNTatlas CDs can be used on any popular computing platform.
 TNTserver TNTserver lets you publish TNTatlases on the Internet or on your intranet.
   Navigate through geodata atlases with your web browser and the TNTclient Java applet.
 TNTlite    TNTlite is a free version of TNTmips for students and professionals with small
   projects. You can download TNTlite from MicroImages’ web site, or you can order
   TNTlite on CD-ROM with the current set of Getting Started booklets.

                                                               Index
    annotation ............................................... 1 7    multiple line labels .................................. 1 2
    attribute databases ............................. 5, 13           network topology ..................................... 9
    bitmap fill patterns ................................. 1 8        ODBC ....................................................... 1 2
    buffer zone regions ............................ 5, 15            pin mapping ............................................ 1 2
    CAD objects ............................................ 1 0      planar topology ........................................ 9
    Cluster regions ........................................ 1 4      Polygon Fitting regions ......................... 1 4
    computed fields ....................................... 1 3       polygonal topology .................................. 9
    contours (isolines) .................................... 8        raster objects ............................................. 6
    coordinate data objects ............................ 7            region combinations ............................... 1 6
    data types .................................................. 6   sketching ................................................. 1 7
    flood zone regions .................................. 1 4         style by attribute ......................... 5, 13, 18
    GeoToolbox ............................................. 1 7      theme mapping ................................ 18, 19
    interactive GIS .......................................... 5      TIN objects ............................................. 1 1
    legends .......................................... 4, 18, 19      vector buffer zones ................................. 1 5
    map grids ............................................ 4, 19      vector combinations .............................. 1 6
    map layout ......................................... 4, 19        vector editing .......................................... 1 9
    map scale ................................................. 1 9   vector objects ....................................... 8–9
    measuring ................................................. 1 7   vector topology ........................................ 9


                                              MicroImages, Inc.
                                              11th Floor – Sharp Tower
                                              206 South 13th Street
                                              Lincoln, Nebraska 68508-2010 USA

Voice: (402)477-9554                                                           email: info@microimages.com
FAX: (402)477-9559                                                             Internet: www.microimages.com

More Related Content

What's hot

Data Models - GIS I
Data Models - GIS IData Models - GIS I
Data Models - GIS IJohn Reiser
 
Terminology and Basic Questions About GIS
Terminology and Basic Questions About GISTerminology and Basic Questions About GIS
Terminology and Basic Questions About GISMrinmoy Majumder
 
Data collection and input overview
Data collection and input overviewData collection and input overview
Data collection and input overviewsrinivas2036
 
Raster data model
Raster data modelRaster data model
Raster data modelPramoda Raj
 
Data input techniques - GIS
Data input techniques - GISData input techniques - GIS
Data input techniques - GISVignesh LS
 
Geographic Phenomena and their Representations
Geographic Phenomena and their RepresentationsGeographic Phenomena and their Representations
Geographic Phenomena and their RepresentationsNAXA-Developers
 
Raster data model
Raster data modelRaster data model
Raster data modelPramoda Raj
 
GIS and Mapping Software Introduction
GIS and Mapping Software IntroductionGIS and Mapping Software Introduction
GIS and Mapping Software IntroductionMEASURE Evaluation
 
Vector data model
Vector data model Vector data model
Vector data model Pramoda Raj
 
Surface Analysis in GIS
Surface Analysis in GISSurface Analysis in GIS
Surface Analysis in GISRituSaha3
 
Getting started with GIS
Getting started with GISGetting started with GIS
Getting started with GISEsri India
 
Heads up digitization- ON THE FLY- GIS
Heads up digitization- ON THE FLY- GISHeads up digitization- ON THE FLY- GIS
Heads up digitization- ON THE FLY- GISSadia Rahat
 

What's hot (19)

Data Models - GIS I
Data Models - GIS IData Models - GIS I
Data Models - GIS I
 
Geodatabases
GeodatabasesGeodatabases
Geodatabases
 
Terminology and Basic Questions About GIS
Terminology and Basic Questions About GISTerminology and Basic Questions About GIS
Terminology and Basic Questions About GIS
 
Spatial data for GIS
Spatial data for GISSpatial data for GIS
Spatial data for GIS
 
Data sources and input in GIS
Data  sources and input in GISData  sources and input in GIS
Data sources and input in GIS
 
Data collection and input overview
Data collection and input overviewData collection and input overview
Data collection and input overview
 
Gis functions
Gis functionsGis functions
Gis functions
 
Raster data model
Raster data modelRaster data model
Raster data model
 
Data input techniques - GIS
Data input techniques - GISData input techniques - GIS
Data input techniques - GIS
 
Geographic Phenomena and their Representations
Geographic Phenomena and their RepresentationsGeographic Phenomena and their Representations
Geographic Phenomena and their Representations
 
QGIS Tutorial 2
QGIS Tutorial 2QGIS Tutorial 2
QGIS Tutorial 2
 
Raster data model
Raster data modelRaster data model
Raster data model
 
GIS and Mapping Software Introduction
GIS and Mapping Software IntroductionGIS and Mapping Software Introduction
GIS and Mapping Software Introduction
 
Arc gis network analyst tutorial
 Arc gis network analyst tutorial Arc gis network analyst tutorial
Arc gis network analyst tutorial
 
Vector data model
Vector data model Vector data model
Vector data model
 
Surface Analysis in GIS
Surface Analysis in GISSurface Analysis in GIS
Surface Analysis in GIS
 
Getting started with GIS
Getting started with GISGetting started with GIS
Getting started with GIS
 
gis
gisgis
gis
 
Heads up digitization- ON THE FLY- GIS
Heads up digitization- ON THE FLY- GISHeads up digitization- ON THE FLY- GIS
Heads up digitization- ON THE FLY- GIS
 

Similar to Introduction to gis

Components of gis
Components of gisComponents of gis
Components of gisPramoda Raj
 
Towards and adaptable spatial processing architecture
Towards and adaptable spatial processing architectureTowards and adaptable spatial processing architecture
Towards and adaptable spatial processing architectureArmando Guevara
 
QGIS Training.pptx
QGIS Training.pptxQGIS Training.pptx
QGIS Training.pptxSeemaAjay7
 
Assignment vector raster
Assignment vector rasterAssignment vector raster
Assignment vector rasterfredsk2006
 
Manual to basic gis
Manual to basic gisManual to basic gis
Manual to basic gisQust04
 
Introduction To Geographical Information System (GIS)
Introduction To Geographical Information System (GIS) Introduction To Geographical Information System (GIS)
Introduction To Geographical Information System (GIS) Ajay Singh Lodhi
 
Geographic information system (gis)
Geographic information system (gis)Geographic information system (gis)
Geographic information system (gis)Vandana Verma
 
Seminar on gis analysis functions
Seminar on gis analysis functionsSeminar on gis analysis functions
Seminar on gis analysis functionsPramoda Raj
 
1_GEOGRAPHIC INFORMATION SYSTEMSTEM.pptx
1_GEOGRAPHIC INFORMATION SYSTEMSTEM.pptx1_GEOGRAPHIC INFORMATION SYSTEMSTEM.pptx
1_GEOGRAPHIC INFORMATION SYSTEMSTEM.pptxLaleanePale
 
Unit 4 Data Editing.pptx
Unit 4 Data Editing.pptxUnit 4 Data Editing.pptx
Unit 4 Data Editing.pptxe20ag004
 
the title of this course is Entitles as GIS and Remote sensing
the title of this course is Entitles as GIS and Remote sensingthe title of this course is Entitles as GIS and Remote sensing
the title of this course is Entitles as GIS and Remote sensingmulugeta48
 
Map Making with QGIS
Map Making with QGISMap Making with QGIS
Map Making with QGISSagar Arlekar
 

Similar to Introduction to gis (20)

Components of gis
Components of gisComponents of gis
Components of gis
 
Towards and adaptable spatial processing architecture
Towards and adaptable spatial processing architectureTowards and adaptable spatial processing architecture
Towards and adaptable spatial processing architecture
 
Geographic information system
Geographic information systemGeographic information system
Geographic information system
 
QGIS Training.pptx
QGIS Training.pptxQGIS Training.pptx
QGIS Training.pptx
 
Assignment vector raster
Assignment vector rasterAssignment vector raster
Assignment vector raster
 
introduction to GIS
introduction to GIS introduction to GIS
introduction to GIS
 
Geoprocessing
GeoprocessingGeoprocessing
Geoprocessing
 
Overview of gis new
Overview of gis newOverview of gis new
Overview of gis new
 
Manual to basic gis
Manual to basic gisManual to basic gis
Manual to basic gis
 
Introduction To Geographical Information System (GIS)
Introduction To Geographical Information System (GIS) Introduction To Geographical Information System (GIS)
Introduction To Geographical Information System (GIS)
 
Geographic information system (gis)
Geographic information system (gis)Geographic information system (gis)
Geographic information system (gis)
 
Seminar on gis analysis functions
Seminar on gis analysis functionsSeminar on gis analysis functions
Seminar on gis analysis functions
 
1_GEOGRAPHIC INFORMATION SYSTEMSTEM.pptx
1_GEOGRAPHIC INFORMATION SYSTEMSTEM.pptx1_GEOGRAPHIC INFORMATION SYSTEMSTEM.pptx
1_GEOGRAPHIC INFORMATION SYSTEMSTEM.pptx
 
Mar88CADalyst
Mar88CADalystMar88CADalyst
Mar88CADalyst
 
GIS in Nutshell
GIS in NutshellGIS in Nutshell
GIS in Nutshell
 
Mrp Intrim
Mrp IntrimMrp Intrim
Mrp Intrim
 
Raster data and Vector data
Raster data and Vector dataRaster data and Vector data
Raster data and Vector data
 
Unit 4 Data Editing.pptx
Unit 4 Data Editing.pptxUnit 4 Data Editing.pptx
Unit 4 Data Editing.pptx
 
the title of this course is Entitles as GIS and Remote sensing
the title of this course is Entitles as GIS and Remote sensingthe title of this course is Entitles as GIS and Remote sensing
the title of this course is Entitles as GIS and Remote sensing
 
Map Making with QGIS
Map Making with QGISMap Making with QGIS
Map Making with QGIS
 

Recently uploaded

Full Stack Web Development Course for Beginners
Full Stack Web Development Course  for BeginnersFull Stack Web Development Course  for Beginners
Full Stack Web Development Course for BeginnersSabitha Banu
 
भारत-रोम व्यापार.pptx, Indo-Roman Trade,
भारत-रोम व्यापार.pptx, Indo-Roman Trade,भारत-रोम व्यापार.pptx, Indo-Roman Trade,
भारत-रोम व्यापार.pptx, Indo-Roman Trade,Virag Sontakke
 
Types of Journalistic Writing Grade 8.pptx
Types of Journalistic Writing Grade 8.pptxTypes of Journalistic Writing Grade 8.pptx
Types of Journalistic Writing Grade 8.pptxEyham Joco
 
Incoming and Outgoing Shipments in 1 STEP Using Odoo 17
Incoming and Outgoing Shipments in 1 STEP Using Odoo 17Incoming and Outgoing Shipments in 1 STEP Using Odoo 17
Incoming and Outgoing Shipments in 1 STEP Using Odoo 17Celine George
 
Enzyme, Pharmaceutical Aids, Miscellaneous Last Part of Chapter no 5th.pdf
Enzyme, Pharmaceutical Aids, Miscellaneous Last Part of Chapter no 5th.pdfEnzyme, Pharmaceutical Aids, Miscellaneous Last Part of Chapter no 5th.pdf
Enzyme, Pharmaceutical Aids, Miscellaneous Last Part of Chapter no 5th.pdfSumit Tiwari
 
Interactive Powerpoint_How to Master effective communication
Interactive Powerpoint_How to Master effective communicationInteractive Powerpoint_How to Master effective communication
Interactive Powerpoint_How to Master effective communicationnomboosow
 
18-04-UA_REPORT_MEDIALITERAСY_INDEX-DM_23-1-final-eng.pdf
18-04-UA_REPORT_MEDIALITERAСY_INDEX-DM_23-1-final-eng.pdf18-04-UA_REPORT_MEDIALITERAСY_INDEX-DM_23-1-final-eng.pdf
18-04-UA_REPORT_MEDIALITERAСY_INDEX-DM_23-1-final-eng.pdfssuser54595a
 
internship ppt on smartinternz platform as salesforce developer
internship ppt on smartinternz platform as salesforce developerinternship ppt on smartinternz platform as salesforce developer
internship ppt on smartinternz platform as salesforce developerunnathinaik
 
Introduction to ArtificiaI Intelligence in Higher Education
Introduction to ArtificiaI Intelligence in Higher EducationIntroduction to ArtificiaI Intelligence in Higher Education
Introduction to ArtificiaI Intelligence in Higher Educationpboyjonauth
 
Meghan Sutherland In Media Res Media Component
Meghan Sutherland In Media Res Media ComponentMeghan Sutherland In Media Res Media Component
Meghan Sutherland In Media Res Media ComponentInMediaRes1
 
Pharmacognosy Flower 3. Compositae 2023.pdf
Pharmacognosy Flower 3. Compositae 2023.pdfPharmacognosy Flower 3. Compositae 2023.pdf
Pharmacognosy Flower 3. Compositae 2023.pdfMahmoud M. Sallam
 
Earth Day Presentation wow hello nice great
Earth Day Presentation wow hello nice greatEarth Day Presentation wow hello nice great
Earth Day Presentation wow hello nice greatYousafMalik24
 
Roles & Responsibilities in Pharmacovigilance
Roles & Responsibilities in PharmacovigilanceRoles & Responsibilities in Pharmacovigilance
Roles & Responsibilities in PharmacovigilanceSamikshaHamane
 
Alper Gobel In Media Res Media Component
Alper Gobel In Media Res Media ComponentAlper Gobel In Media Res Media Component
Alper Gobel In Media Res Media ComponentInMediaRes1
 
Proudly South Africa powerpoint Thorisha.pptx
Proudly South Africa powerpoint Thorisha.pptxProudly South Africa powerpoint Thorisha.pptx
Proudly South Africa powerpoint Thorisha.pptxthorishapillay1
 
Framing an Appropriate Research Question 6b9b26d93da94caf993c038d9efcdedb.pdf
Framing an Appropriate Research Question 6b9b26d93da94caf993c038d9efcdedb.pdfFraming an Appropriate Research Question 6b9b26d93da94caf993c038d9efcdedb.pdf
Framing an Appropriate Research Question 6b9b26d93da94caf993c038d9efcdedb.pdfUjwalaBharambe
 
CARE OF CHILD IN INCUBATOR..........pptx
CARE OF CHILD IN INCUBATOR..........pptxCARE OF CHILD IN INCUBATOR..........pptx
CARE OF CHILD IN INCUBATOR..........pptxGaneshChakor2
 

Recently uploaded (20)

Full Stack Web Development Course for Beginners
Full Stack Web Development Course  for BeginnersFull Stack Web Development Course  for Beginners
Full Stack Web Development Course for Beginners
 
भारत-रोम व्यापार.pptx, Indo-Roman Trade,
भारत-रोम व्यापार.pptx, Indo-Roman Trade,भारत-रोम व्यापार.pptx, Indo-Roman Trade,
भारत-रोम व्यापार.pptx, Indo-Roman Trade,
 
Types of Journalistic Writing Grade 8.pptx
Types of Journalistic Writing Grade 8.pptxTypes of Journalistic Writing Grade 8.pptx
Types of Journalistic Writing Grade 8.pptx
 
Incoming and Outgoing Shipments in 1 STEP Using Odoo 17
Incoming and Outgoing Shipments in 1 STEP Using Odoo 17Incoming and Outgoing Shipments in 1 STEP Using Odoo 17
Incoming and Outgoing Shipments in 1 STEP Using Odoo 17
 
Enzyme, Pharmaceutical Aids, Miscellaneous Last Part of Chapter no 5th.pdf
Enzyme, Pharmaceutical Aids, Miscellaneous Last Part of Chapter no 5th.pdfEnzyme, Pharmaceutical Aids, Miscellaneous Last Part of Chapter no 5th.pdf
Enzyme, Pharmaceutical Aids, Miscellaneous Last Part of Chapter no 5th.pdf
 
9953330565 Low Rate Call Girls In Rohini Delhi NCR
9953330565 Low Rate Call Girls In Rohini  Delhi NCR9953330565 Low Rate Call Girls In Rohini  Delhi NCR
9953330565 Low Rate Call Girls In Rohini Delhi NCR
 
Interactive Powerpoint_How to Master effective communication
Interactive Powerpoint_How to Master effective communicationInteractive Powerpoint_How to Master effective communication
Interactive Powerpoint_How to Master effective communication
 
18-04-UA_REPORT_MEDIALITERAСY_INDEX-DM_23-1-final-eng.pdf
18-04-UA_REPORT_MEDIALITERAСY_INDEX-DM_23-1-final-eng.pdf18-04-UA_REPORT_MEDIALITERAСY_INDEX-DM_23-1-final-eng.pdf
18-04-UA_REPORT_MEDIALITERAСY_INDEX-DM_23-1-final-eng.pdf
 
internship ppt on smartinternz platform as salesforce developer
internship ppt on smartinternz platform as salesforce developerinternship ppt on smartinternz platform as salesforce developer
internship ppt on smartinternz platform as salesforce developer
 
Introduction to ArtificiaI Intelligence in Higher Education
Introduction to ArtificiaI Intelligence in Higher EducationIntroduction to ArtificiaI Intelligence in Higher Education
Introduction to ArtificiaI Intelligence in Higher Education
 
OS-operating systems- ch04 (Threads) ...
OS-operating systems- ch04 (Threads) ...OS-operating systems- ch04 (Threads) ...
OS-operating systems- ch04 (Threads) ...
 
Meghan Sutherland In Media Res Media Component
Meghan Sutherland In Media Res Media ComponentMeghan Sutherland In Media Res Media Component
Meghan Sutherland In Media Res Media Component
 
Pharmacognosy Flower 3. Compositae 2023.pdf
Pharmacognosy Flower 3. Compositae 2023.pdfPharmacognosy Flower 3. Compositae 2023.pdf
Pharmacognosy Flower 3. Compositae 2023.pdf
 
Model Call Girl in Tilak Nagar Delhi reach out to us at 🔝9953056974🔝
Model Call Girl in Tilak Nagar Delhi reach out to us at 🔝9953056974🔝Model Call Girl in Tilak Nagar Delhi reach out to us at 🔝9953056974🔝
Model Call Girl in Tilak Nagar Delhi reach out to us at 🔝9953056974🔝
 
Earth Day Presentation wow hello nice great
Earth Day Presentation wow hello nice greatEarth Day Presentation wow hello nice great
Earth Day Presentation wow hello nice great
 
Roles & Responsibilities in Pharmacovigilance
Roles & Responsibilities in PharmacovigilanceRoles & Responsibilities in Pharmacovigilance
Roles & Responsibilities in Pharmacovigilance
 
Alper Gobel In Media Res Media Component
Alper Gobel In Media Res Media ComponentAlper Gobel In Media Res Media Component
Alper Gobel In Media Res Media Component
 
Proudly South Africa powerpoint Thorisha.pptx
Proudly South Africa powerpoint Thorisha.pptxProudly South Africa powerpoint Thorisha.pptx
Proudly South Africa powerpoint Thorisha.pptx
 
Framing an Appropriate Research Question 6b9b26d93da94caf993c038d9efcdedb.pdf
Framing an Appropriate Research Question 6b9b26d93da94caf993c038d9efcdedb.pdfFraming an Appropriate Research Question 6b9b26d93da94caf993c038d9efcdedb.pdf
Framing an Appropriate Research Question 6b9b26d93da94caf993c038d9efcdedb.pdf
 
CARE OF CHILD IN INCUBATOR..........pptx
CARE OF CHILD IN INCUBATOR..........pptxCARE OF CHILD IN INCUBATOR..........pptx
CARE OF CHILD IN INCUBATOR..........pptx
 

Introduction to gis

  • 1. I N T Introduction to Introduction to GIS R O G GIS I S with TNTmips® page 1 TNTedit™ and TNTview®
  • 2. Introduction to GIS Before Getting Started TNTmips®, TNTview®, and TNTedit™ all offer a wide variety of tools for those working in the many fields that make use of Geographic Information Systems (GIS). The purpose of this booklet is to acquaint you with the concepts and tools required for the management and analysis of spatial data, which is the primary focus of GIS. All of the features required for a robust GIS system are available in TNTmips, which is used to demonstrate some of the tools and con- cepts described throughout this book. Prerequisite Skills This booklet assumes you have completed the exercises in Displaying Geospatial Data and Navigating tutorial booklets. Those exercises introduce essential skills and basic techniques that are not covered again here. Please consult these booklets for any review you need. Sample Data This booklet does not use exercises with specific sample data to develop the topics presented in this booklet. You can, however, use the sample data distributed with the TNT products to explore the ideas discussed on these pages. If you do not have access to a TNT products CD, you can download the data from MicroImages’ web site. Make a read-write copy on your hard drive of data sets you want to use so changes can be saved. More Documentation This booklet is intended only as an introduction to the GIS functions in TNTmips, TNTedit, and TNTview. Consult the TNTmips ref- erence manual and booklets in the Getting Started series for more information. TNTmips and TNTlite® TNTmips comes in two versions: the professional ver- sion and the free TNTlite version. This booklet refers to both versions as “TNT- mips.” If you did not purchase the professional version (which requires a soft- ware license key), TNTmips operates in TNTlite mode, which limits the size of your project materials and enables data sharing only with other copies of TNT- lite. All of the GIS processes described in this booklet can be performed in TNTlite. Merri P. Skrdla, Ph.D., 6 May 2005 ©MicroImages, Inc. 2000–2005 It may be difficult to identify the important points in some illustrations without a color copy of this booklet. You can print or read this booklet in color from MicroImages’ web site. The web site is also your source of the newest Getting Started booklets on other topics. You can download an installation guide, sample data, and the latest version of TNTlite. http://www.microimages.com page 2
  • 3. Introduction to GIS An Introduction to GIS Geographic Information Systems (GIS) is an evolv- ing, catchall phrase that initially referred to man- agement of information with a geographic compo- nent primarily stored in vector form with associated attributes. This definition quickly became too re- strictive with advances in software and ideas about information management. An advanced GIS sys- tem should be able to handle any spatial data, not just data tied to the ground by geographic reference points. The capacity to handle non-geographic spa- tial data was formerly the domain of systems referred to as AM/FM (Automated Mapping and Facilities Management). Other non-geographic applications, such as interactive medical encyclopedias that re- trieve information based on the human form, should also be manageable by a robust system. Integration of imagery with vector data is now a necessity for a full-featured GIS system. Imagery was once thought to be the exclusive domain of image processing systems, but is now often required as a backdrop for vector, or other data, types. No up-to-date GIS system is complete without sur- face modeling and 3D (technically 2 1/2 D) visual- Pages 4–5 introduce the ization with “fly-by” capability. In addition to draw- potential of GIS systems. The different object types ing a path for the simulation, you should be able to used in managing spatial orbit with the view directed at a specified point or data are described on pages have the view pan around a stationary viewer. Vec- 6–13. Subsequent pages tor overlay on this 3D surface should also be an discuss other processes used in GIS systems, such integral part of the package. as region and vector A GIS system should be production oriented, which combinations, and additional features for the already may or may not mean product oriented. Production described object types, such work in GIS involves making maps (a product), but as theme mapping and it also involves interactive analysis (a result which legends. may have no tangible product). This booklet starts by looking at these two aspects of GIS systems and then describes the facets of GIS systems needed to reach the integrated goals. page 3
  • 4. For a more complete treatment of this subject, see Introduction to GIS Getting Started: Making Map Layouts Making Maps and Posters GIS map making should transcend traditional car- tography—roads, streams, and political boundaries A map along with map grids, scale bars, and legends may is... be sufficient for some maps but are not an adequate reflection of a fully featured GIS system. You should be able to incorporate a satellite or airphoto image as the background for line and polygon data with transparent polygon filling to reveal the background through vector or CAD overlays. You should be able to incorporate enlarged insets and elements that ...built tie the components at both map scales together. from... To make map making easy, a GIS system should include a variety of standard map components that can be readily added to a layout. These include map grids, scale bars, legends, annotation text, and a means of mixing georeferenced and ungeoreferenced groups (north arrows, company ...many logos) to complete the map. Each of these map com- pieces. ponents should be easily customizable; for example, with map grids you should be able to control the size and color of the text and lines, the grid spacing, the components of the grid, and so on. Maps can take a variety of forms. page 4
  • 5. For a more complete treatment of this subject, see Getting Started: Interactive Region Analysis Introduction to GIS Interactive GIS Another important aspect of a GIS system is the as- sociation of attributes with elements and the ability to select elements and view their attributes and to use attri- use attributes to select elements. You should also butes to be able to quickly identify elements that have no assign attributes attached and elements with multiple at- style tribute records attached. Attributes should be dynamic so that new values can be calculated on-the-fly from values in other fields or other tables. Such computed fields are then updated whenever the fields used select polygons; in their calculation are updated. If values view attributes for a computed field will not change once calculated, there should be a means to make values permanent. Attributes should also be useful for theme mapping and be avail- able for direct display (pin mapping) pro- vided each record includes spatial coordi- nates. Generate buffer zones around selected polygons. select attributes; view polygons Buffer zones used to extract rivers within 500 m (in red) of the selected soil types. Attributes for one of the extracted lines (magenta) are shown. page 5
  • 6. Introduction to GIS Raster Objects A raster is a two-dimensional array of numbers that 8-bit composite color results in a screen image. Each array position de- raster object (unsigned) cell values fined by a line and col- umn number is called a “cell.” Cell values can be of many types ranging from 1-bit (binary) to 128-bit (complex num- bers). In between these extremes are signed and color map unsigned integer data Multiple raster components from 8- to 32-bit, 16- to 64-bit floating point, and used to produce a color- 16- and 24-bit composite color rasters. Your GIS infrared image (photo- system should display all these data types regard- infrared as the red display less of your display’s pixel depth, and color images component, red as green, and green as blue). should be generated from composite color rasters Contrast was applied to (8-, 16-, and 24-bit), color map application (8- and each component before the 16-bit), and multiple component raster display. color image was derived. Raster values are often modified or interpreted from the original values by application of contrast tables, color maps, or both before producing a screen image. The ability to alter display characteristics without altering original data values is essential for meaningful image pro- cessing and analysis. The speed of display for large rasters and the size of raster supported are often as impor- tant as the variety of the data types allowed. TNT * A terabyte is 1000 professional products support all the data types de- gigabytes. scribed in raster objects as large as four terabytes*. Cell values can represent Sampled display of the full image of such a large either continuous or raster can be achieved in just a few seconds in the categorical data. The TNT products. continuous red, green, and blue bands (left) of an airphoto can produce a color image (center) or be or automatically classified to create a categorical raster (right). page 6
  • 7. Introduction to GIS Coordinate Data Objects Coordinate data objects use XY or XYZ coordinates to describe the elements in an object. Coordinate Vector data objects include vector, CAD (Computer Aided CAD Design), and TIN (Triangulated Irregular Network) formats. These coordinates may directly represent TIN geographic position (decimal degrees or UTM in meters, for example) or may be derived from screen, raster, digitizer, or other arbitrary coordinates. Coordinate data objects are made up of specific element types commensurate with the data for- mat. Each of these element types can also have associated attributes stored in database form. Each of these coordinate data types is best suited to par- ticular applications. Vector data is necessary for applications that require ground area to be in- cluded in one polygon only, such as land owner- ship maps. CAD objects are best suited for archi- tectural drawings and other applications requir- ing geometric shapes or repetition of groups of elements (blocks). TIN objects are best suited for compact representation of 3D surfaces. Ad- This vector contains 1504 nodes ditional features of these data types will be de- (not drawn), 2237 lines (all same in black), and 777 polygons scribed in the next few pages. (filled solidly or with bitmap or hatch patterns). All coordinate data objects in TNTmips can have more than 2 x 10⁹ elements. Vector lines can have this many vertices in a single line—in essence element complexity and object size are unlimited. This CAD drawing is made This TIN contains 3725 nodes, up of 43 blocks with 1–92 11144 edges, and 7420 triangles. elements in each. page 7
  • 8. Introduction to GIS Vector Objects contours (isolines) Vector objects may include nodes, points, lines, polygons, and labels. Strict topological vec- tors are an absolute must for a GIS system. Strict, or polygonal, topology requires that no two nodes have the same X and Y coor- dinates, all lines start and end in nodes, lines do not intersect other lines or themselves (nodes are inserted where lines would oth- erwise cross), enclosed areas are defined as polygons, and any point can be in at most roads, hydrology, and one polygon. When these stringent requirements point features are met, other vector topologies can be considered in a rural area. to reduce overhead requirements as discussed on the following page. Another requirement of a GIS system is association of attributes with vector elements. Maintaining these attributes in relational databases associated with the vector elements simplifies attribute man- agement. Once you have associated attributes, you need to be able to assign drawing styles to reflect soil type polygons the attributes. Ideally you can choose from a selec- tion of symbols for points, patterns for lines, and bitmap and hatch patterns for polygon filling, and design your own if you don’t find the style you want. You should also be able to create permanent labels or generate them on-the-fly. The number and complexity of elements that can be included in a vector object may also be an issue. For example, ARC/INFO Coverage limits the num- ber of vertices in a line to 500, which is many fewer vertices than in some of the contour lines in the ob- ject illustrated on this page. TIGER data in urban (left) and rural areas. page 8
  • 9. Introduction to GIS Topology Types Polygonal topology, which is described on the pre- vious page, is necessary if you want ground mea- surements, but it takes time and rigor to maintain. Other topology types, such as planar and network topology, require fewer system resources to main- tain and are adequate or even better suited for appli- cations not requiring ground area measurements. Planar topology requires that all lines start and end in nodes and no two lines cross, as with polygonal Polygonal objects, however, polygon information is not main- Topology tained. Planar and polygonal vectors appear the same except polygon filling is not available for pla- nar vectors because there are no polygons. Planar topology may be appropriate for hydrology if no lakes are present or for road systems that lack over- passes, underpasses, and other features that require network topology for correct representation. Polygonal and planar topology can be either 2D or 3D, but topology is maintained in the X-Y plane for 3D objects of these topology types, which means that nodes separating lines that would otherwise Planar cross are determined by projection onto the X-Y Topology plane. Such lines may not actually intersect in three dimensions and would be better represented using network topology. Network topology places nodes at the start and end 2D of all lines, but lines may cross themselves or other view lines. As with planar topology, there are no poly- gons. Note the absence of nodes where lines cross in the grid at the right. Although nodes need not Network occur where lines cross, they can be present at any Topology intersection and are necessary for use in network analysis (routing and allocation). The constraints imposed by 2D topology on 3D objects are elimi- nated by choosing network topology, which allows two nodes to have the same X and Y coordinates. Lines that appear to cross in a planimetric view may be separated in 3D by their Z values (lower right). 3D view, same object page 9
  • 10. Introduction to GIS CAD Objects X1 CAD objects have free-form topology; they are text element made up of elements that retain their own shape re- gardless of the relative position or changes to other elements. The elements in a CAD object may over- X4 lap one another and have a defined drawing order, block insertion which may be changed, that determines which ele- made from ments appear to be on top. CAD elements include triangular polygons points, lines, polygons, text, and a variety of geo- metric shapes. The geometric shapes are defined by center points, radii, and angles. These character- X4 istics are maintained after elements are added, re- block insertion gardless of the other elements in the object, and made from triangular can be modified in later editing sessions. Unlike a polygons vector polygon created with the circle tool, a CAD circle can be resized by changing its radius or moved by changing the location of its center point. X5 CAD elements include points, lines, polygons, regu- three filled circles and lar polygons, boxes, circles, arcs, arc chords, arc two outlines wedges, ellipses, and text. Individual CAD elements can be organized into blocks that are inserted at one or many positions within a single drawing or used throughout a series of drawings. The short and long direction points in the North arrow at the left are each blocks made up of polygons. Polygons and other closed shapes can be filled with solid color or = a fill pattern. The outline can be omitted, be a solid color, or be a line pattern. Other examples of CAD objects shown below elements displayed using include structural drawings and additional North attributes to assign style arrows. All North arrows shown (and more) are supplied with TNTmips. page 10
  • 11. Introduction to GIS TIN Objects TINs (Triangulated Irregular Networks) are com- posed of nodes, edges, and triangles. The nodes are irregularly spaced three-dimensional points, con- nected by edges to represent a surface as a set of adjacent, conterminous triangles constructed so that every triangle satisfies the Delaunay criterion. Delaunay triangulation requires that triangles con- structed from a randomly dispersed set of points are as small and equilateral as possible. Choosing points for a triangle is an arbitrary process; results are unique; from a set of points there is only one set of triangles that meet the Delaunay criterion. When standard attributes TINs are one of three formats commonly used to are generated for a TIN represent functional surfaces, such as the Earth’s object, slope and aspect are calculated for each triangle surface. [The other two are Digital Elevation Mod- (in addition to area, els (DEMs) and contour maps.] The TIN data struc- perimeter, and center ture minimizes the number of points needed to ac- coordinates). These curately represent surface variations. attributes can be used to determine fill colors for the TINs can be represented directly as contours, either triangles that convey a good deal about the topography alone or in combination with nodes, edges, and / or even in a 2D view (below). triangles. The standard attributes calculated for TIN objects include slope and aspect, which can be used to shade the triangles so these attributes are readily conveyed even in 2D representations. A TIN object shown in 3D perspective view with overlaid contours generated on-the-fly (above) and the contours alone (below). The 2D view of the same TIN (right) shows the triangles filled with a color assigned by a script that uses the slope and aspect of the triangles to determine the color. page 11
  • 12. For a more complete treatment of this subject, see Introduction to GIS Getting Started: Pin Mapping Making Pin Maps Pin mapping should provide A pin map directly visualizes database information a means to distinguish if each record has coordinates for the location of multiple pins with the same coordinates, such as the the observation or report. You could plot telemetry pins shown below for the data for a variety of animals, the location of cities, same sites in three different or the position of trucks on the road. Direct display years. Symbol scale can from database offers some advantages over vector also vary with field values. format for point data. New points are added simply by adding records to the database and the location of points can be updated by changing coordinates. In TNTmips databases used for pinmap display can be in internal format, linked to a supported format (such as dBASE IV, INFO, or FoxPro), or com- municated with using ODBC (Open Database Connectivity to Oracle, for example). With direct linking or ODBC, the database can be maintained by external software and viewed with all updates available the next time you redraw the pinmap. You can display all locations in the same style or use other attributes to determine how a “pin” is dis- You should also be able to played. For example, you can use production to include values for multiple fields from the same record. determine the size of symbols for oil wells or, in the The TNT products let you case of telemetry data, you can represent observa- choose between bar graphs tions for different animals with different symbols. or pie charts with the option You can even incorporate multiple attributes into a of including multiple line labels. pie chart or bar graph. The same records shown as a bar graph (left) and a pie chart (right) with different back- ground layers. The bar graph includes labels for each of the fields graphed. page 12
  • 13. For a more complete treatment of this subject, see Getting Started: Managing Geoattributes Introduction to GIS Attribute Databases Attribute databases keep track of information asso- ciated with coordinate data elements, such as a polygon’s soil class, the road type of a line, or the identity of a point. These kinds of attributes are generally primary keys, which can be used for styling by attribute. Other attributes, such as population of a city or crop yield of a polygon, can be used for theme map- ping or styling by query. You should be able to calculate new information from values in existing fields, such as population density from popula- tion and area fields or the percent- age of the population in the four larg- est cities as shown at the right. String fields can also be concatenated if de- sired. Attribute databases can also be associated with raster ob- jects by cell value, which may be useful for rasters created by interpretive processes, such as Feature Mapping and Automatic Classification. You can select elements and view their All of these associated attributes or choose attributes fields are “computed,” and highlight the elements that have which means them. You can query the database to they are select elements with particular attribute derived from values. values in other tables. This query selects all state polygons with population greater than 3 million in 1990. The number of polygons selected (reported at bottom of query window) is much larger than the number of states because most coastal states have islands offshore. page 13
  • 14. For a more complete treatment of this subject, see Introduction to GIS Getting Started: Interactive Region Analysis Using Regions Use the line Regions are areas of interest drawing tool or used primarily for selection— a selected line to evaluate a selection for viewing at- potential dam tributes, for extracting, or for site. other processing. In some cases, such as flood zone or watershed regions, the region itself is the desired product. Regions can be interac- tively and iteratively cre- The region can delimit either ated. You choose the cells the potential lake area be- or elements of interest, hind a dam of specified height (above) or the area then the desired region cre- that would flood if the dam ation process, adjust region broke (right). parameters, generate a region, alter parameters as necessary and generate another region until you are satisfied with the results and choose to keep that region. Regions can be temporary, available only for the cur- rent display session, or you can choose to save a region to be used at a later time or Hold the left or in other processes. right mouse button to get Region generation methods available in DataTips. TNTmips and not mentioned elsewhere on this page include selected polygons, buffer zones, viewshed, Voronoi regions, raster texture growth, and cell values. Internal.ElemNum <= 54 or Internal.ElemNum >= 144 K Means cluster regions with all (left) or query selected points (middle) and the region formed by Polygon Fitting (Tessellation, right) with the same query selected elements. page 14
  • 15. Introduction to GIS Generating Buffer Zones Generation of buffer zones can be much more sophisticated than the simplistic one buffer distance for selected ele- ments available for regions. You can Hydrology with lines classified elect to buffer all lines or lines selected as intermittent from the screen or by attribute, as is the (thin) or case when creating buffer zone regions. perennial (wide) Additionally, when making vector streams or shorelines. buffer zones, you can assign different buffer distances by attribute values and choose whether to maintain separate buffer zones by attribute or merge buffer zones that intersect. The attributes of elements buffered can also be transferred to the resulting buffer zone vec- tor polygons (regions do not have as- Buffer zone region sociated attributes). generated at 200 You can meters from choose to selected lines buffer any (also shown). or all of the element types in a vector object. If you want buffer zones to be separated by the attributes of the buffered elements, only one element type can be selected. Buffer poly- gons merged (left, default) or separated by attribute The setback distance can (below, right). be designated separately for each attribute value. Here, a buffer distance of 200 meters is specified for intermittent water features and 400 meters for perennial features. This buffer zone polygon was created by buffering both an intermittent stream and the shoreline of an intermittent water body, so both attributes are attached. page 15
  • 16. For a more complete treatment of this subject, see Getting Started: Introduction to GIS Vector Analysis Operations and Interactive Region Analysis Region and Vector Combinations Vector combinations also Region and vector combinations let you combine allow you to restrict the objects mathematically by georeference. Combi- element set used in the combination by attribute, by nation by geographic extent is a very powerful fea- query, or by direct selection. ture that allows input with different scales and map By selecting which polygons projections, which are resolved on-the-fly to create to use in a vector the output object. combination, you can either include or exclude islands in The three major differences between combining vec- the equation. tors and combining regions are that region combi- Many vector combinations nation is accomplished interactively in the display are “cookie cutter” operations, such as the one process, vector combination preserves attributes shown, which is not an from one or both of the input objects (regions do option in region not have attributes), and many more combination combinations. Regions, options exist for vector objects. however, can be used as cookie cutters on vectors directly in the display process. result (all polygons) source operator geographic overlay Vector Combination result (without islands) Region Combination 10 mile buffer around 100 mile buffer around region within 10 miles of city cities with population cities with population > < 20,000 and at least 100 < 20,000 500,000 miles from city > 500,000 Regions generated and com- bined in Spatial Data Display process. page 16
  • 17. For a more complete treatment of this subject, see Getting Started: Sketching and Measuring Introduction to GIS Making Measurements and Sketches The ability to get real ground measurements from Use the ruler tool to mea- sure the distance between any georeferenced or scale calibrated object is an two points, such as county important aspect of any GIS system. A variety of road intersections. tools for obtaining measurements is also important. The most common measurements are probably from one location to an- other. TNTmips provides two tools, the ruler and line tools, so you can get either an “as the crow flies” or a complex path measurement. Arc and Use the arc or arc wedge arc wedge tools provide protractor, or angular, mea- tools to determine the angle surements. A polygon tool lets you determine the between linear features. area and perimeter of irregular shapes. A number of tools for measuring around regular shapes (rectangles, circles, ellipses, regular polygons) are also provided. A wide variety of units, which can be changed at any time, is available for measurement reports. Measurements can also be Use the polygon tool to measure irregular areas. recorded in a text file. The TNT products use these same tools for sketching so that you can create quick annotated layer inter- pretations. Since both the sketch- ing and measuring tools are part of the GeoToolbox, you can view and record the size of each sketch element, if desired, before adding it to a sketch. Measured areas can become sketch elements (right mouse button click) and annotated. page 17
  • 18. For a more complete treatment of this subject, Introduction to GIS see Getting Started: Theme Mapping Making Theme Maps Theme mapping is a powerful means to look at theme map by state population with quantitative trends and classes of legend attributes associated with vector and TIN elements. Theme maps provide a ready means for visualization of this in- formation without the need for you to design the scripts that identify the classes and assign meaningful styles. Theme map- ping treats the values in a designated field statistically and assigns styles to the classes identified according to the parameters you specify. Themes can be created for point, line, and polygon elements. Themes are main- tained using style assignment tables and style objects, just as when drawing style is assigned by attribute. The same color scheme as a symbol with above used with a variable color variable color bitmap fill and color pattern. Using a bit map spread from pattern gives a hint of the Choose between cyan to yellow attribute being mapped and counting all also lets you see through to records, records by any background imagery. reference, or by element size (line or polygon themes). the same map The with color distribution spread from can be blue to red equal count, equal interval, or user- defined. page 18
  • 19. Introduction to GIS Other Important Features For meaningful visualization of geospatial data you should be able to display and print at specified map scales and control the visibil- ity of layers in a layout by the map scale (layers/elements appear and disappear as you zoom in and out). Automatic legends that can be turned on and off for viewing are also an important feature. To make map making easy, a GIS system should include a Theme map of county population density in variety of standard map components that can be eas- Nebraska displayed at ily added to a layout. These include map grids, 1:10000000 with an scale bars, legends, annotation text, and a means of automatic legend. mixing georeferenced and ungeoreferenced groups (north arrows, company logos) to complete the map. Printing to a wide variety of printers, including print- ers not attached to a computer with the GIS soft- ware, is another important feature. Once you have data in a GIS system, you need to be able to correct and update it. You also need a way to create and edit objects using any kind of data you already have as a reference. All new objects created should automatically acquire map registration from their reference objects so that they can not only be scaled and displayed with the original reference ob- The ability to add map grids, jects, but with any other georeferenced objects in scale bars and text, as well any map projection. as to create legends, should be an integral part of the One very important feature of an advanced GIS sys- map layout process. tem is that it continues to evolve and incorporate new technologies. This evolution must maintain backward compatibility so that longtime clients don’t have to start over when significant changes in file formats or features ...overlaid on recent Vector needing ...and updated. are introduced. update... imagery for reference... page 19
  • 20. Advanced Software for Geospatial Analysis I N T MicroImages, Inc. publishes a complete line of professional software for advanced geospatial R data visualization, analysis, and publishing. Contact us or visit our web site for detailed product O information. G I TNTmips TNTmips is a professional system for fully integrated GIS, image analysis, S CAD, TIN, desktop cartography, and geospatial database management. TNTedit TNTedit provides interactive tools to create, georeference, and edit vector, image, CAD, TIN, and relational database project materials in a wide variety of formats. TNTview TNTview has the same powerful display features as TNTmips and is perfect for those who do not need the technical processing and preparation features of TNTmips. TNTatlas TNTatlas lets you publish and distribute your spatial project materials on CD- ROM at low cost. TNTatlas CDs can be used on any popular computing platform. TNTserver TNTserver lets you publish TNTatlases on the Internet or on your intranet. Navigate through geodata atlases with your web browser and the TNTclient Java applet. TNTlite TNTlite is a free version of TNTmips for students and professionals with small projects. You can download TNTlite from MicroImages’ web site, or you can order TNTlite on CD-ROM with the current set of Getting Started booklets. Index annotation ............................................... 1 7 multiple line labels .................................. 1 2 attribute databases ............................. 5, 13 network topology ..................................... 9 bitmap fill patterns ................................. 1 8 ODBC ....................................................... 1 2 buffer zone regions ............................ 5, 15 pin mapping ............................................ 1 2 CAD objects ............................................ 1 0 planar topology ........................................ 9 Cluster regions ........................................ 1 4 Polygon Fitting regions ......................... 1 4 computed fields ....................................... 1 3 polygonal topology .................................. 9 contours (isolines) .................................... 8 raster objects ............................................. 6 coordinate data objects ............................ 7 region combinations ............................... 1 6 data types .................................................. 6 sketching ................................................. 1 7 flood zone regions .................................. 1 4 style by attribute ......................... 5, 13, 18 GeoToolbox ............................................. 1 7 theme mapping ................................ 18, 19 interactive GIS .......................................... 5 TIN objects ............................................. 1 1 legends .......................................... 4, 18, 19 vector buffer zones ................................. 1 5 map grids ............................................ 4, 19 vector combinations .............................. 1 6 map layout ......................................... 4, 19 vector editing .......................................... 1 9 map scale ................................................. 1 9 vector objects ....................................... 8–9 measuring ................................................. 1 7 vector topology ........................................ 9 MicroImages, Inc. 11th Floor – Sharp Tower 206 South 13th Street Lincoln, Nebraska 68508-2010 USA Voice: (402)477-9554 email: info@microimages.com FAX: (402)477-9559 Internet: www.microimages.com