Downloaded 10 times


![Equation (1.11) is called a finite-difference approximation of the derivative at time ti .
It can be substituted into Eq. (1.8) to give
v(ti+1) − v(ti )
ti+1 − ti
= g −
cd
m
v(ti )2
This equation can then be rearranged to yield
v(ti+1) = v(ti ) +
g −
cd
m
v(ti )2
(ti+1 − ti ) (1.12)
Notice that the term in brackets is the right-hand side of the differential equation itself
[Eq. (1.8)]. That is, it provides a means to compute the rate of change or slope of v. Thus,
the equation can be rewritten more concisely as
vi+1 = vi +
dvi
dt
t (1.13)
where the nomenclature vi designates velocity at time ti and t = ti+1 − ti .
We can now see that the differential equation has been transformed into an equation that
can be used to determine the velocity algebraically at ti+1 using the slope and previous val-
ues of v and t. If you are given an initial value for velocity at some time ti, you can easily com-
pute velocity at a later time ti+1. This new value of velocity at ti+1 can in turn be employed to
extend the computation to velocity at ti+2 and so on. Thus at any time along the way,
New value = old value + slope × step size
This approach is formally called Euler’s method. We’ll discuss it in more detail when we
turn to differential equations later in this book.
EXAMPLE 1.2 Numerical Solution to the Bungee Jumper Problem
Problem Statement. Perform the same computation as in Example 1.1 but use Eq. (1.12)
to compute velocity with Euler’s method. Employ a step size of 2 s for the calculation.
Solution. At the start of the computation (t0 = 0), the velocity of the jumper is zero.
Using this information and the parameter values from Example 1.1, Eq. (1.12) can be used
to compute velocity at t1 = 2 s:
v = 0 +
9.81 −
0.25
68.1
(0)2
× 2 = 19.62 m/s
For the next interval (from t = 2 to 4 s), the computation is repeated, with the result
v = 19.62 +
9.81 −
0.25
68.1
(19.62)2
× 2 = 36.4137 m/s
10 MATHEMATICAL MODELING, NUMERICAL METHODS, AND PROBLEM SOLVING](https://image.slidesharecdn.com/appliednumericalmethodswithmatlabforengineersandscientiststhirdedition-230804185537-e8e53c83/85/Applied-Numerical-Methods-With-MATLAB-For-Engineers-And-Scientists-Third-Edition-30-320.jpg)

![As in Example 1.2, a computational price must be paid for a more accurate numerical
result. Each halving of the step size to attain more accuracy leads to a doubling of the num-
ber of computations. Thus, we see that there is a trade-off between accuracy and computa-
tional effort. Such trade-offs figure prominently in numerical methods and constitute an
important theme of this book.
1.2 CONSERVATION LAWS IN ENGINEERING AND SCIENCE
Aside from Newton’s second law, there are other major organizing principles in science
and engineering. Among the most important of these are the conservation laws. Although
they form the basis for a variety of complicated and powerful mathematical models, the
great conservation laws of science and engineering are conceptually easy to understand.
They all boil down to
Change = increases − decreases (1.14)
This is precisely the format that we employed when using Newton’s law to develop a force
balance for the bungee jumper [Eq. (1.8)].
Although simple, Eq. (1.14) embodies one of the most fundamental ways in which
conservation laws are used in engineering and science—that is, to predict changes
with respect to time. We will give it a special name—the time-variable (or transient)
computation.
Aside from predicting changes, another way in which conservation laws are applied is
for cases where change is nonexistent. If change is zero, Eq. (1.14) becomes
Change = 0 = increases − decreases
or
Increases = decreases (1.15)
Thus, if no change occurs, the increases and decreases must be in balance. This case, which
is also given a special name—the steady-state calculation—has many applications in engi-
neering and science. For example, for steady-state incompressible fluid flow in pipes, the
flow into a junction must be balanced by flow going out, as in
Flow in = o w out
For the junction in Fig. 1.5, the balance can be used to compute that the flow out of the
fourth pipe must be 60.
For the bungee jumper, the steady-state condition would correspond to the case where
the net force was zero or [Eq. (1.8) with dv/dt = 0]
mg = cdv2
(1.16)
Thus, at steady state, the downward and upward forces are in balance and Eq. (1.16) can be
solved for the terminal velocity
v =
gm
cd
Although Eqs. (1.14) and (1.15) might appear trivially simple, they embody the two funda-
mental ways that conservation laws are employed in engineering and science. As such, they
will form an important part of our efforts in subsequent chapters to illustrate the connection
between numerical methods and engineering and science.
12 MATHEMATICAL MODELING, NUMERICAL METHODS, AND PROBLEM SOLVING](https://image.slidesharecdn.com/appliednumericalmethodswithmatlabforengineersandscientiststhirdedition-230804185537-e8e53c83/85/Applied-Numerical-Methods-With-MATLAB-For-Engineers-And-Scientists-Third-Edition-32-320.jpg)


![20 MATHEMATICAL MODELING, NUMERICAL METHODS, AND PROBLEM SOLVING
PROBLEMS
1.1 Use calculus to verify that Eq. (1.9) is a solution of
Eq. (1.8) for the initial condition v(0) ⫽ 0.
1.2 Use calculus to solve Eq. (1.21) for the case where the ini-
tial velocity is (a) positive and (b) negative. (c) Based on your
results for (a) and (b), perform the same computation as in Ex-
ample 1.1 but with an initial velocity of ⫺40 m/s. Compute
values of the velocity from t ⫽ 0 to 12 s at intervals of 2 s. Note
that for this case, the zero velocity occurs at t ⫽ 3.470239 s.
1.3 The following information is available for a bank account:
Date Deposits Withdrawals Balance
5/1 1512.33
220.13 327.26
6/1
216.80 378.61
7/1
450.25 106.80
8/1
127.31 350.61
9/1
Note that the money earns interest which is computed as
Interest = i Bi
where i ⫽ the interest rate expressed as a fraction per month,
and Bi the initial balance at the beginning of the month.
(a) Use the conservation of cash to compute the balance on
6/1, 7/1, 8/1, and 9/1 if the interest rate is 1% per month
(i ⫽ 0.01/month). Show each step in the computation.
(b) Write a differential equation for the cash balance in the
form
dB
dt
= f [D(t), W(t), i]
where t ⫽ time (months), D(t) ⫽ deposits as a function
of time ($/month), W(t) ⫽ withdrawals as a function of
time ($/month). For this case, assume that interest is
compounded continuously; that is, interest ⫽ iB.
(c) Use Euler’s method with a time step of 0.5 month to
simulate the balance. Assume that the deposits and with-
drawals are applied uniformly over the month.
(d) Develop a plot of balance versus time for (a) and (c).
1.4 Repeat Example 1.2. Compute the velocity to t = 12 s,
with a step size of (a) 1 and (b) 0.5 s. Can you make any
statement regarding the errors of the calculation based on the
results?
1.5 Rather than the nonlinear relationship of Eq. (1.7), you
might choose to model the upward force on the bungee
jumper as a linear relationship:
FU = −c′
v
wherec′
= a first-order drag coefficient (kg/s).
(a) Using calculus, obtain the closed-form solution for the
case where the jumper is initially at rest (v = 0 at t = 0).
(b) Repeat the numerical calculation in Example 1.2 with
the same initial condition and parameter values. Use a
value of 11.5 kg/s for c′
.
1.6 For the free-falling bungee jumper with linear drag
(Prob. 1.5), assume a first jumper is 70 kg and has a drag co-
efficient of 12 kg/s. If a second jumper has a drag coefficient
of 15 kg/s and a mass of 80 kg, how long will it take her to
reach the same velocity jumper 1 reached in 9 s?
1.7 For the second-order drag model (Eq. 1.8), compute the
velocity of a free-falling parachutist using Euler’s method
for the case where m = 80 kg and cd = 0.25 kg/m. Perform
the calculation from t = 0 to 20 s with a step size of 1 s. Use
an initial condition that the parachutist has an upward veloc-
ity of 20 m/s at t = 0. At t = 10 s, assume that the chute is
instantaneously deployed so that the drag coefficient jumps
to 1.5 kg/m.
1.8 The amount of a uniformly distributed radioactive con-
taminant contained in a closed reactor is measured by its
concentration c (becquerel/liter or Bq/L). The contaminant
decreases at a decay rate proportional to its concentration;
that is
Decay rate = −kc
where k is a constant with units of day−1
. Therefore, accord-
ing to Eq. (1.14), a mass balance for the reactor can be
written as
dc
dt
= −kc
change
in mass
=
decrease
by decay
(a) Use Euler’s method to solve this equation from t = 0 to
1 d with k = 0.175 d–1
. Employ a step size of t = 0.1 d.
The concentration at t = 0 is 100 Bq/L.
(b) Plot the solution on a semilog graph (i.e., ln c versus t)
and determine the slope. Interpret your results.
1.9 A storage tank (Fig. P1.9) contains a liquid at depth y
where y = 0 when the tank is half full. Liquid is withdrawn
at a constant flow rate Q to meet demands. The contents are](https://image.slidesharecdn.com/appliednumericalmethodswithmatlabforengineersandscientiststhirdedition-230804185537-e8e53c83/85/Applied-Numerical-Methods-With-MATLAB-For-Engineers-And-Scientists-Third-Edition-40-320.jpg)
![PROBLEMS 21
0
y
FIGURE P1.9
0
y
ytop
yout
rtop
Qin
s
1
Qout
FIGURE P1.11
resupplied at a sinusoidal rate 3Q sin2
(t). Equation (1.14)
can be written for this system as
d(Ay)
dt
= 3Q sin2
(t) − Q
change in
volume
= (in o w) − (out o w)
or, since the surface area A is constant
dy
dt
= 3
Q
A
sin2
(t) −
Q
A
Use Euler’s method to solve for the depth y from t = 0 to
10 d with a step size of 0.5 d. The parameter values are A =
1250 m2
and Q = 450 m3
/d. Assume that the initial condition
is y = 0.
1.10 For the same storage tank described in Prob. 1.9, sup-
pose that the outflow is not constant but rather depends on
the depth. For this case, the differential equation for depth
can be written as
dy
dt
= 3
Q
A
sin2
(t) −
α(1 + y)1.5
A
Use Euler’s method to solve for the depth y from t = 0 to
10 d with a step size of 0.5 d. The parameter values are A =
1250 m2
, Q = 450 m3
/d, and α = 150. Assume that the ini-
tial condition is y = 0.
1.11 Apply the conservation of volume (see Prob. 1.9) to sim-
ulate the level of liquid in a conical storage tank (Fig. P1.11).
The liquid flows in at a sinusoidal rate of Qin = 3 sin2
(t) and
flows out according to
Qout = 3(y − yout)1.5
y yout
Qout = 0 y ≤ yout
where flow has units of m3
/d and y = the elevation of the
water surface above the bottom of the tank (m). Use Euler’s
method to solve for the depth y from t = 0 to 10 d with a step
size of 0.5 d. The parameter values are rtop ⫽ 2.5 m, ytop ⫽ 4 m,
and yout ⫽ 1 m. Assume that the level is initially below the
outlet pipe with y(0) ⫽ 0.8 m.
1.12 A group of 35 students attend a class in an insulated
room which measures 11 m by 8 m by 3 m. Each student
takes up about 0.075 m3
and gives out about 80 W of heat
(1 W = 1 J/s). Calculate the air temperature rise during the first
20 minutes of the class if the room is completely sealed and in-
sulated.Assume the heat capacity Cv for air is 0.718 kJ/(kg K).
Assume air is an ideal gas at 20°C and 101.325 kPa. Note
that the heat absorbed by the air Q is related to the mass of
the air m the heat capacity, and the change in temperature by
the following relationship:
Q = m
T2
T1
CvdT = mCv(T2 − T1)
The mass of air can be obtained from the ideal gas law:
PV =
m
Mwt
RT
where P is the gas pressure, V is the volume of the gas, Mwt
is the molecular weight of the gas (for air, 28.97 kg/kmol),
and R is the ideal gas constant [8.314 kPa m3
/(kmol K)].](https://image.slidesharecdn.com/appliednumericalmethodswithmatlabforengineersandscientiststhirdedition-230804185537-e8e53c83/85/Applied-Numerical-Methods-With-MATLAB-For-Engineers-And-Scientists-Third-Edition-41-320.jpg)


![2.2.2 Arrays, Vectors and Matrices
An array is a collection of values that are represented by a single variable name. One-
dimensional arrays are called vectors and two-dimensional arrays are called matrices. The
scalars used in Section 2.2.1 are actually matrices with one row and one column.
Brackets are used to enter arrays in the command mode. For example, a row vector can
be assigned as follows:
a = [1 2 3 4 5]
a =
1 2 3 4 5
Note that this assignment overrides the previous assignment of a = 4.
In practice, row vectors are rarely used to solve mathematical problems. When we
speak of vectors, we usually refer to column vectors, which are more commonly used. A
column vector can be entered in several ways. Try them.
b = [2;4;6;8;10]
or
b = [2
4
6
8
10]
or, by transposing a row vector with the ' operator,
b = [2 4 6 8 10]'
The result in all three cases will be
b =
2
4
6
8
10
A matrix of values can be assigned as follows:
A = [1 2 3; 4 5 6; 7 8 9]
A =
1 2 3
4 5 6
7 8 9
In addition, the Enter key (carriage return) can be used to separate the rows. For example,
in the following case, the Enter key would be struck after the 3, the 6 and the ] to assign the
matrix:
A = [1 2 3
4 5 6
7 8 9]
28 MATLAB FUNDAMENTALS](https://image.slidesharecdn.com/appliednumericalmethodswithmatlabforengineersandscientiststhirdedition-230804185537-e8e53c83/85/Applied-Numerical-Methods-With-MATLAB-For-Engineers-And-Scientists-Third-Edition-48-320.jpg)
![2.2 ASSIGNMENT 29
Finally, we could construct the same matrix by concatenating (i.e., joining) the vectors
representing each column:
A = [[1 4 7]' [2 5 8]' [3 6 9]']
At any point in a session, a list of all current variables can be obtained by entering the
who command:
who
Your variables are:
A a ans b x
or, with more detail, enter the whos command:
whos
Name Size Bytes Class
A 3x3 72 double array
a 1x5 40 double array
ans 1x1 8 double array
b 5x1 40 double array
x 1x1 16 double array (complex)
Grand total is 21 elements using 176 bytes
Note that subscript notation can be used to access an individual element of an array.
For example, the fourth element of the column vector b can be displayed as
b(4)
ans =
8
For an array, A(m,n) selects the element in mth row and the nth column. For example,
A(2,3)
ans =
6
There are several built-in functions that can be used to create matrices. For example,
the ones and zeros functions create vectors or matrices filled with ones and zeros,
respectively. Both have two arguments, the first for the number of rows and the second for
the number of columns. For example, to create a 2 × 3 matrix of zeros:
E = zeros(2,3)
E =
0 0 0
0 0 0
Similarly, the ones function can be used to create a row vector of ones:
u = ones(1,3)
u =
1 1 1](https://image.slidesharecdn.com/appliednumericalmethodswithmatlabforengineersandscientiststhirdedition-230804185537-e8e53c83/85/Applied-Numerical-Methods-With-MATLAB-For-Engineers-And-Scientists-Third-Edition-49-320.jpg)

![2.2 ASSIGNMENT 31
which generates n points between x1 and x2. For example
linspace(0,1,6)
ans =
0 0.2000 0.4000 0.6000 0.8000 1.0000
If the n is omitted, the function automatically generates 100 points.
The logspace function generates a row vector that is logarithmically equally spaced.
It has the form
logspace(x1, x2, n)
which generates n logarithmically equally spaced points between decades 10x1
and 10x2
.
For example,
logspace(-1,2,4)
ans =
0.1000 1.0000 10.0000 100.0000
If n is omitted, it automatically generates 50 points.
2.2.5 Character Strings
Aside from numbers, alphanumeric information or character strings can be represented by
enclosing the strings within single quotation marks. For example,
f = 'Miles ';
s = 'Davis';
Each character in a string is one element in an array. Thus, we can concatenate (i.e., paste
together) strings as in
x = [f s]
x =
Miles Davis
Note that very long lines can be continued by placing an ellipsis (three consecutive
periods) at the end of the line to be continued. For example, a row vector could be entered as
a = [1 2 3 4 5 ...
6 7 8]
a =
1 2 3 4 5 6 7 8
However, you cannot use an ellipsis within single quotes to continue a string. To enter a
string that extends beyond a single line, piece together shorter strings as in
quote = ['Any fool can make a rule,' ...
' and any fool will mind it']
quote =
Any fool can make a rule, and any fool will mind it](https://image.slidesharecdn.com/appliednumericalmethodswithmatlabforengineersandscientiststhirdedition-230804185537-e8e53c83/85/Applied-Numerical-Methods-With-MATLAB-For-Engineers-And-Scientists-Third-Edition-51-320.jpg)
![2.3 MATHEMATICAL OPERATIONS 33
Calculations can also involve complex quantities. Here are some examples that use the
values of x (2 + 4i) and y (16) defined previously:
3 * x
ans =
6.0000 + 12.0000i
1 / x
ans =
0.1000 - 0.2000i
x ^ 2
ans =
-12.0000 + 16.0000i
x + y
ans =
18.0000 + 4.0000i
The real power of MATLAB is illustrated in its ability to carry out vector-matrix
calculations. Although we will describe such calculations in detail in Chap. 8, it is worth
introducing some examples here.
The inner product of two vectors (dot product) can be calculated using the * operator,
a * b
ans =
110
and likewise, the outer product
b * a
ans =
2 4 6 8 10
4 8 12 16 20
6 12 18 24 30
8 16 24 32 40
10 20 30 40 50
To further illustrate vector-matrix multiplication, first redefine a and b:
a = [1 2 3];
and
b = [4 5 6]';
Now, try
a * A
ans =
30 36 42](https://image.slidesharecdn.com/appliednumericalmethodswithmatlabforengineersandscientiststhirdedition-230804185537-e8e53c83/85/Applied-Numerical-Methods-With-MATLAB-For-Engineers-And-Scientists-Third-Edition-53-320.jpg)


![definitions also. MATLAB will evaluate the matrix version when the letter m is appended to
the function name. Try
sqrtm(A)
ans =
0.4498 + 0.7623i 0.5526 + 0.2068i 0.6555 - 0.3487i
1.0185 + 0.0842i 1.2515 + 0.0228i 1.4844 - 0.0385i
1.5873 - 0.5940i 1.9503 - 0.1611i 2.3134 + 0.2717i
There are several functions for rounding. For example, suppose that we enter a vector:
E = [-1.6 -1.5 -1.4 1.4 1.5 1.6];
The round function rounds the elements of E to the nearest integers:
round(E)
ans =
-2 -2 -1 1 2 2
The ceil (short for ceiling) function rounds to the nearest integers toward infinity:
ceil(E)
ans =
-1 -1 -1 2 2 2
The floor function rounds down to the nearest integers toward minus infinity:
floor(E)
ans =
-2 -2 -2 1 1 1
There are also functions that perform special actions on the elements of matrices and
arrays. For example, the sum function returns the sum of the elements:
F = [3 5 4 6 1];
sum(F)
ans =
19
In a similar way, it should be pretty obvious what’s happening with the following commands:
min(F),max(F),mean(F),prod(F),sort(F)
ans =
1
ans =
6
ans =
3.8000
ans =
360
ans =
1 3 4 5 6
36 MATLAB FUNDAMENTALS](https://image.slidesharecdn.com/appliednumericalmethodswithmatlabforengineersandscientiststhirdedition-230804185537-e8e53c83/85/Applied-Numerical-Methods-With-MATLAB-For-Engineers-And-Scientists-Third-Edition-56-320.jpg)
![2.4 USE OF BUILT-IN FUNCTIONS 37
A common use of functions is to evaluate a formula for a series of arguments. Recall
that the velocity of a free-falling bungee jumper can be computed with [Eq. (1.9)]:
v =
gm
cd
tanh
gcd
m
t
where v is velocity (m/s), g is the acceleration due to gravity (9.81 m/s2
), m is mass (kg),
cd is the drag coefficient (kg/m), and t is time (s).
Create a column vector t that contains values from 0 to 20 in steps of 2:
t = [0:2:20]'
t =
0
2
4
6
8
10
12
14
16
18
20
Check the number of items in the t array with the length function:
length(t)
ans =
11
Assign values to the parameters:
g = 9.81; m = 68.1; cd = 0.25;
MATLAB allows you to evaluate a formula such as v = f (t), where the formula is
computed for each value of the t array, and the result is assigned to a corresponding posi-
tion in the v array. For our case,
v = sqrt(g*m/cd)*tanh(sqrt(g*cd/m)*t)
v =
0
18.7292
33.1118
42.0762
46.9575
49.4214
50.6175
51.1871
51.4560
51.5823
51.6416](https://image.slidesharecdn.com/appliednumericalmethodswithmatlabforengineersandscientiststhirdedition-230804185537-e8e53c83/85/Applied-Numerical-Methods-With-MATLAB-For-Engineers-And-Scientists-Third-Edition-57-320.jpg)


![42 MATLAB FUNDAMENTALS
2.7 CASE STUDY EXPLORATORY DATA ANALYSIS
Background. Your textbooks are filled with formulas developed in the past by
renowned scientists and engineers.Although these are of great utility, engineers and scientists
often must supplement these relationships by collecting and analyzing their own data. Some-
times this leads to a new formula. However, prior to arriving at a final predictive equation, we
usually “play” with the data by performing calculations and developing plots. In most cases,
our intent is to gain insight into the patterns and mechanisms hidden in the data.
In this case study, we will illustrate how MATLAB facilitates such exploratory data
analysis. We will do this by estimating the drag coefficient of a free-falling human based on
Eq. (2.1) and the data from Table 2.1. However, beyond merely computing the drag
coefficient, we will use MATLAB’s graphical capabilities to discern patterns in the data.
Solution. The data from Table 2.1 along with gravitational acceleration can be entered as
m=[83.6 60.2 72.1 91.1 92.9 65.3 80.9];
vt=[53.4 48.5 50.9 55.7 54 47.7 51.1];
g=9.81;
The drag coefficients can then be computed with Eq. (2.1). Because we are performing
element-by-element operations on vectors, we must include periods prior to the operators:
cd=g*m./vt.^2
cd =
0.2876 0.2511 0.2730 0.2881 0.3125 0.2815 0.3039
We can now use some of MATLAB’s built-in functions to generate some statistics for the
results:
cdavg=mean(cd),cdmin=min(cd),cdmax=max(cd)
cdavg =
0.2854
cdmin =
0.2511
cdmax =
0.3125
Thus, the average value is 0.2854 with a range from 0.2511 to 0.3125 kg/m.
Now, let’s start to play with these data by using Eq. (2.1) to make a prediction of the
terminal velocity based on the average drag:
vpred=sqrt(g*m/cdavg)
vpred =
53.6065 45.4897 49.7831 55.9595 56.5096 47.3774
52.7338
Notice that we do not have to use periods prior to the operators in this formula? Do you
understand why?
We can plot these values versus the actual measured terminal velocities. We will also
superimpose a line indicating exact predictions (the 1:1 line) to help assess the results.](https://image.slidesharecdn.com/appliednumericalmethodswithmatlabforengineersandscientiststhirdedition-230804185537-e8e53c83/85/Applied-Numerical-Methods-With-MATLAB-For-Engineers-And-Scientists-Third-Edition-62-320.jpg)

![44 MATLAB FUNDAMENTALS
2.7 CASE STUDY continued
increases. Based on this result, you might conclude that your model needs to be improved.
At the least, it might motivate you to conduct further experiments with a larger number of
jumpers to confirm your preliminary finding.
In addition, the result might also stimulate you to go to the fluid mechanics literature and
learn more about the science of drag. As described previously in Sec. 1.4, you would dis-
cover that the parameter cd is actually a lumped drag coefficient that along with the true
drag includes other factors such as the jumper’s frontal area and air density:
cd =
CDρ A
2
(2.2)
where CD = a dimensionless drag coefficient, ρ = air density (kg/m3
), and A = frontal
area (m2
), which is the area projected on a plane normal to the direction of the velocity.
Assuming that the densities were relatively constant during data collection (a pretty
good assumption if the jumpers all took off from the same height on the same day), Eq. (2.2)
suggests that heavier jumpers might have larger areas. This hypothesis could be substanti-
ated by measuring the frontal areas of individuals of varying masses.
2.1 Use the linspace function to create vectors identical to
the following created with colon notation:
(a) t = 4:6:35
(b) x = -4:2
2.2 Use colon notation to create vectors identical to the
following created with the linspace function:
(a) v = linspace(-2,1.5,8)
(b) r = linspace(8,4.5,8)
2.3 The command linspace(a, b, n) generates a row
vector of n equally spaced points between a and b. Use
colon notation to write an alternative one-line command to
generate the same vector. Test your formulation for a = −3,
b = 5, n = 6.
2.4 The following matrix is entered in MATLAB:
A=[3 2 1;0:0.5:1;linspace(6, 8, 3)]
(a) Write out the resulting matrix.
(b) Use colon notation to write a single-line MATLAB com-
mand to multiply the second row by the third column
and assign the result to the variable C.
2.5 The following equation can be used to compute values
of y as a function of x:
y = be−ax
sin(bx)(0.012x4
− 0.15x3
+ 0.075x2
+ 2.5x)
where a and b are parameters. Write the equation for imple-
mentation with MATLAB, where a = 2, b = 5, and x is a
vector holding values from 0 to π/2 in increments of
x = π/40. Employ the minimum number of periods (i.e.,
dot notation) so that your formulation yields a vector for y.
In addition, compute the vector z = y2
where each element
holds the square of each element of y. Combine x, y, and z
into a matrix w, where each column holds one of the vari-
ables, and display w using the short g format. In addition,
generate a labeled plot of y and z versus x. Include a legend
on the plot (use help to understand how to do this). For y,
use a 1.5-point, dashdotted red line with 14-point, red-
edged, white-faced pentagram-shaped markers. For z, use a
standard-sized (i.e., default) solid blue line with standard-
sized, blue-edged, green-faced square markers.
2.6 A simple electric circuit consisting of a resistor, a ca-
pacitor, and an inductor is depicted in Fig. P2.6. The charge
on the capacitor q(t) as a function of time can be computed
as
q(t) = q0e−Rt/(2L)
cos
⎡
⎣
1
LC
−
R
2L
2
t
⎤
⎦
PROBLEMS](https://image.slidesharecdn.com/appliednumericalmethodswithmatlabforengineersandscientiststhirdedition-230804185537-e8e53c83/85/Applied-Numerical-Methods-With-MATLAB-For-Engineers-And-Scientists-Third-Edition-64-320.jpg)

![46 MATLAB FUNDAMENTALS
2.13 Here are some wind tunnel data for force (F) versus
velocity (v):
v, m/s 10 20 30 40 50 60 70 80
F, N 25 70 380 550 610 1220 830 1450
These data can be described by the following function:
F = 0.2741v1.9842
Use MATLAB to create a plot displaying both the data (using
circular magenta symbols) and the function (using a black
dash-dotted line). Plot the function for v = 0 to 100 m/s and
label the plot’s axes.
2.14 The loglog function operates in an identical fashion
to the plot function except that logarithmic scales are used
for both the x and y axes. Use this function to plot the data
and function as described in Prob. 2.13. Explain the results.
2.15 The Maclaurin series expansion for the cosine is
cos x = 1 −
x2
2!
+
x4
4!
−
x6
6!
+
x8
8!
− · · ·
Use MATLAB to create a plot of the sine (solid line) along
with a plot of the series expansion (black dashed line) up
to and including the term x8
/8!. Use the built-in function
factorial in computing the series expansion. Make the
range of the abscissa from x = 0 to 3π/2.
2.16 You contact the jumpers used to generate the data in
Table 2.1 and measure their frontal areas. The resulting
values, which are ordered in the same sequence as the
corresponding values in Table 2.1, are
A, m2
0.455 0.402 0.452 0.486 0.531 0.475 0.487
(a) If the air density is ρ = 1.223 kg/m3
, use MATLAB to
compute values of the dimensionless drag coefficient CD.
(b) Determine the average, minimum and maximum of the
resulting values.
(c) Develop a stacked plot of A versus m (upper) and CD
versus m (lower). Include descriptive axis labels and
titles on the plots.
2.17 The following parametric equations generate a conical
helix.
x = t cos(6t)
y = t sin(6t)
z = t
Compute values of x, y, and z for t = 0 to 6π with
t = π/64. Use subplot to generate a two-dimensional
line plot (red solid line) of (x, y) in the top pane and a three-
dimensional line plot (cyan solid line) of (x, y, z) in the
bottom pane. Label the axes for both plots.
2.18 Exactly what will be displayed after the following
MATLAB commands are typed?
(a) x = 5;
x ^ 3;
y = 8 – x
(b) q = 4:2:12;
r = [7 8 4; 3 6 –5];
sum(q) * r(2, 3)
2.19 The trajectory of an object can be modeled as
y = (tan θ0)x −
g
2v2
0cos2θ0
x2
+ y0
where y = height (m), θ0 = initial angle (radians), x =
horizontal distance (m), g = gravitational acceleration
(= 9.81 m/s2
), v0 = initial velocity (m/s), and y0 = initial
height. Use MATLAB to find the trajectories for y0 = 0 and
v0 = 28 m/s for initial angles ranging from 15 to 75° in in-
crements of 15°. Employ a range of horizontal distances
from x = 0 to 80 m in increments of 5 m. The results should
be assembled in an array where the first dimension (rows)
corresponds to the distances, and the second dimension
(columns) corresponds to the different initial angles. Use
this matrix to generate a single plot of the heights versus
horizontal distances for each of the initial angles. Employ a
legend to distinguish among the different cases, and scale
the plot so that the minimum height is zero using the axis
command.
2.20 The temperature dependence of chemical reactions can
be computed with the Arrhenius equation:
k = Ae−E/(RTa)
where k = reaction rate (s−1
), A = the preexponential (or fre-
quency) factor, E = activation energy (J/mol), R = gas con-
stant [8.314 J/(mole · K)], and Ta = absolute temperature
(K). A compound has E = 1 × 10⁵
J/mol and A = 7 × 10¹⁶
.
Use MATLAB to generate values of reaction rates for
temperatures ranging from 253 to 325 K. Use subplot to
generate a side-by-side graph of (a) k versus Ta (green line)
and (b) log10 k (red line) versus 1/Ta. Employ the semilogy
function to create (b). Include axis labels and titles for both
subplots. Interpret your results.](https://image.slidesharecdn.com/appliednumericalmethodswithmatlabforengineersandscientiststhirdedition-230804185537-e8e53c83/85/Applied-Numerical-Methods-With-MATLAB-For-Engineers-And-Scientists-Third-Edition-66-320.jpg)
![(c) moment [M(x) = EId2
y/dx2
],
(d) shear [V(x) = EId3
y/dx3
], and
(e) loading [w(x) = −EId4
y/dx4
].
Use the following parameters for your computation:
L = 600 cm, E = 50,000 kN/cm2
, I = 30,000 cm4
,
w0 = 2.5 kN/cm, and x = 10 cm. Employ the subplot
function to display all the plots vertically on the same page
in the order (a) to (e). Include labels and use consistent MKS
units when developing the plots.
2.22 The butterfly curve is given by the following paramet-
ric equations:
x = sin(t)
ecos t
− 2 cos 4t − sin5 t
12
y = cos(t)
ecos t
− 2 cos 4t − sin5 t
12
Generate values of x and y for values of t from 0 to 100 with
t = 1/16. Construct plots of (a) x and y versus t and (b) y
versus x. Use subplot to stack these plots vertically and
make the plot in (b) square. Include titles and axis labels on
both plots and a legend for (a). For (a), employ a dotted line
for y in order to distinguish it from x.
2.23 The butterfly curve from Prob. 2.22 can also be repre-
sented in polar coordinates as
r = esin θ
− 2 cos(4θ) − sin5
2θ − π
24
Generate values of r for values of θ from 0 to 8π with
θ = π/32. Use the MATLAB function polar to generate
the polar plot of the butterfly curve with a dashed red line.
Employ the MATLAB Help to understand how to generate
the plot.
2.21 Figure P2.21a shows a uniform beam subject to a lin-
early increasing distributed load. As depicted in Fig. P2.21b,
deflection y (m) can be computed with
y =
w0
120EIL
(−x5
+ 2L2
x3
− L4
x)
where E = the modulus of elasticity and I = the moment of
inertia (m4
). Employ this equation and calculus to generate
MATLAB plots of the following quantities versus distance
along the beam:
(a) displacement (y),
(b) slope [θ(x) = dy/dx],
PROBLEMS 47
w0
L
(a)
(x = 0, y = 0)
(x = L, y = 0)
x
(b)
FIGURE P2.21](https://image.slidesharecdn.com/appliednumericalmethodswithmatlabforengineersandscientiststhirdedition-230804185537-e8e53c83/85/Applied-Numerical-Methods-With-MATLAB-For-Engineers-And-Scientists-Third-Edition-67-320.jpg)

![We also learned that a numerical solution of this equation could be obtained with Euler’s
method:
vi+1 = vi +
dvi
dt
t
This equation can be implemented repeatedly to compute velocity as a function of
time. However, to obtain good accuracy, many small steps must be taken. This would be
extremely laborious and time consuming to implement by hand. However, with the aid of
MATLAB, such calculations can be performed easily.
So our problem now is to figure out how to do this. This chapter will introduce you to
how MATLAB M-files can be used to obtain such solutions.
3.1 M-FILES
The most common way to operate MATLAB is by entering commands one at a time in the
command window. M-files provide an alternative way of performing operations that
greatly expand MATLAB’s problem-solving capabilities. An M-file consists of a series of
statements that can be run all at once. Note that the nomenclature “M-file” comes from the
fact that such files are stored with a .m extension. M-files come in two flavors: script files
and function files.
3.1.1 Script Files
A script file is merely a series of MATLAB commands that are saved on a file. They are
useful for retaining a series of commands that you want to execute on more than one occa-
sion. The script can be executed by typing the file name in the command window or by
invoking the menu selections in the edit window: Debug, Run.
EXAMPLE 3.1 Script File
Problem Statement. Develop a script file to compute the velocity of the free-falling
bungee jumper for the case where the initial velocity is zero.
Solution. Open the editor with the menu selection: File, New, M-file. Type in the follow-
ing statements to compute the velocity of the free-falling bungee jumper at a specific time
[recall Eq. (1.9)]:
g = 9.81; m = 68.1; t = 12; cd = 0.25;
v = sqrt(g * m / cd) * tanh(sqrt(g * cd / m) * t)
Save the file as scriptdemo.m. Return to the command window and type
scriptdemo
The result will be displayed as
v =
50.6175
Thus, the script executes just as if you had typed each of its lines in the command window.
3.1 M-FILES 49](https://image.slidesharecdn.com/appliednumericalmethodswithmatlabforengineersandscientiststhirdedition-230804185537-e8e53c83/85/Applied-Numerical-Methods-With-MATLAB-For-Engineers-And-Scientists-Third-Edition-69-320.jpg)


![the following message would have been displayed
??? Undefined function or variable 'g'.
So even though g had a value of 9.81 within the M-file, it would not have a value in the
command workspace. As noted previously at the end of Example 3.1, this is an important
distinction between functions and scripts. The variables within a function are said to be
local and are erased after the function is executed. In contrast, the variables in a script
retain their existence after the script is executed.
Function M-files can return more than one result. In such cases, the variables contain-
ing the results are comma-delimited and enclosed in brackets. For example, the following
function, stats.m, computes the mean and the standard deviation of a vector:
function [mean, stdev] = stats(x)
n = length(x);
mean = sum(x)/n;
stdev = sqrt(sum((x-mean).^2/(n-1)));
Here is an example of how it can be applied:
y = [8 5 10 12 6 7.5 4];
[m,s] = stats(y)
m =
7.5000
s =
2.8137
Although we will also make use of script M-files, function M-files will be our primary
programming tool for the remainder of this book. Hence, we will often refer to function
M-files as simply M-files.
3.1.3 Subfunctions
Functions can call other functions. Although such functions can exist as separate M-files,
they may also be contained in a single M-file. For example, the M-file in Example 3.2
(without comments) could have been split into two functions and saved as a single
M-file1
:
function v = freefallsubfunc(t, m, cd)
v = vel(t, m, cd);
end
function v = vel(t, m, cd)
g = 9.81;
v = sqrt(g * m / cd)*tanh(sqrt(g * cd / m) * t);
end
52 PROGRAMMING WITH MATLAB
1
Note that although end statements are not used to terminate single-function M-files, they are included when
subfunctions are involved to demarcate the boundaries between the main function and the subfunctions.](https://image.slidesharecdn.com/appliednumericalmethodswithmatlabforengineersandscientiststhirdedition-230804185537-e8e53c83/85/Applied-Numerical-Methods-With-MATLAB-For-Engineers-And-Scientists-Third-Edition-72-320.jpg)


![displayed in integer, decimal, or scientific format. After displaying the value of velocity,
MATLAB continues displaying the character information (in our case the units: m/s) until
it detects the symbol . This tells MATLAB that the following text is a control code. As in
Table 3.1, the control codes provide a means to perform actions such as skipping to the
next line. If we had omitted the code n in the previous example, the command prompt
would appear at the end of the label m/s rather than on the next line as would typically be
desired.
The fprintf function can also be used to display several values per line with differ-
ent formats. For example,
fprintf('%5d %10.3f %8.5en',100,2*pi,pi);
100 6.283 3.14159e+000
It can also be used to display vectors and matrices. Here is an M-file that enters two
sets of values as vectors. These vectors are then combined into a matrix, which is then dis-
played as a table with headings:
function fprintfdemo
x = [1 2 3 4 5];
y = [20.4 12.6 17.8 88.7 120.4];
z = [x;y];
fprintf(' x yn');
fprintf('%5d %10.3fn',z);
The result of running this M-file is
fprintfdemo
x y
1 20.400
2 12.600
3 17.800
4 88.700
5 120.400
3.2 INPUT-OUTPUT 55
TABLE 3.1 Commonly used format and control codes employed
with the fprintf function.
Format Code Description
%d Integer format
%e Scientific format with lowercase e
%E Scientific format with uppercase E
%f Decimal format
%g The more compact of %e or %f
Control Code Description
n Start new line
t Tab](https://image.slidesharecdn.com/appliednumericalmethodswithmatlabforengineersandscientiststhirdedition-230804185537-e8e53c83/85/Applied-Numerical-Methods-With-MATLAB-For-Engineers-And-Scientists-Third-Edition-75-320.jpg)
![3.2.1 Creating and Accessing Files
MATLAB has the capability to both read and write data files. The simplest approach in-
volves a special type of binary file, called a MAT-file, which is expressly designed for
implementation within MATLAB. Such files are created and accessed with the save and
load commands.
The save command can be used to generate a MAT-file holding either the entire work-
space or a few selected variables. A simple representation of its syntax is
save filename var1 var2 ... varn
This command creates a MAT-file named filename.mat that holds the variables var1
through varn. If the variables are omitted, all the workspace variables are saved. The load
command can subsequently be used to retrieve the file:
load filename var1 var2 ... varn
which retrieves the variables var1 through varn from filename.mat. As was the case
with save, if the variables are omitted, all the variables are retrieved.
For example, suppose that you use Eq. (1.9) to generate velocities for a set of drag
coefficients:
g=9.81;m=80;t=5;
cd=[.25 .267 .245 .28 .273]';
v=sqrt(g*m ./cd).*tanh(sqrt(g*cd/m)*t);
You can then create a file holding the values of the drag coefficients and the velocities with
save veldrag v cd
To illustrate how the values can be retrieved at a later time, remove all variables from
the workspace with the clear command,
clear
At this point, if you tried to display the velocities you would get the result:
v
??? Undefined function or variable 'v'.
However, you can recover them by entering
load veldrag
Now, the velocities are available as can be verified by typing
who
Your variables are:
cd v
Although MAT-files are quite useful when working exclusively within the MATLAB
environment, a somewhat different approach is required when interfacing MATLAB with
other programs. In such cases, a simple approach is to create text files written in ASCII
format.
56 PROGRAMMING WITH MATLAB](https://image.slidesharecdn.com/appliednumericalmethodswithmatlabforengineersandscientiststhirdedition-230804185537-e8e53c83/85/Applied-Numerical-Methods-With-MATLAB-For-Engineers-And-Scientists-Third-Edition-76-320.jpg)
![ASCII files can be generated in MATLAB by appending –ascii to the save com-
mand. In contrast to MAT-files where you might want to save the entire workspace, you
would typically save a single rectangular matrix of values. For example,
A=[5 7 9 2;3 6 3 9];
save simpmatrix.txt –ascii
In this case, the save command stores the values in A in 8-digit ASCII form. If you want
to store the numbers in double precision, just append –ascii –double. In either case, the
file can be accessed by other programs such as spreadsheets or word processors. For
example, if you open this file with a text editor, you will see
5.0000000e+000 7.0000000e+000 9.0000000e+000 2.0000000e+000
3.0000000e+000 6.0000000e+000 3.0000000e+000 9.0000000e+000
Alternatively, you can read the values back into MATLAB with the load command,
load simpmatrix.txt
Because simpmatrix.txt is not a MAT-file, MATLAB creates a double precision array
named after the filename:
simpmatrix
simpmatrix =
5 7 9 2
3 6 3 9
Alternatively, you could use the load command as a function and assign its values to a
variable as in
A = load('simpmatrix.txt')
The foregoing material covers but a small portion of MATLAB’s file management ca-
pabilities. For example, a handy import wizard can be invoked with the menu selections:
File, Import Data. As an exercise, you can demonstrate the import wizards convenience by
using it to open simpmatrix.txt. In addition, you can always consult help to learn more
about this and other features.
3.3 STRUCTURED PROGRAMMING
The simplest of all M-files perform instructions sequentially. That is, the program state-
ments are executed line by line starting at the top of the function and moving down to the
end. Because a strict sequence is highly limiting, all computer languages include state-
ments allowing programs to take nonsequential paths. These can be classified as
• Decisions (or Selection). The branching of flow based on a decision.
• Loops (or Repetition). The looping of flow to allow statements to be repeated.
3.3.1 Decisions
The if Structure. This structure allows you to execute a set of statements if a logical
condition is true. Its general syntax is
if condition
statements
end
3.3 STRUCTURED PROGRAMMING 57](https://image.slidesharecdn.com/appliednumericalmethodswithmatlabforengineersandscientiststhirdedition-230804185537-e8e53c83/85/Applied-Numerical-Methods-With-MATLAB-For-Engineers-And-Scientists-Third-Edition-77-320.jpg)


![fragment that indicates how a for loop along with the two functions can be employed
to create a movie,
% create animation with standard plot functions
for j=1:n
plot commands
M(j) = getframe;
end
movie(M)
Each time the loop executes, the plot commands create an updated version of a plot,
which is then stored in the vector M. After the loop terminates, the n images are then played
back by movie.
EXAMPLE 3.6 Animation of Projectile Motion
Problem Statement. In the absence of air resistance, the Cartesian coordinates of a pro-
jectile launched with an initial velocity (v0) and angle (θ0) can be computed with
x = v0 cos(θ 0)t
y = v0 sin(θ 0)t ⫺ 0.5gt2
where g = 9.81 m/s2
. Develop a script to generate an animated plot of the projectile’s
trajectory given that v0 = 5 m/s and θ0 = 45⬚.
Solution. A script to generate the animation can be written as
clc,clf,clear
g=9.81; theta0=45*pi/180; v0=5;
t(1)=0;x=0;y=0;
plot(x,y,'o','MarkerFaceColor','b','MarkerSize',8)
axis([0 3 0 0.8])
M(1)=getframe;
dt=1/128;
for j = 2:1000
t(j)=t(j-1)+dt;
x=v0*cos(theta0)*t(j);
y=v0*sin(theta0)*t(j)-0.5*g*t(j)^2;
plot(x,y,'o','MarkerFaceColor','b','MarkerSize',8)
axis([0 3 0 0.8])
M(j)=getframe;
if y=0, break, end
end
pause
movie(M,1)
Several features of this script bear mention. First, notice that we have fixed the ranges for
the x and y axes. If this is not done, the axes will rescale and cause the animation to jump
around. Second, we terminate the for loop when the projectile’s height y falls below zero.
When the script is executed, two animations will be displayed (we’ve placed a pause
between them). The first corresponds to the sequential generation of the frames within the
loop, and the second corresponds to the actual movie. Although we cannot show the results
here, the trajectory for both cases will look like Fig. 3.2. You should enter and run the fore-
going script in MATLAB to see the actual animation.
70 PROGRAMMING WITH MATLAB](https://image.slidesharecdn.com/appliednumericalmethodswithmatlabforengineersandscientiststhirdedition-230804185537-e8e53c83/85/Applied-Numerical-Methods-With-MATLAB-For-Engineers-And-Scientists-Third-Edition-90-320.jpg)


![3.5 PASSING FUNCTIONS TO M-FILES 75
Thus, the function handle holds a snapshot of the function at the time it was created. If we
want the variables to take on values, we must recreate the function. For example, having
changed a to 3,
f2=@(x) a*x^b;
with the result
f2(3)
ans =
27
It should be noted that prior to MATLAB 7, inline functions performed the same
role as anonymous functions. For example, the anonymous function developed above, f1,
could be written as
f1=inline('x^2 + y^2','x','y');
Although they are being phased out in favor of anonymous function, some readers might be
using earlier versions, and so we thought it would be helpful to mention them. MATLAB
help can be consulted to learn more about their use and limitations.
3.5.2 Function Functions
Function functions are functions that operate on other functions which are passed to it as
input arguments. The function that is passed to the function function is referred to as the
passed function. A simple example is the built-in function fplot, which plots the graphs
of functions. A simple representation of its syntax is
fplot(func,lims)
where func is the function being plotted between the x-axis limits specified by lims =
[xmin xmax]. For this case, func is the passed function. This function is “smart” in that it
automatically analyzes the function and decides how many values to use so that the plot
will exhibit all the function’s features.
Here is an example of how fplot can be used to plot the velocity of the free-falling
bungee jumper. The function can be created with an anonymous function:
vel=@(t) ...
sqrt(9.81*68.1/0.25)*tanh(sqrt(9.81*0.25/68.1)*t);
We can then generate a plot from t = 0 to 12 as
fplot(vel,[0 12])
The result is displayed in Fig. 3.3.
Note that in the remainder of this book, we will have many occasions to use MATLAB’s
built-in function functions. As in the following example, we will also be developing
our own.](https://image.slidesharecdn.com/appliednumericalmethodswithmatlabforengineersandscientiststhirdedition-230804185537-e8e53c83/85/Applied-Numerical-Methods-With-MATLAB-For-Engineers-And-Scientists-Third-Edition-95-320.jpg)


![Design the function so that it displays an error message and
terminates in the event that the user enters a value of score
that is less than zero or greater than 100. Test your function
with 89.9999, 90, 45 and 120.
3.9 Manning’s equation can be used to compute the velocity
of water in a rectangular open channel:
U =
√
S
n
BH
B + 2H
2/3
where U = velocity (m/s), S = channel slope, n = roughness
coefficient, B = width (m), and H = depth (m). The follow-
ing data are available for five channels:
n S B H
0.036 0.0001 10 2
0.020 0.0002 8 1
0.015 0.0012 20 1.5
0.030 0.0007 25 3
0.022 0.0003 15 2.6
Write an M-file that computes the velocity for each of these
channels. Enter these values into a matrix where each col-
umn represents a parameter and each row represents a chan-
nel. Have the M-file display the input data along with
the computed velocity in tabular form where velocity is the
fifth column. Include headings on the table to label the
columns.
3.10 A simply supported beam is loaded as shown in
Fig. P3.10. Using singularity functions, the displacement
along the beam can be expressed by the equation:
uy(x) =
−5
6
[x − 04
− x − 54
] +
15
6
x − 83
+ 75x − 72
+
57
6
x3
− 238.25x
PROBLEMS 85
By definition, the singularity function can be expressed as
follows:
x − an
=
(x − a)n
when x a
0 when x ≤ a
Develop an M-file that creates a plot of displacement
(dashed line) versus distance along the beam, x. Note that
x = 0 at the left end of the beam.
3.11 The volume V of liquid in a hollow horizontal cylinder of
radius r and length L is related to the depth of the liquid h by
V = r2
cos−1
r − h
r
− (r − h)
2rh − h2 L
Develop an M-file to create a plot of volume versus depth.
Here are the first few lines:
function cylinder(r, L, plot_title)
% volume of horizontal cylinder
% inputs:
% r = radius
% L = length
% plot_title = string holding plot title
Test your program with
cylinder(3,5,...
'Volume versus depth for horizontal...
cylindrical tank')
3.12 Develop a vectorized version of the following code:
tstart=0; tend=20; ni=8;
t(1)=tstart;
y(1)=12 + 6*cos(2*pi*t(1)/(tend-tstart));
for i=2:ni+1
t(i)=t(i-1)+(tend-tstart)/ni;
y(i)=10 + 5*cos(2*pi*t(i)/ ...
(tend-tstart));
end
20 kips/ft
150 kip-ft
15 kips
5’ 2’ 1’ 2’
FIGURE P3.10](https://image.slidesharecdn.com/appliednumericalmethodswithmatlabforengineersandscientiststhirdedition-230804185537-e8e53c83/85/Applied-Numerical-Methods-With-MATLAB-For-Engineers-And-Scientists-Third-Edition-105-320.jpg)
![3.13 The “divide and average” method, an old-time method
for approximating the square root of any positive number a,
can be formulated as
x =
x + a/x
2
Write a well-structured M-file function based on the
while...break loop structure to implement this algo-
rithm. Use proper indentation so that the structure is clear. At
each step estimate the error in your approximation as
ε =
xnew − xold
xnew
Repeat the loop until ε is less than or equal to a specified
value. Design your program so that it returns both the result
and the error. Make sure that it can evaluate the square root
of numbers that are equal to and less than zero. For the latter
case, display the result as an imaginary number. For exam-
ple, the square root of −4 would return 2i. Test your program
by evaluating a = 0, 2, 10 and −4 for ε = 1 × 10⁻⁴
.
3.14 Piecewise functions are sometimes useful when the re-
lationship between a dependent and an independent variable
cannot be adequately represented by a single equation. For
example, the velocity of a rocket might be described by
v(t) =
⎧
⎪
⎪
⎪
⎪
⎨
⎪
⎪
⎪
⎪
⎩
10t2
− 5t 0 ≤ t ≤ 8
624 − 5t 8 ≤ t ≤ 16
36t + 12(t − 16)2
16 ≤ t ≤ 26
2136e−0.1(t−26)
t 26
0 otherwise
Develop an M-file function to compute v as a function of t.
Then, develop a script that uses this function to generate a
plot of v versus t for t = −5 to 50.
3.15 Develop an M-file function called rounder to round a
number x to a specified number of decimal digits, n. The first
line of the function should be set up as
function xr = rounder(x, n)
Test the program by rounding each of the following to 2 dec-
imal digits: x = 477.9587, −477.9587, 0.125, 0.135, −0.125,
and −0.135.
3.16 Develop an M-file function to determine the elapsed
days in a year. The first line of the function should be set
up as
function nd = days(mo, da, leap)
where mo = the month (1–12), da = the day (1–31), and
leap = (0 for non–leap year and 1 for leap year). Test it for
January 1, 1997, February 29, 2004, March 1, 2001, June 21,
86 PROGRAMMING WITH MATLAB
2004, and December 31, 2008. Hint: A nice way to do this
combines the for and the switch structures.
3.17 Develop an M-file function to determine the elapsed
days in a year. The first line of the function should be set
up as
function nd = days(mo, da, year)
where mo = the month (1–12), da = the day (1–31), and
year = the year. Test it for January 1, 1997, February 29,
2004, March 1, 2001, June 21, 2004, and December 31, 2008.
3.18 Develop a function function M-file that returns the dif-
ference between the passed function’s maximum and mini-
mum value given a range of the independent variable. In
addition, have the function generate a plot of the function for
the range. Test it for the following cases:
(a) f(t) = 8e−0.25t
sin(t − 2) from t = 0 to 6π.
(b) f(x) = e4x
sin(1/x) from x = 0.01 to 0.2.
(c) The built-in humps function from x = 0 to 2.
3.19 Modify the function function odesimp developed at
the end of Sec. 3.6 so that it can be passed the arguments of
the passed function. Test it for the following case:
dvdt=@(v,m,cd) 9.81-(cd/m)*v^2;
odesimp(dvdt,0.5,0,12,-10,70,0.23)
3.20 A Cartesian vector can be thought of as representing
magnitudes along the x-, y-, and z-axes multiplied by a unit
vector (i, j, k). For such cases, the dot product of two of these
vectors {a} and {b} corresponds to the product of their mag-
nitudes and the cosine of the angle between their tails as in
{a}⭈{b} = ab cos
The cross product yields another vector, {c} ⫽ {a} ⫻ {b},
which is perpendicular to the plane defined by {a} and {b}
such that its direction is specified by the right-hand rule.
Develop an M-file function that is passed two such vectors
and returns , {c} and the magnitude of {c}, and generates a
three-dimensional plot of the three vectors {a}, {b}, and {c)
with their origins at zero. Use dashed lines for {a} and {b}
and a solid line for {c}. Test your function for the following
cases:
(a) a = [6 4 2]; b = [2 6 4];
(b) a = [3 2 -6]; b = [4 -3 1];
(c) a = [2 -2 1]; b = [4 2 -4];
(d) a = [-1 0 0]; b = [0 -1 0];
3.21 Based on Example 3.6, develop a script to produce an
animation of a bouncing ball where v0 ⫽ 5 m/s and 0 ⫽ 50⬚.
To do this, you must be able to predict exactly when the ball
hits the ground. At this point, the direction changes (the new
angle will equal the negative of the angle at impact), and the](https://image.slidesharecdn.com/appliednumericalmethodswithmatlabforengineersandscientiststhirdedition-230804185537-e8e53c83/85/Applied-Numerical-Methods-With-MATLAB-For-Engineers-And-Scientists-Third-Edition-106-320.jpg)


![92 ROUNDOFF AND TRUNCATION ERRORS
which can also lead to a negative error. Often, when performing computations, we may not
be concerned with the sign of the error but are interested in whether the absolute value of the
percent relative error is lower than a prespecified tolerance εs. Therefore, it is often useful
to employ the absolute value of Eq. (4.5). For such cases, the computation is repeated until
|εa| εs (4.6)
This relationship is referred to as a stopping criterion. If it is satisfied, our result is assumed
to be within the prespecified acceptable level εs. Note that for the remainder of this text, we
almost always employ absolute values when using relative errors.
It is also convenient to relate these errors to the number of significant figures in the ap-
proximation. It can be shown (Scarborough, 1966) that if the following criterion is met, we
can be assured that the result is correct to at least n significant figures.
εs = (0.5 × 10²−n
)% (4.7)
EXAMPLE 4.1 Error Estimates for Iterative Methods
Problem Statement. In mathematics, functions can often be represented by infinite se-
ries. For example, the exponential function can be computed using
ex
= 1 + x +
x2
2
+
x3
3!
+ · · · +
xn
n!
(E4.1.1)
Thus, as more terms are added in sequence, the approximation becomes a better and better
estimate of the true value of ex
. Equation (E4.1.1) is called a Maclaurin series expansion.
Starting with the simplest version, ex
= 1, add terms one at a time in order to estimate
e0.5
.After each new term is added, compute the true and approximate percent relative errors
with Eqs. (4.3) and (4.5), respectively. Note that the true value is e0.5
= 1.648721 . . . . Add
terms until the absolute value of the approximate error estimate εa falls below a prespeci-
fied error criterion εs conforming to three significant figures.
Solution. First, Eq. (4.7) can be employed to determine the error criterion that ensures a
result that is correct to at least three significant figures:
εs = (0.5 × 10²−3
)% = 0.05%
Thus, we will add terms to the series until εa falls below this level.
The first estimate is simply equal to Eq. (E4.1.1) with a single term. Thus, the first
estimate is equal to 1. The second estimate is then generated by adding the second term
as in
ex
= 1 + x
or for x = 0.5
e0.5
= 1 + 0.5 = 1.5
This represents a true percent relative error of [Eq. (4.3)]
εt =
1.648721 − 1.5
1.648721
× 100% = 9.02%](https://image.slidesharecdn.com/appliednumericalmethodswithmatlabforengineersandscientiststhirdedition-230804185537-e8e53c83/85/Applied-Numerical-Methods-With-MATLAB-For-Engineers-And-Scientists-Third-Edition-112-320.jpg)

![94 ROUNDOFF AND TRUNCATION ERRORS
The function then initializes three variables: (a) iter, which keeps track of the number
of iterations, (b) sol, which holds the current estimate of the solution, and (c) a variable,
ea,which holds the approximate percent relative error. Note that ea is initially set to a value
of 100 to ensure that the loop executes at least once.
These initializations are followed by a decision loop that actually implements the
iterative calculation. Prior to generating a new solution, the previous value, sol, is first as-
signed to solold. Then a new value of sol is computed and the iteration counter is in-
cremented. If the new value of sol is nonzero, the percent relative error, ea, is deter-
mined. The stopping criteria are then tested. If both are false, the loop repeats. If either is
true, the loop terminates and the final solution is sent back to the function call.
When the M-file is implemented, it generates an estimate for the exponential function
which is returned along with the approximate error and the number of iterations. For
example, e1
can be evaluated as
format long
[approxval, ea, iter] = IterMeth(1,1e-6,100)
FIGURE 4.2
An M-file to solve an iterative calculation. This example is set up to evaluate the Maclaurin series
expansion for ex
as described in Example 4.1.
function [fx,ea,iter] = IterMeth(x,es,maxit)
% Maclaurin series of exponential function
% [fx,ea,iter] = IterMeth(x,es,maxit)
% input:
% x = value at which series evaluated
% es = stopping criterion (default = 0.0001)
% maxit = maximum iterations (default = 50)
% output:
% fx = estimated value
% ea = approximate relative error (%)
% iter = number of iterations
% defaults:
if nargin2|isempty(es),es=0.0001;end
if nargin3|isempty(maxit),maxit=50;end
% initialization
iter = 1; sol = 1; ea = 100;
% iterative calculation
while (1)
solold = sol;
sol = sol + x ^ iter / factorial(iter);
iter = iter + 1;
if sol~=0
ea=abs((sol - solold)/sol)*100;
end
if ea=es | iter=maxit,break,end
end
fx = sol;
end](https://image.slidesharecdn.com/appliednumericalmethodswithmatlabforengineersandscientiststhirdedition-230804185537-e8e53c83/85/Applied-Numerical-Methods-With-MATLAB-For-Engineers-And-Scientists-Third-Edition-114-320.jpg)


![102 ROUNDOFF AND TRUNCATION ERRORS
the zero added to the end of the mantissa is not significant but is merely appended to fill the
empty space created by the shift. Even more dramatic results would be obtained when the
numbers are very close as in
0.7642 × 10³
−0.7641 × 10³
0.0001 × 10³
which would be converted to 0.1000 × 100
= 0.1000. Thus, for this case, three nonsignif-
icant zeros are appended.
The subtracting of two nearly equal numbers is called subtractive cancellation. It is
the classic example of how the manner in which computers handle mathematics can lead to
numerical problems. Other calculations that can cause problems include:
Large Computations. Certain methods require extremely large numbers of arithmetic
manipulations to arrive at their final results. In addition, these computations are often inter-
dependent. That is, the later calculations are dependent on the results of earlier ones. Con-
sequently, even though an individual roundoff error could be small, the cumulative effect
over the course of a large computation can be significant. A very simple case involves sum-
ming a round base-10 number that is not round in base-2. Suppose that the following M-file
is constructed:
function sout = sumdemo()
s = 0;
for i = 1:10000
s = s + 0.0001;
end
sout = s;
When this function is executed, the result is
format long
sumdemo
ans =
0.99999999999991
The format long command lets us see the 15 significant-digit representation used
by MATLAB. You would expect that sum would be equal to 1. However, although
0.0001 is a nice round number in base-10, it cannot be expressed exactly in base-2. Thus,
the sum comes out to be slightly different than 1. We should note that MATLAB has fea-
tures that are designed to minimize such errors. For example, suppose that you form a
vector as in
format long
s = [0:0.0001:1];
For this case, rather than being equal to 0.99999999999991, the last entry will be exactly
one as verified by
s(10001)
ans =
1](https://image.slidesharecdn.com/appliednumericalmethodswithmatlabforengineersandscientiststhirdedition-230804185537-e8e53c83/85/Applied-Numerical-Methods-With-MATLAB-For-Engineers-And-Scientists-Third-Edition-122-320.jpg)
![Adding a Large and a Small Number. Suppose we add a small number, 0.0010, to a
large number, 4000, using a hypothetical computer with the 4-digit mantissa and the 1-digit
exponent. After modifying the smaller number so that its exponent matches the larger,
0.4000 × 10⁴
0.0000001 × 10⁴
0.4000001 × 10⁴
which is chopped to 0.4000 × 10⁴
. Thus, we might as well have not performed the addi-
tion! This type of error can occur in the computation of an infinite series. The initial terms
in such series are often relatively large in comparison with the later terms. Thus, after a few
terms have been added, we are in the situation of adding a small quantity to a large quan-
tity. One way to mitigate this type of error is to sum the series in reverse order. In this way,
each new term will be of comparable magnitude to the accumulated sum.
Smearing. Smearing occurs whenever the individual terms in a summation are larger
than the summation itself. One case where this occurs is in a series of mixed signs.
Inner Products. As should be clear from the last sections, some infinite series are partic-
ularly prone to roundoff error. Fortunately, the calculation of series is not one of the more
common operations in numerical methods. A far more ubiquitous manipulation is the cal-
culation of inner products as in
n
i=1
xi yi = x1 y1 + x2 y2 + · · · + xn yn
This operation is very common, particularly in the solution of simultaneous linear algebraic
equations. Such summations are prone to roundofferror. Consequently, it is often desirable to
compute such summations in double precision as is done automatically in MATLAB.
4.3 TRUNCATION ERRORS
Truncation errors are those that result from using an approximation in place of an exact
mathematical procedure. For example, in Chap. 1 we approximated the derivative of veloc-
ity of a bungee jumper by a finite-difference equation of the form [Eq. (1.11)]
dv
dt
∼
=
v
t
=
v(ti+1) − v(ti )
ti+1 − ti
(4.8)
A truncation error was introduced into the numerical solution because the difference equa-
tion only approximates the true value of the derivative (recall Fig. 1.3). To gain insight into
the properties of such errors, we now turn to a mathematical formulation that is used widely
in numerical methods to express functions in an approximate fashion—the Taylor series.
4.3.1 The Taylor Series
Taylor’s theorem and its associated formula, the Taylor series, is of great value in the study
of numerical methods. In essence, the Taylor theorem states that any smooth function can
be approximated as a polynomial. The Taylor series then provides a means to express this
idea mathematically in a form that can be used to generate practical results.
4.3 TRUNCATION ERRORS 103](https://image.slidesharecdn.com/appliednumericalmethodswithmatlabforengineersandscientiststhirdedition-230804185537-e8e53c83/85/Applied-Numerical-Methods-With-MATLAB-For-Engineers-And-Scientists-Third-Edition-123-320.jpg)


![EXAMPLE 4.3 Approximation of a Function with a Taylor Series Expansion
Problem Statement. Use Taylor series expansions with n = 0 to 6 to approximate
f (x) = cos x at xi+1 = π/3 on the basis of the value of f (x) and its derivatives at
xi = π/4. Note that this means that h = π/3 − π/4 = π/12.
Solution. Our knowledge of the true function allows us to determine the correct value
f (π/3) = 0.5. The zero-order approximation is [Eq. (4.9)]
f
π
3
∼
= cos
π
4
= 0.707106781
which represents a percent relative error of
εt =
0.5 − 0.707106781
0.5
100% = 41.4%
For the first-order approximation, we add the first derivative term where f ′
(x) = −sin x:
f
π
3
∼
= cos
π
4
− sin
π
4
π
12
= 0.521986659
which has |εt | = 4.40%. For the second-order approximation, we add the second deriva-
tive term where f ′′
(x) = − cos x:
f
π
3
∼
= cos
π
4
− sin
π
4
π
12
−
cos(π/4)
2
π
12
2
= 0.497754491
with |εt | = 0.449%. Thus, the inclusion of additional terms results in an improved esti-
mate. The process can be continued and the results listed as in
Order n f (n)
(x) f (π/3) |εt|
0 cos x 0.707106781 41.4
1 −sin x 0.521986659 4.40
2 −cos x 0.497754491 0.449
3 sin x 0.499869147 2.62 × 10⁻²
4 cos x 0.500007551 1.51 × 10⁻³
5 −sin x 0.500000304 6.08 × 10⁻⁵
6 −cos x 0.499999988 2.44 × 10⁻⁶
Notice that the derivatives never go to zero as would be the case for a polynomial.
Therefore, each additional term results in some improvement in the estimate. However,
also notice how most of the improvement comes with the initial terms. For this case, by the
time we have added the third-order term, the error is reduced to 0.026%, which means that
we have attained 99.974% of the true value. Consequently, although the addition of more
terms will reduce the error further, the improvement becomes negligible.
4.3 TRUNCATION ERRORS 107](https://image.slidesharecdn.com/appliednumericalmethodswithmatlabforengineersandscientiststhirdedition-230804185537-e8e53c83/85/Applied-Numerical-Methods-With-MATLAB-For-Engineers-And-Scientists-Third-Edition-127-320.jpg)
![108 ROUNDOFF AND TRUNCATION ERRORS
4.3.2 The Remainder for the Taylor Series Expansion
Before demonstrating how the Taylor series is actually used to estimate numerical errors,
we must explain why we included the argument ξ in Eq. (4.14). To do this, we will use a
simple, visually based explanation.
Suppose that we truncated the Taylor series expansion [Eq. (4.13)] after the zero-order
term to yield
f (xi+1) ∼
= f (xi )
A visual depiction of this zero-order prediction is shown in Fig. 4.8. The remainder, or
error, of this prediction, which is also shown in the illustration, consists of the infinite
series of terms that were truncated
R0 = f ′
(xi )h +
f ′′
(xi )
2!
h2
+
f (3)
(xi )
3!
h3
+ · · ·
It is obviously inconvenient to deal with the remainder in this infinite series format. One
simplification might be to truncate the remainder itself, as in
R0
∼
= f ′
(xi )h (4.15)
Although, as stated in the previous section, lower-order derivatives usually account for a
greater share of the remainder than the higher-order terms, this result is still inexact be-
cause of the neglected second- and higher-order terms. This “inexactness” is implied by the
approximate equality symbol (∼
=) employed in Eq. (4.15).
An alternative simplification that transforms the approximation into an equivalence is
based on a graphical insight. As in Fig. 4.9, the derivative mean-value theorem states that
if a function f(x) and its first derivative are continuous over an interval from xi to xi+1, then
FIGURE 4.8
Graphical depiction of a zero-order Taylor series prediction and remainder.
Zero-order prediction
Exact prediction
f (x)
xi xi + 1 x
h
f(xi)
R0](https://image.slidesharecdn.com/appliednumericalmethodswithmatlabforengineersandscientiststhirdedition-230804185537-e8e53c83/85/Applied-Numerical-Methods-With-MATLAB-For-Engineers-And-Scientists-Third-Edition-128-320.jpg)

![110 ROUNDOFF AND TRUNCATION ERRORS
numerical methods. In fact, we have already done so in our example of the bungee jumper.
Recall that the objective of both Examples 1.1 and 1.2 was to predict velocity as a function
of time. That is, we were interested in determining v(t). As specified by Eq. (4.13), v(t)
can be expanded in a Taylor series:
v(ti+1) = v(ti ) + v′
(ti )(ti+1 − ti ) +
v′′
(ti )
2!
(ti+1 − ti )2
+ · · · + Rn
Now let us truncate the series after the first derivative term:
v(ti+1) = v(ti ) + v′
(ti )(ti+1 − ti ) + R1 (4.18)
Equation (4.18) can be solved for
v′
(ti ) =
v(ti+1) − v(ti )
ti+1 − ti
First order
approximation
−
R1
ti+1 − ti
Truncation
error
(4.19)
The first part of Eq. (4.19) is exactly the same relationship that was used to approximate
the derivative in Example 1.2 [Eq. (1.11)]. However, because of the Taylor series approach,
we have now obtained an estimate of the truncation error associated with this approxima-
tion of the derivative. Using Eqs. (4.14) and (4.19) yields
R1
ti+1 − ti
=
v′′
(ξ)
2!
(ti+1 − ti )
or
R1
ti+1 − ti
= O(ti+1 − ti )
Thus, the estimate of the derivative [Eq. (1.11) or the first part of Eq. (4.19)] has a trunca-
tion error of order ti+1 − ti . In other words, the error of our derivative approximation
should be proportional to the step size. Consequently, if we halve the step size, we would
expect to halve the error of the derivative.
4.3.4 Numerical Differentiation
Equation (4.19) is given a formal label in numerical methods—it is called a finite differ-
ence. It can be represented generally as
f ′
(xi ) =
f (xi+1) − f (xi )
xi+1 − xi
+ O(xi+1 − xi ) (4.20)
or
f ′
(xi ) =
f (xi+1) − f (xi )
h
+ O(h) (4.21)
where h is called the step size—that is, the length of the interval over which the approxi-
mation is made, xi+1 − xi . It is termed a “forward” difference because it utilizes data at i
and i + 1 to estimate the derivative (Fig. 4.10a).](https://image.slidesharecdn.com/appliednumericalmethodswithmatlabforengineersandscientiststhirdedition-230804185537-e8e53c83/85/Applied-Numerical-Methods-With-MATLAB-For-Engineers-And-Scientists-Third-Edition-130-320.jpg)


![4.3 TRUNCATION ERRORS 113
EXAMPLE 4.4 Finite-Difference Approximations of Derivatives
Problem Statement. Use forward and backward difference approximations of O(h) and
a centered difference approximation of O(h2
) to estimate the first derivative of
f (x) = −0.1x4
− 0.15x3
− 0.5x2
− 0.25x + 1.2
at x = 0.5 using a step size h = 0.5. Repeat the computation using h = 0.25. Note that the
derivative can be calculated directly as
f ′
(x) = −0.4x3
− 0.45x2
− 1.0x − 0.25
and can be used to compute the true value as f ′
(0.5) = −0.9125.
Solution. For h = 0.5, the function can be employed to determine
xi−1 = 0 f (xi−1) = 1.2
xi = 0.5 f (xi ) = 0.925
xi+1 = 1.0 f (xi+1) = 0.2
These values can be used to compute the forward difference [Eq. (4.21)],
f ′
(0.5) ∼
=
0.2 − 0.925
0.5
= −1.45 |εt | = 58.9%
the backward difference [Eq. (4.23)],
f ′
(0.5) ∼
=
0.925 − 1.2
0.5
= −0.55 |εt | = 39.7%
and the centered difference [Eq. (4.25)],
f ′
(0.5) ∼
=
0.2 − 1.2
1.0
= −1.0 |εt | = 9.6%
For h = 0.25,
xi−1 = 0.25 f (xi−1) = 1.10351563
xi = 0.5 f (xi ) = 0.925
xi+1 = 0.75 f (xi+1) = 0.63632813
which can be used to compute the forward difference,
f ′
(0.5) ∼
=
0.63632813 − 0.925
0.25
= −1.155 |εt | = 26.5%
the backward difference,
f ′
(0.5) ∼
=
0.925 − 1.10351563
0.25
= −0.714 |εt | = 21.7%
and the centered difference,
f ′
(0.5) ∼
=
0.63632813 − 1.10351563
0.5
= −0.934 |εt | = 2.4%](https://image.slidesharecdn.com/appliednumericalmethodswithmatlabforengineersandscientiststhirdedition-230804185537-e8e53c83/85/Applied-Numerical-Methods-With-MATLAB-For-Engineers-And-Scientists-Third-Edition-133-320.jpg)
![114 ROUNDOFF AND TRUNCATION ERRORS
For both step sizes, the centered difference approximation is more accurate than for-
ward or backward differences. Also, as predicted by the Taylor series analysis, halving the
step size approximately halves the error of the backward and forward differences and quar-
ters the error of the centered difference.
Finite-Difference Approximations of Higher Derivatives. Besides first derivatives, the
Taylor series expansion can be used to derive numerical estimates of higher derivatives. To
do this, we write a forward Taylor series expansion for f (xi+2) in terms of f (xi ):
f (xi+2) = f (xi ) + f ′
(xi )(2h) +
f ′′
(xi )
2!
(2h)2
+ · · · (4.26)
Equation (4.24) can be multiplied by 2 and subtracted from Eq. (4.26) to give
f (xi+2) − 2 f (xi+1) = − f (xi ) + f ′′
(xi )h2
+ · · ·
which can be solved for
f ′′
(xi ) =
f (xi+2) − 2 f (xi+1) + f (xi )
h2
+ O(h) (4.27)
This relationship is called the second forward finite difference. Similar manipulations can
be employed to derive a backward version
f ′′
(xi ) =
f (xi ) − 2 f (xi−1) + f (xi−2)
h2
+ O(h)
A centered difference approximation for the second derivative can be derived by
adding Eqs. (4.22) and (4.24) and rearranging the result to give
f ′′
(xi ) =
f (xi+1) − 2 f (xi ) + f (xi−1)
h2
+ O(h2
)
As was the case with the first-derivative approximations, the centered case is more accurate.
Notice also that the centered version can be alternatively expressed as
f ′′
(xi ) ∼
=
f (xi+1) − f (xi )
h
−
f (xi ) − f (xi−1)
h
h
Thus, just as the second derivative is a derivative of a derivative, the second finite differ-
ence approximation is a difference of two first finite differences [recall Eq. (4.12)].
4.4 TOTAL NUMERICAL ERROR
The total numerical error is the summation of the truncation and roundoff errors. In general,
the only way to minimize roundoff errors is to increase the number of significant figures
of the computer. Further, we have noted that roundoff error may increase due to subtractive
cancellation or due to an increase in the number of computations in an analysis. In contrast,
Example 4.4 demonstrated that the truncation error can be reduced by decreasing the step
size. Because a decrease in step size can lead to subtractive cancellation or to an increase in
computations, the truncation errors are decreased as the roundoff errors are increased.](https://image.slidesharecdn.com/appliednumericalmethodswithmatlabforengineersandscientiststhirdedition-230804185537-e8e53c83/85/Applied-Numerical-Methods-With-MATLAB-For-Engineers-And-Scientists-Third-Edition-134-320.jpg)


![4.4 TOTAL NUMERICAL ERROR 117
for i=2:n
h=h/10;
H(i)=h;
D(i)=(func(x+h)-func(x-h))/(2*h);
E(i)=abs(dftrue-D(i));
end
L=[H' D' E']';
fprintf(' step size finite difference true errorn');
fprintf('%14.10f %16.14f %16.13fn',L);
loglog(H,E),xlabel('Step Size'),ylabel('Error')
title('Plot of Error Versus Step Size')
format short
The M-file can then be run using the following commands:
ff=@(x) -0.1*x^4-0.15*x^3-0.5*x^2-0.25*x+1.2;
df=@(x) -0.4*x^3-0.45*x^2-x-0.25;
diffex(ff,df,0.5,11)
step size finite difference true error
1.0000000000 -1.26250000000000 0.3500000000000
0.1000000000 -0.91600000000000 0.0035000000000
0.0100000000 -0.91253500000000 0.0000350000000
0.0010000000 -0.91250035000001 0.0000003500000
0.0001000000 -0.91250000349985 0.0000000034998
0.0000100000 -0.91250000003318 0.0000000000332
0.0000010000 -0.91250000000542 0.0000000000054
0.0000001000 -0.91249999945031 0.0000000005497
0.0000000100 -0.91250000333609 0.0000000033361
0.0000000010 -0.91250001998944 0.0000000199894
0.0000000001 -0.91250007550059 0.0000000755006
As depicted in Fig. 4.12, the results are as expected. At first, roundoff is minimal and the
estimate is dominated by truncation error. Hence, as in Eq. (4.29), the total error drops by a fac-
tor of 100 each time we divide the step by 10. However, starting at about h = 0.0001, we see
roundoff error begin to creep in and erode the rate at which the error diminishes. A minimum
error is reached at h = 10–6
. Beyond this point, the error increases as roundoff dominates.
Because we are dealing with an easily differentiable function, we can also investigate
whether these results are consistent with Eq. (4.30). First, we can estimate M by evaluating
the function’s third derivative as
M =
f (3)
(0.5)
= |−2.4(0.5) − 0.9| = 2.1
Because MATLAB has a precision of about 15 to 16 base-10 digits, a rough estimate of the
upper bound on roundoff would be about ε = 0.5 × 10⁻¹⁶
. Substituting these values into
Eq. (4.30) gives
hopt =
3 3(0.5 × 10⁻¹⁶
)
2.1
= 4.3 × 10⁻⁶
which is on the same order as the result of 1 × 10⁻⁶
obtained with MATLAB.](https://image.slidesharecdn.com/appliednumericalmethodswithmatlabforengineersandscientiststhirdedition-230804185537-e8e53c83/85/Applied-Numerical-Methods-With-MATLAB-For-Engineers-And-Scientists-Third-Edition-137-320.jpg)


![PROBLEMS 121
MATLAB. Base your algorithm on the notion that your com-
puter will be unable to reliably distinguish between zero and
a quantity that is smaller than this number. Note that the
result you obtain will differ from the value computed with
realmin. Challenge question: Investigate the results by
taking the base-2 logarithm of the number generated by your
code and those obtained with realmin.
4.6 Although it is not commonly used, MATLAB allows
numbers to be expressed in single precision. Each value
is stored in 4 bytes with 1 bit for the sign, 23 bits for the
mantissa, and 8 bits for the signed exponent. Determine the
smallest and largest positive floating-point numbers as well
as the machine epsilon for single precision representation.
Note that the exponents range from −126 to 127.
4.7 For the hypothetical base-10 computer in Example 4.2,
prove that the machine epsilon is 0.05.
4.8 The derivative of f(x) = 1/(1 − 3x2
) is given by
6x
(1 − 3x2)2
Do you expect to have difficulties evaluating this function
at x = 0.577? Try it using 3- and 4-digit arithmetic with
chopping.
4.9 (a) Evaluate the polynomial
y = x3
− 7x2
+ 8x − 0.35
at x = 1.37. Use 3-digit arithmetic with chopping. Evaluate
the percent relative error.
(b) Repeat (a) but express y as
y = ((x − 7)x + 8)x − 0.35
Evaluate the error and compare with part (a).
4.10 The following infinite series can be used to approxi-
mate ex
:
ex
= 1 + x +
x2
2
+
x3
3!
+ · · · +
xn
n!
(a) Prove that this Maclaurin series expansion is a special
case of the Taylor series expansion (Eq. 4.13) with xi =
0 and h = x.
(b) Use the Taylor series to estimate f(x) = e−x
at xi+1 = 1
for xi = 0.25. Employ the zero-, first-, second-, and
third-order versions and compute the |εt | for each case.
4.11 The Maclaurin series expansion for cos x is
cos x = 1 −
x2
2
+
x4
4!
−
x6
6!
+
x8
8!
− · · ·
Starting with the simplest version, cos x = 1, add terms one
at a time to estimate cos(π/4). After each new term is added,
compute the true and approximate percent relative errors.
Use your pocket calculator or MATLAB to determine the
true value. Add terms until the absolute value of the approx-
imate error estimate falls below an error criterion conform-
ing to two significant figures.
4.12 Perform the same computation as in Prob. 4.11, but
use the Maclaurin series expansion for the sin x to estimate
sin(π/4).
sin x = x −
x3
3!
+
x5
5!
−
x7
7!
+ · · ·
4.13 Use zero- through third-order Taylor series expansions
to predict f(3) for
f (x) = 25x3
− 6x2
+ 7x − 88
using a base point at x = 1. Compute the true percent relative
error εt for each approximation.
4.14 Prove that Eq. (4.11) is exact for all values of x if f(x) =
ax2
+ bx + c.
4.15 Use zero- through fourth-order Taylor series expansions
to predict f(2) for f(x) = ln x using a base point at x = 1.
Compute the true percent relative error εt for each approxi-
mation. Discuss the meaning of the results.
4.16 Use forward and backward difference approximations
of O(h) and a centered difference approximation of O(h2
) to
estimate the first derivative of the function examined in
Prob. 4.13. Evaluate the derivative at x = 2 using a step size
of h = 0.25. Compare your results with the true value of the
derivative. Interpret your results on the basis of the remain-
der term of the Taylor series expansion.
4.17 Use a centered difference approximation of O(h2
) to
estimate the second derivative of the function examined in
Prob. 4.13. Perform the evaluation at x = 2 using step sizes
of h = 0.2 and 0.1. Compare your estimates with the true
value of the second derivative. Interpret your results on the
basis of the remainder term of the Taylor series expansion.
4.18 If |x| 1 it is known that
1
1 − x
= 1 + x + x2
+ x3
+ · · ·
Repeat Prob. 4.11 for this series for x = 0.1.
4.19 To calculate a planet’s space coordinates, we have to
solve the function
f (x) = x − 1 − 0.5 sin x
Let the base point be a = xi = π/2 on the interval [0, π].
Determine the highest-order Taylor series expansion result-
ing in a maximum error of 0.015 on the specified interval.
The error is equal to the absolute value of the difference
between the given function and the specific Taylor series
expansion. (Hint: Solve graphically.)](https://image.slidesharecdn.com/appliednumericalmethodswithmatlabforengineersandscientiststhirdedition-230804185537-e8e53c83/85/Applied-Numerical-Methods-With-MATLAB-For-Engineers-And-Scientists-Third-Edition-141-320.jpg)
![122 ROUNDOFF AND TRUNCATION ERRORS
4.20 Consider the function f(x) = x3
− 2x + 4 on the inter-
val [−2, 2] with h = 0.25. Use the forward, backward, and
centered finite difference approximations for the first and
second derivatives so as to graphically illustrate which ap-
proximation is most accurate. Graph all three first-derivative
finite difference approximations along with the theoretical,
and do the same for the second derivative as well.
4.21 Derive Eq. (4.30).
4.22 Repeat Example 4.5, but for f(x) = cos(x) at x = π/6.
4.23 Repeat Example 4.5, but for the forward divided dif-
ference (Eq. 4.21).
4.24 One common instance where subtractive cancellation
occurs involves finding the roots of a parabola, ax2
⫹ bx ⫹ c,
with the quadratic formula:
x =
−b ±
√
b2 − 4ac
2a
For cases where b2
⬎⬎ 4ac, the difference in the numerator
can be very small and roundoff errors can occur. In such
cases, an alternative formulation can be used to minimize
subtractive cancellation:
x =
−2c
b ±
√
b2 − 4ac
Use 5-digit arithmetic with chopping to determine the roots
of the following equation with both versions of the quadratic
formula.
x2
− 5000.002x + 10](https://image.slidesharecdn.com/appliednumericalmethodswithmatlabforengineersandscientiststhirdedition-230804185537-e8e53c83/85/Applied-Numerical-Methods-With-MATLAB-For-Engineers-And-Scientists-Third-Edition-142-320.jpg)


![function xb = incsearch(func,xmin,xmax,ns)
% incsearch: incremental search root locator
% xb = incsearch(func,xmin,xmax,ns):
% finds brackets of x that contain sign changes
% of a function on an interval
% input:
% func = name of function
% xmin, xmax = endpoints of interval
% ns = number of subintervals (default = 50)
% output:
% xb(k,1) is the lower bound of the kth sign change
% xb(k,2) is the upper bound of the kth sign change
% If no brackets found, xb = [].
if nargin 3, error('at least 3 arguments required'), end
if nargin 4, ns = 50; end %if ns blank set to 50
% Incremental search
x = linspace(xmin,xmax,ns);
f = func(x);
nb = 0; xb = []; %xb is null unless sign change detected
for k = 1:length(x)-1
if sign(f(k)) ~= sign(f(k+1)) %check for sign change
nb = nb + 1;
xb(nb,1) = x(k);
xb(nb,2) = x(k+1);
end
end
if isempty(xb) %display that no brackets were found
disp('no brackets found')
disp('check interval or increase ns')
else
disp('number of brackets:') %display number of brackets
disp(nb)
end
FIGURE 5.4
An M-file to implement an incremental search.
x6
x0 x1 x2 x3 x4 x5
f (x)
x
FIGURE 5.3
Cases where roots could be missed because the incremental length of the search procedure is
too large. Note that the last root on the right is multiple and would be missed regardless of the
increment length.
132](https://image.slidesharecdn.com/appliednumericalmethodswithmatlabforengineersandscientiststhirdedition-230804185537-e8e53c83/85/Applied-Numerical-Methods-With-MATLAB-For-Engineers-And-Scientists-Third-Edition-152-320.jpg)
![EXAMPLE 5.2 Incremental Search
Problem Statement. Use the M-file incsearch (Fig. 5.4) to identify brackets within the
interval [3, 6] for the function:
f (x) = sin(10x) + cos(3x) (5.4)
Solution. The MATLAB session using the default number of intervals (50) is
incsearch(@(x) sin(10*x)+cos(3*x),3,6)
number of brackets:
5
ans =
3.2449 3.3061
3.3061 3.3673
3.7347 3.7959
4.6531 4.7143
5.6327 5.6939
A plot of Eq. (5.4) along with the root locations is shown here.
Although five sign changes are detected, because the subintervals are too wide, the func-
tion misses possible roots at x ∼
= 4.25 and 5.2. These possible roots look like they might be
double roots. However, by using the zoom in tool, it is clear that each represents two real
roots that are very close together. The function can be run again with more subintervals
with the result that all nine sign changes are located
incsearch(@(x) sin(10*x)+cos(3*x),3,6,100)
number of brackets:
9
ans =
3.2424 3.2727
3.3636 3.3939
3.7273 3.7576
3
⫺2
⫺1
0
1
2
3.5 4 4.5 5 5.5 6
5.3 BRACKETING METHODS AND INITIAL GUESSES 133](https://image.slidesharecdn.com/appliednumericalmethodswithmatlabforengineersandscientiststhirdedition-230804185537-e8e53c83/85/Applied-Numerical-Methods-With-MATLAB-For-Engineers-And-Scientists-Third-Edition-153-320.jpg)


![At this point, the new interval extends from xl = 125 to xu = 200. A revised root esti-
mate can then be calculated as
xr =
125 + 200
2
= 162.5
which represents a true percent error of |εt | = 13.85%. The process can be repeated to ob-
tain refined estimates. For example,
f (125) f (162.5) = −0.409(0.359) = −0.147
Therefore, the root is now in the lower interval between 125 and 162.5. The upper bound
is redefined as 162.5, and the root estimate for the third iteration is calculated as
xr =
125 + 162.5
2
= 143.75
which represents a percent relative error of εt = 0.709%. The method can be repeated until
the result is accurate enough to satisfy your needs.
We ended Example 5.3 with the statement that the method could be continued to obtain
a refined estimate of the root. We must now develop an objective criterion for deciding when
to terminate the method.
An initial suggestion might be to end the calculation when the error falls below some
prespecified level. For instance, in Example 5.3, the true relative error dropped from 12.43
to 0.709% during the course of the computation. We might decide that we should terminate
when the error drops below, say, 0.5%. This strategy is flawed because the error estimates
in the example were based on knowledge of the true root of the function. This would not be
the case in an actual situation because there would be no point in using the method if we
already knew the root.
Therefore, we require an error estimate that is not contingent on foreknowledge of the
root. One way to do this is by estimating an approximate percent relative error as in [recall
Eq. (4.5)]
|εa| =
xnew
r − xold
r
xnew
r
100% (5.5)
where xnew
r is the root for the present iteration and xold
r is the root from the previous itera-
tion. When εa becomes less than a prespecified stopping criterion εs, the computation is
terminated.
EXAMPLE 5.4 Error Estimates for Bisection
Problem Statement. Continue Example 5.3 until the approximate error falls below a
stopping criterion of εs = 0.5%. Use Eq. (5.5) to compute the errors.
Solution. The results of the first two iterations for Example 5.3 were 125 and 162.5. Sub-
stituting these values into Eq. (5.5) yields
|εa| =
162.5 − 125
162.5
100% = 23.08%
136 ROOTS: BRACKETING METHODS](https://image.slidesharecdn.com/appliednumericalmethodswithmatlabforengineersandscientiststhirdedition-230804185537-e8e53c83/85/Applied-Numerical-Methods-With-MATLAB-For-Engineers-And-Scientists-Third-Edition-156-320.jpg)


![Thus, if we knew beforehand that an error of less than 0.5859 was acceptable, the formula
tells us that eight iterations would yield the desired result.
Although we have emphasized the use of relative errors for obvious reasons, there will
be cases where (usually through knowledge of the problem context) you will be able to
specify an absolute error. For these cases, bisection along with Eq. (5.6) can provide a use-
ful root-location algorithm.
5.4.1 MATLAB M-file: bisect
An M-file to implement bisection is displayed in Fig. 5.7. It is passed the function (func)
along with lower (xl) and upper (xu) guesses. In addition, an optional stopping criterion (es)
5.4 BISECTION 139
function [root,fx,ea,iter]=bisect(func,xl,xu,es,maxit,varargin)
% bisect: root location zeroes
% [root,fx,ea,iter]=bisect(func,xl,xu,es,maxit,p1,p2,...):
% uses bisection method to find the root of func
% input:
% func = name of function
% xl, xu = lower and upper guesses
% es = desired relative error (default = 0.0001%)
% maxit = maximum allowable iterations (default = 50)
% p1,p2,... = additional parameters used by func
% output:
% root = real root
% fx = function value at root
% ea = approximate relative error (%)
% iter = number of iterations
if nargin3,error('at least 3 input arguments required'),end
test = func(xl,varargin{:})*func(xu,varargin{:});
if test0,error('no sign change'),end
if nargin4|isempty(es), es=0.0001;end
if nargin5|isempty(maxit), maxit=50;end
iter = 0; xr = xl; ea = 100;
while (1)
xrold = xr;
xr = (xl + xu)/2;
iter = iter + 1;
if xr ~= 0,ea = abs((xr - xrold)/xr) * 100;end
test = func(xl,varargin{:})*func(xr,varargin{:});
if test 0
xu = xr;
elseif test 0
xl = xr;
else
ea = 0;
end
if ea = es | iter = maxit,break,end
end
root = xr; fx = func(xr, varargin{:});
FIGURE 5.7
An M-file to implement the bisection method.](https://image.slidesharecdn.com/appliednumericalmethodswithmatlabforengineersandscientiststhirdedition-230804185537-e8e53c83/85/Applied-Numerical-Methods-With-MATLAB-For-Engineers-And-Scientists-Third-Edition-159-320.jpg)
![and maximum iterations (maxit) can be entered. The function first checks whether there
are sufficient arguments and if the initial guesses bracket a sign change. If not, an error
message is displayed and the function is terminated. It also assigns default values if maxit
and es are not supplied. Then a while...break loop is employed to implement the
bisection algorithm until the approximate error falls below es or the iterations exceed
maxit.
We can employ this function to solve the problem posed at the beginning of the chapter.
Recall that you need to determine the mass at which a bungee jumper’s free-fall velocity
exceeds 36 m/s after 4 s of free fall given a drag coefficient of 0.25 kg/m. Thus, you have to
find the root of
f (m) =
9.81m
0.25
tanh
9.81(0.25)
m
4
− 36
In Example 5.1 we generated a plot of this function versus mass and estimated that the root
fell between 140 and 150 kg. The bisect function from Fig. 5.7 can be used to determine
the root as
fm=@(m) sqrt(9.81*m/0.25)*tanh(sqrt(9.81*0.25/m)*4)-36;
[mass fx ea iter]=bisect(fm,40,200)
mass =
142.74
fx =
4.6089e-007
ea =
5.345e-005
iter =
21
Thus, a result of m = 142.74 kg is obtained after 21 iterations with an approximate relative
error of εa = 0.00005345%, and a function value close to zero.
5.5 FALSE POSITION
False position (also called the linear interpolation method) is another well-known bracket-
ing method. It is very similar to bisection with the exception that it uses a different strategy
to come up with its new root estimate. Rather than bisecting the interval, it locates the root
by joining f (xl) and f (xu) with a straight line (Fig. 5.8). The intersection of this line with
the x axis represents an improved estimate of the root. Thus, the shape of the function in-
fluences the new root estimate. Using similar triangles, the intersection of the straight line
with the x axis can be estimated as (see Chapra and Canale, 2010, for details),
xr = xu −
f (xu)(xl − xu)
f (xl) − f (xu)
(5.7)
This is the false-position formula. The value of xr computed with Eq. (5.7) then re-
places whichever of the two initial guesses, xl or xu, yields a function value with the same
140 ROOTS: BRACKETING METHODS](https://image.slidesharecdn.com/appliednumericalmethodswithmatlabforengineersandscientiststhirdedition-230804185537-e8e53c83/85/Applied-Numerical-Methods-With-MATLAB-For-Engineers-And-Scientists-Third-Edition-160-320.jpg)


![144 ROOTS: BRACKETING METHODS
310
330
350
370
1950 1960 1970 1980 1990 2000 2010
pCO2
(ppm)
5.6 CASE STUDY GREENHOUSE GASES AND RAINWATER
Background. It is well documented that the atmospheric levels of several so-called
“greenhouse” gases have been increasing over the past 50 years. For example, Fig. 5.10
shows data for the partial pressure of carbon dioxide (CO2) collected at Mauna Loa, Hawaii
from 1958 through 2008. The trend in these data can be nicely fit with a quadratic polyno-
mial,3
pCO2
= 0.012226(t − 1983)2
+ 1.418542(t − 1983) + 342.38309
where pCO2
= CO2 partial pressure (ppm). These data indicate that levels have increased a
little over 22% over the period from 315 to 386 ppm.
One question that we can address is how this trend is affecting the pH of rainwater.
Outside of urban and industrial areas, it is well documented that carbon dioxide is the pri-
mary determinant of the pH of the rain. pH is the measure of the activity of hydrogen ions
and, therefore, its acidity or alkalinity. For dilute aqueous solutions, it can be computed as
pH = −log10[H+
] (5.8)
where [H+
] is the molar concentration of hydrogen ions.
The following five equations govern the chemistry of rainwater:
K1 = 106 [H+
][HCO−
3 ]
KH pCO2
(5.9)
3
In Part Four, we will learn how to determine such polynomials.
FIGURE 5.10
Average annual partial pressures of atmospheric carbon dioxide (ppm) measured at Mauna Loa,
Hawaii.](https://image.slidesharecdn.com/appliednumericalmethodswithmatlabforengineersandscientiststhirdedition-230804185537-e8e53c83/85/Applied-Numerical-Methods-With-MATLAB-For-Engineers-And-Scientists-Third-Edition-164-320.jpg)
![5.6 CASE STUDY 145
K2 =
[H+
][CO−2
3 ]
[HCO−
3 ]
(5.10)
Kw = [H+
][OH−
] (5.11)
cT =
KH pCO2
106
+ [HCO−
3 ] + [CO−2
3 ] (5.12)
0 = [HCO−
3 ] + 2[CO−2
3 ] + [OH−
] − [H+
] (5.13)
where KH = Henry’s constant, and K1, K2, and Kw are equilibrium coefficients. The five
unknowns are cT = total inorganic carbon, [HCO−
3 ] = bicarbonate, [CO−2
3 ] = carbonate,
[H+
] = hydrogen ion, and [OH−
] = hydroxyl ion. Notice how the partial pressure of CO2
shows up in Eqs. (5.9) and (5.12).
Use these equations to compute the pH of rainwater given that KH =
10−1.46
, K1 = 10−6.3
, K2 = 10−10.3
, and Kw = 10−14
. Compare the results in 1958 when
the pCO2
was 315 and in 2008 when it was 386 ppm. When selecting a numerical method
for your computation, consider the following:
• You know with certainty that the pH of rain in pristine areas always falls between 2
and 12.
• You also know that pH can only be measured to two places of decimal precision.
Solution. There are a variety of ways to solve this system of five equations. One way
is to eliminate unknowns by combining them to produce a single function that only de-
pends on [H+
]. To do this, first solve Eqs. (5.9) and (5.10) for
[HCO−
3 ] =
K1
106
[H+
]
KH pCO2 (5.14)
[CO−2
3 ] =
K2[HCO−
3 ]
[H+
]
(5.15)
Substitute Eq. (5.14) into (5.15)
[CO−2
3 ] =
K2 K1
106
[H+
]2
KH pCO2 (5.16)
Equations (5.14) and (5.16) can be substituted along with Eq. (5.11) into Eq. (5.13) to give
0 =
K1
106
[H+
]
KH pCO2
+ 2
K2 K1
106
[H+
]2
KH pCO2
+
Kw
[H+
]
− [H+
] (5.17)
Although it might not be immediately apparent, this result is a third-order polynomial in
[H+
]. Thus, its root can be used to compute the pH of the rainwater.
Now we must decide which numerical method to employ to obtain the solution. There
are two reasons why bisection would be a good choice. First, the fact that the pH always
falls within the range from 2 to 12, provides us with two good initial guesses. Second, be-
cause the pH can only be measured to two decimal places of precision, we will be satisfied
5.6 CASE STUDY continued](https://image.slidesharecdn.com/appliednumericalmethodswithmatlabforengineersandscientiststhirdedition-230804185537-e8e53c83/85/Applied-Numerical-Methods-With-MATLAB-For-Engineers-And-Scientists-Third-Edition-165-320.jpg)
![146 ROOTS: BRACKETING METHODS
5.6 CASE STUDY continued
with an absolute error of Ea,d = ±0.005. Remember that given an initial bracket and the
desired error, we can compute the number of iteration a priori. Substituting the present val-
ues into Eq. (5.6) gives
dx=12-2;
Ead=0.005;
n=log2(dx/Ead)
n =
10.9658
Eleven iterations of bisection will produce the desired precision.
Before implementing bisection, we must first express Eq. (5.17) as a function. Be-
cause it is relatively complicated, we will store it as an M-file:
function f = fpH(pH,pCO2)
K1=10^-6.3;K2=10^-10.3;Kw=10^-14;
KH=10^-1.46;
H=10^-pH;
f=K1/(1e6*H)*KH*pCO2+2*K2*K1/(1e6*H)*KH*pCO2+Kw/H-H;
We can then use the M-file from Fig. 5.7 to obtain the solution. Notice how we have
set the value of the desired relative error (εa = 1 × 10⁻⁸
) at a very low level so that the it-
eration limit (maxit) is reached first so that exactly 11 iterations are implemented
[pH1958 fx ea iter]=bisect(@fpH,2,12,1e-8,11,315)
pH1958 =
5.6279
fx =
-2.7163e-008
ea =
0.08676
iter =
11
Thus, the pH is computed as 5.6279 with a relative error of 0.0868%. We can be confident
that the rounded result of 5.63 is correct to two decimal places. This can be verified by per-
forming another run with more iterations. For example, setting maxit to 50 yields
[pH1958 fx ea iter] = bisect(@fpH,2,12,1e-8,50,315)
pH1958 =
5.6304
fx =
1.615e-015
ea =
5.169e-009
iter =
35
For 2008, the result is
[pH2008 ea iter]=bisect(@fpH,2,12,1e-8,50,386)](https://image.slidesharecdn.com/appliednumericalmethodswithmatlabforengineersandscientiststhirdedition-230804185537-e8e53c83/85/Applied-Numerical-Methods-With-MATLAB-For-Engineers-And-Scientists-Third-Edition-166-320.jpg)
![PROBLEMS 147
CASE STUDY 5.6 continued
5.6 CASE STUDY continued
PROBLEMS
5.1 Use bisection to determine the drag coefficient needed
so that an 80-kg bungee jumper has a velocity of 36 m/s after
4 s of free fall. Note: The acceleration of gravity is 9.81 m/s2
.
Start with initial guesses of xl = 0.1 and xu = 0.2 and iter-
ate until the approximate relative error falls below 2%.
5.2 Develop your own M-file for bisection in a similar fashion
to Fig. 5.7. However, rather than using the maximum iterations
and Eq. (5.5), employ Eq. (5.6) as your stopping criterion. Make
sure to round the result of Eq. (5.6) up to the next highest integer.
Test your function by solving Prob. 5.1 using Ea,d = 0.0001.
5.3 Repeat Prob. 5.1, but use the false-position method to
obtain your solution.
5.4 Develop an M-file for the false-position method. Test it
by solving Prob. 5.1.
5.5 (a) Determine the roots of f (x) = −12 − 21x +
18x2
− 2.75x3
graphically. In addition, determine the first
root of the function with (b) bisection and (c) false position.
For (b) and (c) use initial guesses of xl = −1 and xu = 0
and a stopping criterion of 1%.
5.6 Locate the first nontrivial root of sin(x) = x2
where x is
in radians. Use a graphical technique and bisection with the
initial interval from 0.5 to 1. Perform the computation until
εa is less than εs = 2%.
5.7 Determine the positive real root of ln(x2
) = 0.7 (a)
graphically, (b) using three iterations of the bisection
method, with initial guesses of xl = 0.5 and xu = 2, and
(c) using three iterations of the false-position method, with
the same initial guesses as in (b).
pH2008 =
5.5864
fx =
3.2926e-015
ea =
5.2098e-009
iter =
35
Interestingly, the results indicate that the 22.5% rise in atmospheric CO2 levels has
produced only a 0.78% drop in pH. Although this is certainly true, remember that the pH
represents a logarithmic scale as defined by Eq. (5.8). Consequently, a unit drop in pH rep-
resents an order-of-magnitude (i.e., a 10-fold) increase in the hydrogen ion. The concen-
tration can be computed as [H+
] = 10−pH
and its percent change can be calculated as.
((10^-pH2008-10^-pH1958)/10^-pH1958)*100
ans =
10.6791
Therefore, the hydrogen ion concentration has increased about 10.7%.
There is quite a lot of controversy related to the meaning of the greenhouse gas trends.
Most of this debate focuses on whether the increases are contributing to global warming.
However, regardless of the ultimate implications, it is sobering to realize that something as
large as our atmosphere has changed so much over a relatively short time period. This case
study illustrates how numerical methods and MATLAB can be employed to analyze and in-
terpret such trends. Over the coming years, engineers and scientists can hopefully use such
tools to gain increased understanding of such phenomena and help rationalize the debate
over their ramifications.](https://image.slidesharecdn.com/appliednumericalmethodswithmatlabforengineersandscientiststhirdedition-230804185537-e8e53c83/85/Applied-Numerical-Methods-With-MATLAB-For-Engineers-And-Scientists-Third-Edition-167-320.jpg)
![148 ROOTS: BRACKETING METHODS
5.8 The saturation concentration of dissolved oxygen in
freshwater can be calculated with the equation
ln osf = −139.34411 +
1.575701 × 10⁵
Ta
−
6.642308 × 10⁷
T2
a
+
1.243800 × 10¹⁰
T3
a
−
8.621949 × 10¹¹
T4
a
where osf = the saturation concentration of dissolved oxy-
gen in freshwater at 1 atm (mg L−1
); and Ta = absolute
temperature (K). Remember that Ta = T + 273.15, where
T = temperature (°C).According to this equation, saturation
decreases with increasing temperature. For typical natural
waters in temperate climates, the equation can be used to de-
termine that oxygen concentration ranges from 14.621 mg/L
at 0 °C to 6.949 mg/L at 35 °C. Given a value of oxygen con-
centration, this formula and the bisection method can be
used to solve for temperature in °C.
(a) If the initial guesses are set as 0 and 35 °C, how many
bisection iterations would be required to determine tem-
perature to an absolute error of 0.05 °C?
(b) Based on (a), develop and test a bisection M-file function
to determine T as a function of a given oxygen concen-
tration. Test your function for osf = 8, 10 and 14 mg/L.
Check your results.
5.9 A beam is loaded as shown in Fig. P5.9. Use the bisec-
tion method to solve for the position inside the beam where
there is no moment.
5.10 Water is flowing in a trapezoidal channel at a rate of
Q = 20 m3
/s. The critical depth y for such a channel must
satisfy the equation
0 = 1 −
Q2
gA3
c
B
where g = 9.81 m/s2
, Ac = the cross-sectional area (m2
),
and B = the width of the channel at the surface (m). For this
case, the width and the cross-sectional area can be related to
depth y by
B = 3 + y
and
Ac = 3y +
y2
2
Solve for the critical depth using (a) the graphical method,
(b) bisection, and (c) false position. For (b) and (c) use
initial guesses of xl = 0.5 and xu = 2.5, and iterate until the
approximate error falls below 1% or the number of iterations
exceeds 10. Discuss your results.
5.11 The Michaelis-Menten model describes the kinetics of
enzyme mediated reactions:
dS
dt
= −vm
S
ks + S
where S = substrate concentration (moles/L), vm = maxi-
mum uptake rate (moles/L/d), and ks = the half-saturation
constant, which is the substrate level at which uptake is half
of the maximum [moles/L]. If the initial substrate level at
t = 0 is S0, this differential equation can be solved for
S = S0 − vmt + ks ln(S0/S)
Develop an M-file to generate a plot of S versus t for the
case where S0 = 8 moles/L, vm = 0.7 moles/L/d, and
ks = 2.5 moles/L.
5.12 A reversible chemical reaction
2A + B
→
←
C
can be characterized by the equilibrium relationship
K =
cc
c2
acb
where the nomenclature ci represents the concentration of con-
stituent i. Suppose that we define a variable x as representing
the number of moles of C that are produced. Conservation of
mass can be used to reformulate the equilibrium relationship as
K =
(cc,0 + x)
(ca,0 − 2x)2(cb,0 − x)
where the subscript 0 designates the initial concentration
of each constituent. If K = 0.016, ca,0 = 42, cb,0 = 28, and
cc,0 = 4, determine the value of x.
(a) Obtain the solution graphically.
(b) On the basis of (a), solve for the root with initial guesses of
xl = 0 and xu = 20 to εs = 0.5%. Choose either bisection or
false position to obtain your solution. Justify your choice.
5.13 Figure P5.13a shows a uniform beam subject to a lin-
early increasing distributed load. The equation for the result-
ing elastic curve is (see Fig. P5.13b)
y =
w0
120E I L
(−x5
+ 2L2
x3
− L4
x) (P5.13)
Use bisection to determine the point of maximum deflection
(i.e., the value of x where dy/dx = 0). Then substitute this
value into Eq. (P5.13) to determine the value of the maximum
deflection. Use the following parameter values in your
3’ 3’ 2’
4’
100 lb
100 lb/ft
FIGURE P5.9](https://image.slidesharecdn.com/appliednumericalmethodswithmatlabforengineersandscientiststhirdedition-230804185537-e8e53c83/85/Applied-Numerical-Methods-With-MATLAB-For-Engineers-And-Scientists-Third-Edition-168-320.jpg)
![PROBLEMS 149
computation: L = 600 cm, E = 50,000 kN/cm2
, I =
30,000 cm4
, and w0 = 2.5 kN/cm.
5.14 You buy a $35,000 vehicle for nothing down at $8,500
per year for 7 years. Use the bisect function from Fig. 5.7
to determine the interest rate that you are paying. Employ
initial guesses for the interest rate of 0.01 and 0.3 and a stop-
ping criterion of 0.00005. The formula relating present
worth P, annual payments A, number of years n, and interest
rate i is
A = P
i(1 + i)n
(1 + i)n − 1
5.15 Many fields of engineering require accurate population
estimates. For example, transportation engineers might find
it necessary to determine separately the population growth
trends of a city and adjacent suburb. The population of the
urban area is declining with time according to
Pu(t) = Pu,maxe−ku t
+ Pu,min
while the suburban population is growing, as in
Ps(t) =
Ps,max
1 + [Ps,max/P0 − 1]e−ks t
where Pu,max, ku, Ps,max, P0, and ks = empirically derived pa-
rameters. Determine the time and corresponding values of
Pu(t) and Ps(t) when the suburbs are 20% larger than the city.
The parameter values are Pu,max = 80,000, ku = 0.05/yr,
Pu,min = 110,000 people, Ps,max = 320,000 people, P0 =
10,000 people, and ks = 0.09/yr. To obtain your solutions,
use (a) graphical, and (b) false-position methods.
5.16 The resistivity ρ of doped silicon is based on the
charge q on an electron, the electron density n, and the elec-
tron mobility μ. The electron density is given in terms of
the doping density N and the intrinsic carrier density ni. The
electron mobility is described by the temperature T, the ref-
erence temperature T0, and the reference mobility μ0. The
equations required to compute the resistivity are
ρ =
1
qnμ
where
n =
1
2
N +
N2 + 4n2
i
and μ = μ0
T
T0
−2.42
Determine N, given T0 = 300 K, T = 1000 K, μ0 =
1360 cm2
(V s)−1
, q = 1.7 × 10⁻¹⁹
C, ni = 6.21 × 10⁹
cm−3
,
and a desired ρ = 6.5 × 10⁶
V s cm/C. Employ initial
guesses of N = 0 and 2.5 × 10¹⁰
. Use (a) bisection and
(b) the false position method.
5.17 Atotal charge Q is uniformly distributed around a ring-
shaped conductor with radius a. A charge q is located at a
distance x from the center of the ring (Fig. P5.17). The force
exerted on the charge by the ring is given by
F =
1
4πe0
qQx
(x2 + a2)3/2
where e0 = 8.9 × 10⁻¹²
C2
/(N m2
). Find the distance x where
the force is 1.25 N if q and Q are 2 × 10⁻⁵
C for a ring with a
radius of 0.85 m.
5.18 For fluid flow in pipes, friction is described by a di-
mensionless number, the Fanning friction factor f. The Fan-
ning friction factor is dependent on a number of parameters
related to the size of the pipe and the fluid, which can
all be represented by another dimensionless quantity, the
Reynolds number Re. A formula that predicts f given Re is
the von Karman equation:
1
√
f
= 4 log10 Re f − 0.4
Typical values for the Reynolds number for turbulent flow
are 10,000 to 500,000 and for the Fanning friction factor are
0.001 to 0.01. Develop a function that uses bisection to solve
for f given a user-supplied value of Re between 2,500 and
w0
L
(a)
(x = 0, y = 0)
(x = L, y = 0)
x
(b)
FIGURE P5.13
FIGURE P5.17
x
a
Q
q](https://image.slidesharecdn.com/appliednumericalmethodswithmatlabforengineersandscientiststhirdedition-230804185537-e8e53c83/85/Applied-Numerical-Methods-With-MATLAB-For-Engineers-And-Scientists-Third-Edition-169-320.jpg)
![150 ROOTS: BRACKETING METHODS
1,000,000. Design the function so that it ensures that the ab-
solute error in the result is Ea,d 0.000005.
5.19 Mechanical engineers, as well as most other engineers,
use thermodynamics extensively in their work. The following
polynomial can be used to relate the zero-pressure specific
heat of dry air cp kJ/(kg K) to temperature (K):
cp = 0.99403 + 1.671 × 10⁻⁴
T + 9.7215 × 10⁻⁸
T2
−9.5838 × 10⁻¹¹
T3
+ 1.9520 × 10⁻¹⁴
T4
Develop a plot of cp versus a range of T = 0 to 1200 K, and
then use bisection to determine the temperature that corre-
sponds to a specific heat of 1.1 kJ/(kg K).
5.20 The upward velocity of a rocket can be computed by
the following formula:
v = u ln
m0
m0 − qt
− gt
where v = upward velocity, u = the velocity at which fuel is
expelled relative to the rocket, m0 = the initial mass of the
rocket at time t = 0, q = the fuel consumption rate, and g = the
downward acceleration of gravity (assumed constant =
9.81 m/s2
). If u = 1800 m/s, m0 = 160,000 kg, and q =
2600 kg/s, compute the time at which v = 750 m/s. (Hint: t
is somewhere between 10 and 50 s.) Determine your result so
that it is within 1% of the true value. Check your answer.
5.21 Although we did not mention it in Sec. 5.6, Eq. (5.13) is
an expression of electroneutrality—that is, that positive and
negative charges must balance. This can be seen more clearly
by expressing it as
[H+
] = [HCO−
3 ] + 2[CO2−
3 ] + [OH−
]
In other words, the positive charges must equal the negative
charges. Thus, when you compute the pH of a natural water
body such as a lake, you must also account for other ions that
may be present. For the case where these ions originate from
nonreactive salts, the net negative minus positive charges due
to these ions are lumped together in a quantity called alkalin-
ity, and the equation is reformulated as
Alk + [H+
] = [HCO−
3 ] + 2[CO2−
3 ] + [OH−
] (P5.21)
where Alk = alkalinity (eq/L). For example, the alkalinity of
Lake Superior is approximately 0.4 × 10⁻³
eq/L. Perform the
same calculations as in Sec. 5.6 to compute the pH of Lake
Superior in 2008.Assume that just like the raindrops, the lake
is in equilibrium with atmospheric CO2 but account for the
alkalinity as in Eq. (P5.21).
5.22 According to Archimedes’ principle, the buoyancy force
is equal to the weight of fluid displaced by the submerged
portion of the object. For the sphere depicted in Fig. P5.22,
use bisection to determine the height, h, of the portion that is
above water. Employ the following values for your computa-
tion: r = 1 m, ρs = density of sphere = 200 kg/m3
, and ρw =
density of water = 1,000 kg/m3
. Note that the volume of the
above-water portion of the sphere can be computed with
V =
πh2
3
(3r − h)
5.23 Perform the same computation as in Prob. 5.22, but for
the frustrum of a cone as depicted in Fig. P5.23. Employ the
following values for your computation: r1 = 0.5 m, r2 = 1 m,
h = 1 m, ρf = frustrum density = 200 kg/m3
, and ρw = water
density = 1,000 kg/m3
. Note that the volume of a frustrum is
given by
V =
πh
3
(r2
1 + r2
2 + r1r2)
h
r
FIGURE P5.22
h1
h
r2
r1
FIGURE P5.23](https://image.slidesharecdn.com/appliednumericalmethodswithmatlabforengineersandscientiststhirdedition-230804185537-e8e53c83/85/Applied-Numerical-Methods-With-MATLAB-For-Engineers-And-Scientists-Third-Edition-170-320.jpg)


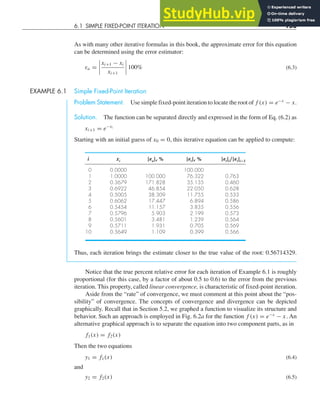
![can be plotted separately (Fig. 6.2b). The x values corresponding to the intersections of
these functions represent the roots of f (x) = 0.
The two-curve method can now be used to illustrate the convergence and divergence
of fixed-point iteration. First, Eq. (6.1) can be reexpressed as a pair of equations y1 = x
and y2 = g(x). These two equations can then be plotted separately. As was the case with
Eqs. (6.4) and (6.5), the roots of f (x) = 0 correspond to the abscissa value at the intersec-
tion of the two curves. The function y1 = x and four different shapes for y2 = g(x) are
plotted in Fig. 6.3.
For the first case (Fig. 6.3a), the initial guess of x0 is used to determine the corresponding
point on the y2 curve [x0, g(x0)]. The point [x1, x1] is located by moving left horizontally to
the y1 curve. These movements are equivalent to the first iteration of the fixed-point method:
x1 = g(x0)
Thus, in both the equation and in the plot, a starting value of x0 is used to obtain an esti-
mate of x1. The next iteration consists of moving to [x1, g(x1)] and then to [x2, x2]. This
154 ROOTS: OPEN METHODS
f(x)
f(x)
x
x
Root
Root
f (x) ⫽ e⫺ x
⫺ x
f 1(x) ⫽ x
f 2(x) ⫽ e⫺ x
(a)
(b)
FIGURE 6.2
Two alternative graphical methods for determining the root of f (x) = e−x
− x. (a) Root at the
point where it crosses the x axis; (b) root at the intersection of the component functions.](https://image.slidesharecdn.com/appliednumericalmethodswithmatlabforengineersandscientiststhirdedition-230804185537-e8e53c83/85/Applied-Numerical-Methods-With-MATLAB-For-Engineers-And-Scientists-Third-Edition-174-320.jpg)

![Consequently, if |g′
| 1, the errors decrease with each iteration. For |g′
| 1 the errors
grow. Notice also that if the derivative is positive, the errors will be positive, and hence the
errors will have the same sign (Fig. 6.3a and c). If the derivative is negative, the errors will
change sign on each iteration (Fig. 6.3b and d).
6.2 NEWTON-RAPHSON
Perhaps the most widely used of all root-locating formulas is the Newton-Raphson method
(Fig. 6.4). If the initial guess at the root is xi , a tangent can be extended from the point
[xi , f (xi )]. The point where this tangent crosses the x axis usually represents an improved
estimate of the root.
The Newton-Raphson method can be derived on the basis of this geometrical inter-
pretation. As in Fig. 6.4, the first derivative at x is equivalent to the slope:
f ′
(xi ) =
f (xi ) − 0
xi − xi+1
which can be rearranged to yield
xi+1 = xi −
f (xi )
f ′(xi )
(6.6)
which is called the Newton-Raphson formula.
EXAMPLE 6.2 Newton-Raphson Method
Problem Statement. Use the Newton-Raphson method to estimate the root of f (x) =
e−x
− x employing an initial guess of x0 = 0.
Solution. The first derivative of the function can be evaluated as
f ′
(x) = −e−x
− 1
which can be substituted along with the original function into Eq. (6.6) to give
xi+1 = xi −
e−xi
− xi
−e−xi − 1
Starting with an initial guess of x0 = 0, this iterative equation can be applied to compute
i xi |εt|, %
0 0 100
1 0.500000000 11.8
2 0.566311003 0.147
3 0.567143165 0.0000220
4 0.567143290 10−8
Thus, the approach rapidly converges on the true root. Notice that the true percent relative
error at each iteration decreases much faster than it does in simple fixed-point iteration
(compare with Example 6.1).
156 ROOTS: OPEN METHODS](https://image.slidesharecdn.com/appliednumericalmethodswithmatlabforengineersandscientiststhirdedition-230804185537-e8e53c83/85/Applied-Numerical-Methods-With-MATLAB-For-Engineers-And-Scientists-Third-Edition-176-320.jpg)
![6.2 NEWTON-RAPHSON 157
As with other root-location methods, Eq. (6.3) can be used as a termination criterion.
In addition, a theoretical analysis (Chapra and Canale, 2010) provides insight regarding the
rate of convergence as expressed by
Et,i+1 =
− f ′′
(xr )
2 f ′(xr )
E2
t,i (6.7)
Thus, the error should be roughly proportional to the square of the previous error. In other
words, the number of significant figures of accuracy approximately doubles with each
iteration. This behavior is called quadratic convergence and is one of the major reasons for
the popularity of the method.
Although the Newton-Raphson method is often very efficient, there are situations
where it performs poorly. A special case—multiple roots—is discussed elsewhere (Chapra
and Canale, 2010). However, even when dealing with simple roots, difficulties can also
arise, as in the following example.
EXAMPLE 6.3 A Slowly Converging Function with Newton-Raphson
Problem Statement. Determine the positive root of f(x) = x10
− 1 using the Newton-
Raphson method and an initial guess of x = 0.5.
Solution. The Newton-Raphson formula for this case is
xi+1 = xi −
x10
i − 1
10x9
i
which can be used to compute
f (x)
f (xi)
f(xi) ⫺ 0
Slope ⫽ f'(xi)
0 x
xi⫹1 xi
xi ⫺ xi⫹1
FIGURE 6.4
Graphical depiction of the Newton-Raphson method. A tangent to the function of xi [that is,
f ′
(x)] is extrapolated down to the x axis to provide an estimate of the root at xi+1.](https://image.slidesharecdn.com/appliednumericalmethodswithmatlabforengineersandscientiststhirdedition-230804185537-e8e53c83/85/Applied-Numerical-Methods-With-MATLAB-For-Engineers-And-Scientists-Third-Edition-177-320.jpg)


![160 ROOTS: OPEN METHODS
point (i.e., f ′
(x) = 0) occurs in the vicinity of a root. Notice that iterations beginning at x0
progressively diverge from the root. Fig. 6.6b illustrates the tendency of the Newton-Raphson
technique to oscillate around alocal maximum or minimum. Such oscillations may persist, or,
as in Fig. 6.6b, a near-zero slope is reached whereupon the solution is sent far from the area of
interest. Figure 6.6c shows how an initial guess that is close to one root can jump to a location
several roots away.This tendency to move away from the area of interest is due to the fact that
near-zero slopes are encountered. Obviously, a zero slope [ f ′
(x) = 0] is a real disaster be-
cause it causes division by zero in the Newton-Raphson formula [Eq. (6.6)]. As in Fig. 6.6d,
it means that the solution shoots off horizontally and never hits the x axis.
Thus, there is no general convergence criterion for Newton-Raphson. Its convergence
depends on the nature of the function and on the accuracy of the initial guess. The only
remedy is to have an initial guess that is “sufficiently” close to the root. And for some func-
tions, no guess will work! Good guesses are usually predicated on knowledge of the phys-
ical problem setting or on devices such as graphs that provide insight into the behavior of
the solution. It also suggests that good computer software should be designed to recognize
slow convergence or divergence.
6.2.1 MATLAB M-file: newtraph
An algorithm for the Newton-Raphson method can be easily developed (Fig. 6.7). Note that
the program must have access to the function (func) and its first derivative (dfunc). These
can be simply accomplished by the inclusion of user-defined functions to compute these
quantities. Alternatively, as in the algorithm in Fig. 6.7, they can be passed to the function
as arguments.
After the M-file is entered and saved, it can be invoked to solve for root. For example,
for the simple function x2
− 9, the root can be determined as in
newtraph(@(x) x^2-9,@(x) 2*x,5)
ans =
3
EXAMPLE 6.4 Newton-Raphson Bungee Jumper Problem
Problem Statement. Use the M-file function from Fig. 6.7 to determine the mass of the
bungee jumper with a drag coefficient of 0.25 kg/m to have a velocity of 36 m/s after 4 s of
free fall. The acceleration of gravity is 9.81 m/s2
.
Solution. The function to be evaluated is
f (m) =
gm
cd
tanh
gcd
m
t
− v(t) (E6.4.1)
To apply the Newton-Raphson method, the derivative of this function must be evalu-
ated with respect to the unknown, m:
d f (m)
dm
=
1
2
g
mcd
tanh
gcd
m
t
−
g
2m
t sech2
gcd
m
t
(E6.4.2)](https://image.slidesharecdn.com/appliednumericalmethodswithmatlabforengineersandscientiststhirdedition-230804185537-e8e53c83/85/Applied-Numerical-Methods-With-MATLAB-For-Engineers-And-Scientists-Third-Edition-180-320.jpg)
![6.3 SECANT METHODS 161
We should mention that although this derivative is not difficult to evaluate in principle, it
involves a bit of concentration and effort to arrive at the final result.
The two formulas can now be used in conjunction with the function newtraph to
evaluate the root:
y = @m sqrt(9.81*m/0.25)*tanh(sqrt(9.81*0.25/m)*4)-36;
dy = @m 1/2*sqrt(9.81/(m*0.25))*tanh((9.81*0.25/m) ...
^(1/2)*4)-9.81/(2*m)*sech(sqrt(9.81*0.25/m)*4)^2;
newtraph(y,dy,140,0.00001)
ans =
142.7376
6.3 SECANT METHODS
As in Example 6.4, a potential problem in implementing the Newton-Raphson method is
the evaluation of the derivative. Although this is not inconvenient for polynomials and
many other functions, there are certain functions whose derivatives may be difficult or
FIGURE 6.7
An M-file to implement the Newton-Raphson method.
function [root,ea,iter]=newtraph(func,dfunc,xr,es,maxit,varargin)
% newtraph: Newton-Raphson root location zeroes
% [root,ea,iter]=newtraph(func,dfunc,xr,es,maxit,p1,p2,...):
% uses Newton-Raphson method to find the root of func
% input:
% func = name of function
% dfunc = name of derivative of function
% xr = initial guess
% es = desired relative error (default = 0.0001%)
% maxit = maximum allowable iterations (default = 50)
% p1,p2,... = additional parameters used by function
% output:
% root = real root
% ea = approximate relative error (%)
% iter = number of iterations
if nargin3,error('at least 3 input arguments required'),end
if nargin4|isempty(es),es=0.0001;end
if nargin5|isempty(maxit),maxit=50;end
iter = 0;
while (1)
xrold = xr;
xr = xr - func(xr)/dfunc(xr);
iter = iter + 1;
if xr ~= 0, ea = abs((xr - xrold)/xr) * 100; end
if ea = es | iter = maxit, break, end
end
root = xr;](https://image.slidesharecdn.com/appliednumericalmethodswithmatlabforengineersandscientiststhirdedition-230804185537-e8e53c83/85/Applied-Numerical-Methods-With-MATLAB-For-Engineers-And-Scientists-Third-Edition-181-320.jpg)


![6.4.1 Inverse Quadratic Interpolation
Inverse quadratic interpolation is similar in spirit to the secant method. As in Fig. 6.8a, the
secant method is based on computing a straight line that goes through two guesses. The
intersection of this straight line with the x axis represents the new root estimate. For this
reason, it is sometimes referred to as a linear interpolation method.
Now suppose that we had three points. In that case, we could determine a quadratic
function of x that goes through the three points (Fig. 6.8b). Just as with the linear secant
method, the intersection of this parabola with the x axis would represent the new root esti-
mate. And as illustrated in Fig. 6.8b, using a curve rather than a straight line often yields a
better estimate.
Although this would seem to represent a great improvement, the approach has a fun-
damental flaw: it is possible that the parabola might not intersect the x axis! Such would be
the case when the resulting parabola had complex roots. This is illustrated by the parabola,
y ⫽ f(x), in Fig. 6.9.
The difficulty can be rectified by employing inverse quadratic interpolation. That is,
rather than using a parabola in x, we can fit the points with a parabola in y. This amounts to
reversing the axes and creating a “sideways” parabola [the curve, x ⫽ f(y), in Fig. 6.9].
If the three points are designated as (xi–2, yi–2), (xi–1, yi–1), and (xi, yi), a quadratic
function of y that passes through the points can be generated as
g(y) =
(y − yi−1)(y − yi )
(yi−2 − yi−1)(yi−2 − yi )
xi−2 +
(y − yi−2)(y − yi )
(yi−1 − yi−2)(yi−1 − yi )
xi−1
+
(y − yi−2)(y − yi−1)
(yi − yi−2)(yi − yi−1)
xi (6.10)
164 ROOTS: OPEN METHODS
f(x)
x
(a) (b)
f(x)
x
FIGURE 6.8
Comparison of (a) the secant method and (b) inverse quadratic interpolation. Note that the
approach in (b) is called “inverse” because the quadratic function is written in y rather than in x.](https://image.slidesharecdn.com/appliednumericalmethodswithmatlabforengineersandscientiststhirdedition-230804185537-e8e53c83/85/Applied-Numerical-Methods-With-MATLAB-For-Engineers-And-Scientists-Third-Edition-184-320.jpg)


![criteria are met, the loop is terminated. Otherwise, a decision structure chooses among the
three methods and checks whether the outcome is acceptable. A final section then evaluates
f at the new point and the loop is repeated. Once the stopping criteria are met, the loop
terminates and the final root estimate is returned.
6.5 MATLAB FUNCTION: fzero
The fzero function is designed to find the real root of a single equation. A simple repre-
sentation of its syntax is
fzero(function,x0)
where function is the name of the function being evaluated, and x0 is the initial guess.
Note that two guesses that bracket the root can be passed as a vector:
fzero(function,[x0 x1])
where x0 and x1 are guesses that bracket a sign change.
Here is a simple MATLAB session that solves for the root of a simple quadratic: x2
− 9.
Clearly two roots exist at −3 and 3. To find the negative root:
x = fzero(@(x) x^2-9,-4)
x =
-3
If we want to find the positive root, use a guess that is near it:
x = fzero(@(x) x^2-9,4)
x =
3
If we put in an initial guess of zero, it finds the negative root:
x = fzero(@(x) x^2-9,0)
x =
-3
If we wanted to ensure that we found the positive root, we could enter two guesses as in
x = fzero(@(x) x^2-9,[0 4])
x =
3
Also, if a sign change does not occur between the two guesses, an error message is displayed
x = fzero(@(x) x^2-9,[-4 4])
??? Error using == fzero
The function values at the interval endpoints must ...
differ in sign.
168 ROOTS: OPEN METHODS](https://image.slidesharecdn.com/appliednumericalmethodswithmatlabforengineersandscientiststhirdedition-230804185537-e8e53c83/85/Applied-Numerical-Methods-With-MATLAB-For-Engineers-And-Scientists-Third-Edition-188-320.jpg)
![6.5 MATLAB FUNCTION: fzero 169
The fzero function works as follows. If a single initial guess is passed, it first performs
a search to identify a sign change. This search differs from the incremental search described
in Section 5.3.1, in that the search starts at the single initial guess and then takes increasingly
bigger steps in both the positive and negative directions until a sign change is detected.
Thereafter, the fast methods (secant and inverse quadratic interpolation) are used un-
less an unacceptable result occurs (e.g., the root estimate falls outside the bracket). If an
unacceptable result happens, bisection is implemented until an acceptable root is obtained
with one of the fast methods. As might be expected, bisection typically dominates at first
but as the root is approached, the technique shifts to the faster methods.
A more complete representation of the fzero syntax can be written as
[x,fx] = fzero(function,x0,options,p1,p2,...)
where [x,fx] = a vector containing the root x and the function evaluated at the root fx,
options is a data structure created by the optimset function, and p1, p2... are any
parameters that the function requires. Note that if you desire to pass in parameters but not
use the options, pass an empty vector [] in its place.
The optimset function has the syntax
options = optimset('par1',val1,'par2',val2,...)
where the parameter pari has the value vali. A complete listing of all the possible param-
eters can be obtained by merely entering optimset at the command prompt. The parame-
ters that are commonly used with the fzero function are
display: When set to 'iter' displays a detailed record of all the iterations.
tolx: A positive scalar that sets a termination tolerance on x.
EXAMPLE 6.7 The fzero and optimset Functions
Problem Statement. Recall that in Example 6.3, we found the positive root of f (x) =
x10
− 1 using the Newton-Raphson method with an initial guess of 0.5. Solve the same
problem with optimset and fzero.
Solution. An interactive MATLAB session can be implemented as follows:
options = optimset('display','iter');
[x,fx] = fzero(@(x) x^10-1,0.5,options)
Func-count x f(x) Procedure
1 0.5 -0.999023 initial
2 0.485858 -0.999267 search
3 0.514142 -0.998709 search
4 0.48 -0.999351 search
5 0.52 -0.998554 search
6 0.471716 -0.999454 search
•
•
•
23 0.952548 -0.385007 search
24 -0.14 -1 search
25 1.14 2.70722 search](https://image.slidesharecdn.com/appliednumericalmethodswithmatlabforengineersandscientiststhirdedition-230804185537-e8e53c83/85/Applied-Numerical-Methods-With-MATLAB-For-Engineers-And-Scientists-Third-Edition-189-320.jpg)
![Looking for a zero in the interval [-0.14, 1.14]
26 0.205272 -1 interpolation
27 0.672636 -0.981042 bisection
28 0.906318 -0.626056 bisection
29 1.02316 0.257278 bisection
30 0.989128 -0.103551 interpolation
31 0.998894 -0.0110017 interpolation
32 1.00001 7.68385e-005 interpolation
33 1 -3.83061e-007 interpolation
34 1 -1.3245e-011 interpolation
35 1 0 interpolation
Zero found in the interval: [-0.14, 1.14].
x =
1
fx =
0
Thus, after 25 iterations of searching, fzero finds a sign change. It then uses interpo-
lation and bisection until it gets close enough to the root so that interpolation takes over and
rapidly converges on the root.
Suppose that we would like to use a less stringent tolerance. We can use the optimset
function to set a low maximum tolerance and a less accurate estimate of the root results:
options = optimset ('tolx', 1e-3);
[x,fx] = fzero(@(x) x^10-1,0.5,options)
x =
1.0009
fx =
0.0090
6.6 POLYNOMIALS
Polynomials are a special type of nonlinear algebraic equation of the general form
fn(x) = a1xn
+ a2xn−1
+ · · · + an−1x2
+ an x + an+1 (6.12)
where n is the order of the polynomial, and the a’s are constant coefficients. In many (but
not all) cases, the coefficients will be real. For such cases, the roots can be real and/or com-
plex. In general, an nth order polynomial will have n roots.
Polynomials have many applications in engineering and science. For example,
they are used extensively in curve fitting. However, one of their most interesting and
powerful applications is in characterizing dynamic systems—and, in particular, linear
systems. Examples include reactors, mechanical devices, structures, and electrical
circuits.
170 ROOTS: OPEN METHODS](https://image.slidesharecdn.com/appliednumericalmethodswithmatlabforengineersandscientiststhirdedition-230804185537-e8e53c83/85/Applied-Numerical-Methods-With-MATLAB-For-Engineers-And-Scientists-Third-Edition-190-320.jpg)

![EXAMPLE 6.8 Using MATLAB to Manipulate Polynomials and Determine Their Roots
Problem Statement. Use the following equation to explore how MATLAB can be em-
ployed to manipulate polynomials:
f5(x) = x5
− 3.5x4
+ 2.75x3
+ 2.125x2
− 3.875x + 1.25 (E6.8.1)
Note that this polynomial has three real roots: 0.5, −1.0, and 2; and one pair of complex
roots: 1 ± 0.5i.
Solution. Polynomials are entered into MATLAB by storing the coefficients as a row
vector. For example, entering the following line stores the coefficients in the vector a:
a = [1 -3.5 2.75 2.125 -3.875 1.25];
We can then proceed to manipulate the polynomial. For example we can evaluate it at
x = 1, by typing
polyval(a,1)
with the result, 1(1)5
− 3.5(1)4
+ 2.75(1)3
+ 2.125(1)2
− 3.875(1) + 1.25 = −0.25:
ans =
-0.2500
We can create a quadratic polynomial that has roots corresponding to two of the
original roots of Eq. (E6.8.1): 0.5 and −1. This quadratic is (x − 0.5)(x + 1) = x2
+
0.5x − 0.5. It can be entered into MATLAB as the vector b:
b = [1 .5 -.5]
b =
1.0000 0.5000 -0.5000
Note that the poly function can be used to perform the same task as in
b = poly([0.5 -1])
b =
1.0000 0.5000 -0.5000
We can divide this polynomial into the original polynomial by
[q,r] = deconv(a,b)
with the result being a quotient (a third-order polynomial, q) and a remainder (r)
q =
1.0000 -4.0000 5.2500 -2.5000
r =
0 0 0 0 0 0
Because the polynomial is a perfect divisor, the remainder polynomial has zero coeffi-
cients. Now, the roots of the quotient polynomial can be determined as
x = roots(q)
172 ROOTS: OPEN METHODS](https://image.slidesharecdn.com/appliednumericalmethodswithmatlabforengineersandscientiststhirdedition-230804185537-e8e53c83/85/Applied-Numerical-Methods-With-MATLAB-For-Engineers-And-Scientists-Third-Edition-192-320.jpg)

![174 ROOTS: OPEN METHODS
6.7 CASE STUDY continued
where ε = the roughness (m), D = diameter (m), and Re = the Reynolds number:
Re =
ρVD
µ
where ρ = the fluid’s density (kg/m3
), V = its velocity (m/s), and µ = dynamic viscosity
(N· s/m2
). In addition to appearing in Eq. (6.15), the Reynolds number also serves as the
criterion for whether flow is turbulent (Re ⬎ 4000).
In this case study, we will illustrate how the numerical methods covered in this part of
the book can be employed to determine f for air flow through a smooth, thin tube. For this
case, the parameters are ρ = 1.23 kg/m3
, µ = 1.79 × 10⁻⁵
N · s/m2
, D = 0.005 m, V = 40 m/s
and ε = 0.0015 mm. Note that friction factors range from about 0.008 to 0.08. In addition,
an explicit formulation called the Swamee-Jain equation provides an approximate estimate:
f =
1.325
ln
ε
3.7D
+
5.74
Re0.9
2
(6.16)
Solution. The Reynolds number can be computed as
Re =
ρVD
µ
=
1.23(40)0.005
1.79 × 10−5
= 13,743
This value along with the other parameters can be substituted into Eq. (6.15) to give
g( f ) =
1
√
f
+ 2.0 log
0.0000015
3.7(0.005)
+
2.51
13,743
√
f
Before determining the root, it is advisable to plot the function to estimate initial
guesses and to anticipate possible difficulties. This can be done easily with MATLAB:
rho=1.23;mu=1.79e-5;D=0.005;V=40;e=0.0015/1000;
Re=rho*V*D/mu;
g=@(f) 1/sqrt(f)+2*log10(e/(3.7*D)+2.51/(Re*sqrt(f)));
fplot(g,[0.008 0.08]),grid,xlabel('f'),ylabel('g(f)')
As in Fig. 6.11, the root is located at about 0.03.
Because we are supplied initial guesses (xl = 0.008 and xu = 0.08), either of the brack-
eting methods from Chap. 5 could be used. For example, the bisect function developed
in Fig. 5.7 gives a value of f = 0.0289678 with a percent relative error of error of 5.926 ×
10–5
in 22 iterations. False position yields a result of similar precision in 26 iterations.
Thus, although they produce the correct result, they are somewhat inefficient. This would
not be important for a single application, but could become prohibitive if many evaluations
were made.](https://image.slidesharecdn.com/appliednumericalmethodswithmatlabforengineersandscientiststhirdedition-230804185537-e8e53c83/85/Applied-Numerical-Methods-With-MATLAB-For-Engineers-And-Scientists-Third-Edition-194-320.jpg)
![6.7 CASE STUDY 175
6.7 CASE STUDY continued
We could try to attain improved performance by turning to an open method. Because
Eq. (6.15) is relatively straightforward to differentiate, the Newton-Raphson method is a
good candidate. For example, using an initial guess at the lower end of the range (x0 =
0.008), the newtraph function developed in Fig. 6.7 converges quickly:
dg=@(f) -2/log(10)*1.255/Re*f^(-3/2)/(e/D/3.7 ...
+2.51/Re/sqrt(f))-0.5/f^(3/2);
[f ea iter]=newtraph(g,dg,0.008)
f =
0.02896781017144
ea =
6.870124190058040e-006
iter =
6
However, when the initial guess is set at the upper end of the range (x0 = 0.08), the routine
diverges,
[f ea iter]=newtraph(g,dg,0.08)
f =
NaN + NaNi
As can be seen by inspecting Fig. 6.11, this occurs because the function’s slope at the initial
guess causes the first iteration to jump to a negative value. Further runs demonstrate that
for this case, convergence only occurs when the initial guess is below about 0.066.
–3
0.02
0.01 0.03 0.04 0.05 0.06 0.07 0.08
–2
–1
0
1
2
3
4
5
6
g
(
f
)
f
FIGURE 6.11](https://image.slidesharecdn.com/appliednumericalmethodswithmatlabforengineersandscientiststhirdedition-230804185537-e8e53c83/85/Applied-Numerical-Methods-With-MATLAB-For-Engineers-And-Scientists-Third-Edition-195-320.jpg)
![176 ROOTS: OPEN METHODS
6.7 CASE STUDY continued
So we can see that although the Newton-Raphson is very efficient, it requires good
initial guesses. For the Colebrook equation, a good strategy might be to employ the
Swamee-Jain equation (Eq. 6.16) to provide the initial guess as in
fSJ=1.325/log(e/(3.7*D)+5.74/Re^0.9)^2
fSJ =
0.02903099711265
[f ea iter]=newtraph(g,dg,fSJ)
f =
0.02896781017144
ea =
8.510189472800060e-010
iter =
3
Aside from our homemade functions, we can also use MATLAB’s built-in fzero
function. However, just as with the Newton-Raphson method, divergence also occurs when
fzero function is used with a single guess. However, in this case, guesses at the lower end
of the range cause problems. For example,
fzero(g,0.008)
Exiting fzero: aborting search for an interval containing a sign
change because complex function value encountered ...
during search.
(Function value at -0.0028 is -4.92028-20.2423i.)
Check function or try again with a different starting value.
ans =
NaN
If the iterations are displayed using optimset (recall Example 6.7), it is revealed that a
negative value occurs during the search phase before a sign change is detected and the rou-
tine aborts. However, for single initial guesses above about 0.016, the routine works nicely.
For example, for the guess of 0.08 that caused problems for Newton-Raphson, fzero does
just fine:
fzero(g,0.08)
ans =
0.02896781017144
As a final note, let’s see whether convergence is possible for simple fixed-point itera-
tion. The easiest and most straightforward version involves solving for the first f in
Eq. (6.15):
fi+1 =
0.25
log
ε
3.7D
+
2.51
Re
√
fi
2 (6.17)](https://image.slidesharecdn.com/appliednumericalmethodswithmatlabforengineersandscientiststhirdedition-230804185537-e8e53c83/85/Applied-Numerical-Methods-With-MATLAB-For-Engineers-And-Scientists-Third-Edition-196-320.jpg)


![PROBLEMS 179
where R = the universal gas constant [= 0.518 kJ/(kg K)],
T = absolute temperature (K), p = absolute pressure (kPa),
and v = the volume of a kg of gas (m3
/kg). The parameters
a and b are calculated by
a = 0.427
R2
T2.5
c
pc
b = 0.0866R
Tc
pc
where pc = 4600 kPa and Tc = 191 K. As a chemical engi-
neer, you are asked to determine the amount of methane fuel
that can be held in a 3-m3
tank at a temperature of −40 ◦
C
with a pressure of 65,000 kPa. Use a root-locating method of
your choice to calculate v and then determine the mass of
methane contained in the tank.
6.16 The volume of liquid V in a hollow horizontal cylinder
of radius r and length L is related to the depth of the liquid h by
V = r2
cos−1
r − h
r
− (r − h)
2rh − h2
L
Determine h given r = 2 m, L = 5 m3
, and V = 8 m3
.
6.17 A catenary cable is one which is hung between two
points not in the same vertical line. As depicted in
Fig. P6.17a, it is subject to no loads other than its own
weight. Thus, its weight acts as a uniform load per unit
length along the cable w (N/m). A free-body diagram of a
section AB is depicted in Fig. P6.17b, where TA and TB are
the tension forces at the end. Based on horizontal and verti-
cal force balances, the following differential equation model
of the cable can be derived:
d2
y
dx2
=
w
TA
1 +
dy
dx
2
(a) (b)
W ⫽ ws
y
A
B
w
x
y0
TA
TB
FIGURE P6.17
R L C
FIGURE P6.19
Calculus can be employed to solve this equation for the
height of the cable y as a function of distance x:
y =
TA
w
cosh
w
TA
x
+ y0 −
TA
w
(a) Use a numerical method to calculate a value for the
parameter TA given values for the parameters w = 10
and y0 = 5, such that the cable has a height of y = 15 at
x = 50.
(b) Develop a plot of y versus x for x = −50 to 100.
6.18 An oscillating current in an electric circuit is described
by I = 9e−t
sin(2πt), where t is in seconds. Determine all
values of t such that I = 3.5
6.19 Figure P6.19 shows a circuit with a resistor, an induc-
tor, and a capacitor in parallel. Kirchhoff’s rules can be used
to express the impedance of the system as
1
Z
=
1
R2
+
ωC −
1
ωL
2
where Z = impedance (), and ω is the angular frequency. Find
the ω that results in an impedance of 100 using the fzero
function with initial guesses of 1 and 1000 for the following pa-
rameters: R = 225 , C = 0.6 × 10⁻⁶
F, and L = 0.5 H.](https://image.slidesharecdn.com/appliednumericalmethodswithmatlabforengineersandscientiststhirdedition-230804185537-e8e53c83/85/Applied-Numerical-Methods-With-MATLAB-For-Engineers-And-Scientists-Third-Edition-199-320.jpg)
![180 ROOTS: OPEN METHODS
v0
y
x
0
FIGURE P6.21
h
V
R
FIGURE P6.22
6.20 Real mechanical systems may involve the deflection
of nonlinear springs. In Fig. P6.20, a block of mass m is
released a distance h above a nonlinear spring. The resis-
tance force F of the spring is given by
F = −(k1d + k2d3/2
)
Conservation of energy can be used to show that
0 =
2k2d5/2
5
+
1
2
k1d2
− mgd − mgh
Solve for d, given the following parameter values: k1 =
40,000 g/s2
, k2 = 40 g/(s2
m5
), m = 95 g, g = 9.81 m/s2
,
and h = 0.43 m.
6.21 Aerospace engineers sometimes compute the trajec-
tories of projectiles such as rockets. A related problem deals
with the trajectory of a thrown ball. The trajectory of a ball
thrown by a right fielder is defined by the (x, y) coordinates
as displayed in Fig. P6.21. The trajectory can be modeled as
y = (tan θ0)x −
g
2v2
0 cos2 θ0
x2
+ y0
Find the appropriate initial angle θ0, if v0 = 30 m/s, and the
distance to the catcher is 90 m. Note that the throw leaves the
right fielder’s hand at an elevation of 1.8 m and the catcher
receives it at 1 m.
6.22 You are designing a spherical tank (Fig. P6.22) to hold
water for a small village in a developing country. The vol-
ume of liquid it can hold can be computed as
V = πh2 [3R − h]
3
where V = volume [m3
], h = depth of water in tank [m], and
R = the tank radius [m].
h
(a) (b)
d
h ⫹ d
FIGURE P6.20
If R = 3 m, what depth must the tank be filled to so that
it holds 30 m3
? Use three iterations of the most efficient
numerical method possible to determine your answer. Deter-
mine the approximate relative error after each iteration.
Also, provide justification for your choice of method. Extra
information: (a) For bracketing methods, initial guesses of 0
and R will bracket a single root for this example. (b) For
open methods, an initial guess of R will always converge.
6.23 Perform the identical MATLAB operations as those
in Example 6.8 to manipulate and find all the roots of the
polynomial
f5(x) = (x + 2)(x + 5)(x − 6)(x − 4)(x − 8)
6.24 In control systems analysis, transfer functions are
developed that mathematically relate the dynamics of a sys-
tem’s input to its output. A transfer function for a robotic
positioning system is given by
G(s) =
C(s)
N(s)
=
s3
+ 9s2
+ 26s + 24
s4 + 15s3 + 77s2 + 153s + 90](https://image.slidesharecdn.com/appliednumericalmethodswithmatlabforengineersandscientiststhirdedition-230804185537-e8e53c83/85/Applied-Numerical-Methods-With-MATLAB-For-Engineers-And-Scientists-Third-Edition-200-320.jpg)
![where G(s) = system gain, C(s) = system output, N(s) =
system input, and s = Laplace transform complex frequency.
Use MATLAB to find the roots of the numerator and de-
nominator and factor these into the form
G(s) =
(s + a1)(s + a2)(s + a3)
(s + b1)(s + b2)(s + b3)(s + b4)
where ai and bi = the roots of the numerator and denomina-
tor, respectively.
6.25 The Manning equation can be written for a rectangular
open channel as
Q =
√
S(BH)5/3
n(B + 2H)2/3
where Q = flow (m3
/s), S = slope (m/m), H = depth (m),
and n = the Manning roughness coefficient. Develop a
fixed-point iteration scheme to solve this equation for H
given Q = 5, S = 0.0002, B = 20, and n = 0.03. Perform the
computation until εa is less than εs = 0.05%. Prove that
your scheme converges for all initial guesses greater than or
equal to zero.
6.26 See if you can develop a foolproof function to compute
the friction factor based on the Colebrook equation as
described in Sec. 6.7. Your function should return a precise
result for Reynolds number ranging from 4000 to 107
and for
ε/D ranging from 0.00001 to 0.05.
6.27 Use the Newton-Raphson method to find the root of
f (x) = e−0.5x
(4 − x) − 2
Employ initial guesses of (a) 2, (b) 6, and (c) 8. Explain your
results.
6.28 Given
f (x) = −2x6
− 1.5x4
+ 10x + 2
Use a root-location technique to determine the maximum of
this function. Perform iterations until the approximate rela-
tive error falls below 5%. If you use a bracketing method,
use initial guesses of xl = 0 and xu = 1. If you use the
Newton-Raphson or the modified secant method, use an ini-
tial guess of xi = 1. If you use the secant method, use initial
PROBLEMS 181
guesses of xi−1 = 0 and xi = 1. Assuming that conver-
gence is not an issue, choose the technique that is best suited
to this problem. Justify your choice.
6.29 You must determine the root of the following easily
differentiable function:
e0.5x
= 5 − 5x
Pick the best numerical technique, justify your choice, and
then use that technique to determine the root. Note that it is
known that for positive initial guesses, all techniques except
fixed-point iteration will eventually converge. Perform iter-
ations until the approximate relative error falls below 2%. If
you use a bracketing method, use initial guesses of xl = 0
and xu = 2. If you use the Newton-Raphson or the modified
secant method, use an initial guess of xi = 0.7. If you use
the secant method, use initial guesses of xi−1 = 0 and
xi = 2.
6.30 (a) Develop an M-file function to implement Brent’s
root-location method. Base your function on Fig. 6.10, but
with the beginning of the function changed to
function [b,fb] = fzeronew(f,xl,xu,varargin)
% fzeronew: Brent root location zeroes
% [b,fb] = fzeronew(f,xl,xu,p1,p2,...):
% uses Brent’s method to find the root of f
% input:
% f = name of function
% xl, xu = lower and upper guesses
% p1,p2,... = additional parameters used by f
% output:
% b = real root
% fb = function value at root
Make the appropriate modifications so that the function per-
forms as outlined in the documentation statements. In addi-
tion, include error traps to ensure that the function’s three
required arguments (f,xl,xu) are prescribed, and that the
initial guesses bracket a root.
(b) Test your function by using it to solve for the root of the
function from Example 5.6 using
[x,fx] = fzeronew(@(x,n) x^n-1,0,1.3,10)](https://image.slidesharecdn.com/appliednumericalmethodswithmatlabforengineersandscientiststhirdedition-230804185537-e8e53c83/85/Applied-Numerical-Methods-With-MATLAB-For-Engineers-And-Scientists-Third-Edition-201-320.jpg)


![7.2 ONE-DIMENSIONAL OPTIMIZATION 191
Looking at the upper interval (x2, x1, xu), if the true value were at the far left, the max-
imum distance from the estimate would be
xa = x1 − x2
= xl + (φ − 1)(xu − xl) − xu + (φ − 1)(xu − xl)
= (xl − xu) + 2(φ − 1)(xu − xl)
= (2φ − 3)(xu − xl)
or 0.2361 (xu − xl). If the true value were at the far right, the maximum distance from the
estimate would be
xb = xu − x1
= xu − xl − (φ − 1)(xu − xl)
= (xu − xl) − (φ − 1)(xu − xl)
= (2 − φ)(xu − xl)
or 0.3820 (xu − xl). Therefore, this case would represent the maximum error. This result can
then be normalized to the optimal value for that iteration xopt to yield
εa = (2 − φ)
xu − xl
xopt
× 100% (7.9)
This estimate provides a basis for terminating the iterations.
An M-file function for the golden-section search for minimization is presented in
Fig. 7.7. The function returns the location of the minimum, the value of the function, the
approximate error, and the number of iterations.
The M-file can be used to solve the problem from Example 7.1.
g=9.81;v0=55;m=80;c=15;z0=100;
z=@(t) -(z0+m/c*(v0+m*g/c)*(1-exp(-c/m*t))-m*g/c*t);
[xmin,fmin,ea,iter]=goldmin(z,0,8)
xmin =
3.8317
fmin =
-192.8609
ea =
6.9356e-005
Notice how because this is a maximization, we have entered the negative of Eq. (7.1).
Consequently, fmin corresponds to a maximum height of 192.8609.
You may be wondering why we have stressed the reduced function evaluations of the
golden-section search. Of course, for solving a single optimization, the speed savings
would be negligible. However, there are two important contexts where minimizing the
number of function evaluations can be important. These are
1. Many evaluations. There are cases where the golden-section search algorithm may be a
part of a much larger calculation. In such cases, it may be called many times. Therefore,
keeping function evaluations to a minimum could pay great dividends for such cases.](https://image.slidesharecdn.com/appliednumericalmethodswithmatlabforengineersandscientiststhirdedition-230804185537-e8e53c83/85/Applied-Numerical-Methods-With-MATLAB-For-Engineers-And-Scientists-Third-Edition-211-320.jpg)
![192 OPTIMIZATION
FIGURE 7.7
An M-file to determine the minimum of a function with the golden-section search.
function [x,fx,ea,iter]=goldmin(f,xl,xu,es,maxit,varargin)
% goldmin: minimization golden section search
% [x,fx,ea,iter]=goldmin(f,xl,xu,es,maxit,p1,p2,...):
% uses golden section search to find the minimum of f
% input:
% f = name of function
% xl, xu = lower and upper guesses
% es = desired relative error (default = 0.0001%)
% maxit = maximum allowable iterations (default = 50)
% p1,p2,... = additional parameters used by f
% output:
% x = location of minimum
% fx = minimum function value
% ea = approximate relative error (%)
% iter = number of iterations
if nargin3,error('at least 3 input arguments required'),end
if nargin4|isempty(es), es=0.0001;end
if nargin5|isempty(maxit), maxit=50;end
phi=(1+sqrt(5))/2;
iter=0;
while(1)
d = (phi-1)*(xu - xl);
x1 = xl + d;
x2 = xu - d;
if f(x1,varargin{:}) f(x2,varargin{:})
xopt = x1;
xl = x2;
else
xopt = x2;
xu = x1;
end
iter=iter+1;
if xopt~=0, ea = (2 - phi) * abs((xu - xl) / xopt) * 100;end
if ea = es | iter = maxit,break,end
end
x=xopt;fx=f(xopt,varargin{:});
2. Time-consuming evaluation. For pedagogical reasons, we use simple functions in
most of our examples. You should understand that a function can be very complex
and time-consuming to evaluate. For example, optimization can be used to estimate
the parameters of a model consisting of a system of differential equations. For such
cases, the “function” involves time-consuming model integration. Any method that
minimizes such evaluations would be advantageous.](https://image.slidesharecdn.com/appliednumericalmethodswithmatlabforengineersandscientiststhirdedition-230804185537-e8e53c83/85/Applied-Numerical-Methods-With-MATLAB-For-Engineers-And-Scientists-Third-Edition-212-320.jpg)
![7.2 ONE-DIMENSIONAL OPTIMIZATION 193
7.2.2 Parabolic Interpolation
Parabolic interpolation takes advantage of the fact that a second-order polynomial often
provides a good approximation to the shape of f(x) near an optimum (Fig. 7.8).
Just as there is only one straight line connecting two points, there is only one parabola
connecting three points. Thus, if we have three points that jointly bracket an optimum, we
can fit a parabola to the points. Then we can differentiate it, set the result equal to zero, and
solve for an estimate of the optimal x. It can be shown through some algebraic manipula-
tions that the result is
x4 = x2 −
1
2
(x2 − x1)2
[ f (x2) − f (x3)] − (x2 − x3)2
[ f (x2) − f (x1)]
(x2 − x1) [ f (x2) − f (x3)] − (x2 − x3) [ f (x2) − f (x1)]
(7.10)
where x1, x2, and x3 are the initial guesses, and x4 is the value of x that corresponds to the
optimum value of the parabolic fit to the guesses.
EXAMPLE 7.3 Parabolic Interpolation
Problem Statement. Use parabolic interpolation to approximate the minimum of
f (x) =
x2
10
− 2 sin x
with initial guesses of x1 = 0, x2 = 1, and x3 = 4.
Solution. The function values at the three guesses can be evaluated:
x1 = 0 f(x1) = 0
x2 = 1 f(x2) = −1.5829
x3 = 4 f(x3) = 3.1136
FIGURE 7.8
Graphical depiction of parabolic interpolation.
x
x1 x2 x4 x3
Parabolic
approximation
of maximum
Parabolic
function
True maximum
True function
f(x)](https://image.slidesharecdn.com/appliednumericalmethodswithmatlabforengineersandscientiststhirdedition-230804185537-e8e53c83/85/Applied-Numerical-Methods-With-MATLAB-For-Engineers-And-Scientists-Third-Edition-213-320.jpg)
![194 OPTIMIZATION
and substituted into Eq. (7.10) to give
x4 = 1 −
1
2
(1 − 0)2
[−1.5829 − 3.1136] − (1 − 4)2
[−1.5829 − 0]
(1 − 0) [−1.5829 − 3.1136] − (1 − 4) [−1.5829 − 0]
= 1.5055
which has a function value of f(1.5055) = −1.7691.
Next, a strategy similar to the golden-section search can be employed to determine
which point should be discarded. Because the function value for the new point is lower
than for the intermediate point (x2) and the new x value is to the right of the intermediate
point, the lower guess (x1) is discarded. Therefore, for the next iteration:
x1 = 1 f(x1) = −1.5829
x2 = 1.5055 f(x2) = −1.7691
x3 = 4 f(x3) = 3.1136
which can be substituted into Eq. (7.10) to give
x4 = 1.5055 −
1
2
(1.5055 − 1)2
[−1.7691 − 3.1136] − (1.5055 − 4)2
[−1.7691 − (−1.5829)]
(1.5055 − 1) [−1.7691 − 3.1136] − (1.5055 − 4) [−1.7691 − (−1.5829)]
= 1.4903
which has a function value of f(1.4903) = −1.7714. The process can be repeated, with the
results tabulated here:
i x1 f(x1) x2 f(x2) x3 f(x3) x4 f(x4)
1 0.0000 0.0000 1.0000 −1.5829 4.0000 3.1136 1.5055 −1.7691
2 1.0000 −1.5829 1.5055 −1.7691 4.0000 3.1136 1.4903 −1.7714
3 1.0000 −1.5829 1.4903 −1.7714 1.5055 −1.7691 1.4256 −1.7757
4 1.0000 −1.5829 1.4256 −1.7757 1.4903 −1.7714 1.4266 −1.7757
5 1.4256 −1.7757 1.4266 −1.7757 1.4903 −1.7714 1.4275 −1.7757
Thus, within five iterations, the result is converging rapidly on the true value of −1.7757
at x = 1.4276.
7.2.3 MATLAB Function: fminbnd
Recall that in Sec. 6.4 we described Brent’s method for root location, which combined sev-
eral root-finding methods into a single algorithm that balanced reliability with efficiency.
Because of these qualities, it forms the basis for the built-in MATLAB function fzero.
Brent also developed a similar approach for one-dimensional minimization which
forms the basis for the MATLAB fminbnd function. It combines the slow, dependable
golden-section search with the faster, but possibly unreliable, parabolic interpolation. It
first attempts parabolic interpolation and keeps applying it as long as acceptable results are
obtained. If not, it uses the golden-section search to get matters in hand.](https://image.slidesharecdn.com/appliednumericalmethodswithmatlabforengineersandscientiststhirdedition-230804185537-e8e53c83/85/Applied-Numerical-Methods-With-MATLAB-For-Engineers-And-Scientists-Third-Edition-214-320.jpg)
![7.3 MULTIDIMENSIONAL OPTIMIZATION 195
A simple expression of its syntax is
[xmin, fval] = fminbnd(function,x1,x2)
where x and fval are the location and value of the minimum, function is the name of the
function being evaluated, and x1 and x2 are the bounds of the interval being searched.
Here is a simple MATLAB session that uses fminbnd to solve the problem from
Example 7.1.
g=9.81;v0=55;m=80;c=15;z0=100;
z=@(t) -(z0+m/c*(v0+m*g/c)*(1-exp(-c/m*t))-m*g/c*t);
[x,f]=fminbnd(z,0,8)
x =
3.8317
f =
-192.8609
As with fzero, optional parameters can be specified using optimset. For example,
we can display calculation details:
options = optimset('display','iter');
fminbnd(z,0,8,options)
Func-count x f(x) Procedure
1 3.05573 -189.759 initial
2 4.94427 -187.19 golden
3 1.88854 -171.871 golden
4 3.87544 -192.851 parabolic
5 3.85836 -192.857 parabolic
6 3.83332 -192.861 parabolic
7 3.83162 -192.861 parabolic
8 3.83166 -192.861 parabolic
9 3.83169 -192.861 parabolic
Optimization terminated:
the current x satisfies the termination criteria using
OPTIONS.TolX of 1.000000e-004
ans =
3.8317
Thus, after three iterations, the method switches from golden to parabolic, and after eight
iterations, the minimum is determined to a tolerance of 0.0001.
7.3 MULTIDIMENSIONAL OPTIMIZATION
Aside from one-dimensional functions, optimization also deals with multidimensional
functions. Recall from Fig. 7.3a that our visual image of a one-dimensional search was like
a roller coaster. For two-dimensional cases, the image becomes that of mountains and
valleys (Fig. 7.3b). As in the following example, MATLAB’s graphic capabilities provide
a handy means to visualize such functions.](https://image.slidesharecdn.com/appliednumericalmethodswithmatlabforengineersandscientiststhirdedition-230804185537-e8e53c83/85/Applied-Numerical-Methods-With-MATLAB-For-Engineers-And-Scientists-Third-Edition-215-320.jpg)
![196 OPTIMIZATION
x2
x1
3
2
1
0 –2
–1
0
3
⫹
⫹
⫹
⫹
⫹
⫹
3
⫹
4
1
2
⫹
3
⫹
2
⫹
4
⫹6
⫹
7
8 ⫹
5
7
6
(a) Contour plot (b) Mesh plot
2.5
2
1.5
x
2
x1
f
(x
1
,
x
2
)
1
0.5
0
–2 –1.5 –1 –0.5 0
8
6
4
2
0
FIGURE 7.9
(a) Contour and (b) mesh plots of a two-dimensional function.
EXAMPLE 7.4 Visualizing a Two-Dimensional Function
Problem Statement. Use MATLAB’s graphical capabilities to display the following
function and visually estimate its minimum in the range –2 ≤ x1 ≤ 0 and 0 ≤ x2 ≤ 3:
f (x1, x2) = 2 + x1 − x2 + 2x2
1 + 2x1x2 + x2
2
Solution. The following script generates contour and mesh plots of the function:
x=linspace(-2,0,40);y=linspace(0,3,40);
[X,Y] = meshgrid(x,y);
Z=2+X-Y+2*X.^2+2*X.*Y+Y.^2;
subplot(1,2,1);
cs=contour(X,Y,Z);clabel(cs);
xlabel('x_1');ylabel('x_2');
title('(a) Contour plot');grid;
subplot(1,2,2);
cs=surfc(X,Y,Z);
zmin=floor(min(Z));
zmax=ceil(max(Z));
xlabel('x_1');ylabel('x_2');zlabel('f(x_1,x_2)');
title('(b) Mesh plot');
As displayed in Fig. 7.9, both plots indicate that function has a minimum value of about
f(x1, x2) = 0 to 1 located at about x1 = −1 and x2 = 1.5.](https://image.slidesharecdn.com/appliednumericalmethodswithmatlabforengineersandscientiststhirdedition-230804185537-e8e53c83/85/Applied-Numerical-Methods-With-MATLAB-For-Engineers-And-Scientists-Third-Edition-216-320.jpg)
![7.4 CASE STUDY 197
Techniques for multidimensional unconstrained optimization can be classified in a
number of ways. For purposes of the present discussion, we will divide them depending
on whether they require derivative evaluation. Those that require derivatives are called
gradient, or descent (or ascent), methods. The approaches that do not require derivative eval-
uation are called nongradient, or direct, methods. As described next, the built-in MATLAB
function fminsearch is a direct method.
7.3.1 MATLAB Function: fminsearch
Standard MATLAB has a function fminsearch that can be used to determine the mini-
mum of a multidimensional function. It is based on the Nelder-Mead method, which is a
direct-search method that uses only function values (does not require derivatives) and
handles non-smooth objective functions. A simple expression of its syntax is
[xmin, fval] = fminsearch(function,x0)
where xmin and fval are the location and value of the minimum, function is the name of
the function being evaluated, and x0 is the initial guess. Note that x0 can be a scalar, vector,
or a matrix.
Here is a simple MATLAB session that uses fminsearch to determine minimum for
the function we just graphed in Example 7.4:
f=@(x) 2+x(1)-x(2)+2*x(1)^2+2*x(1)*x(2)+x(2)^2;
[x,fval]=fminsearch(f,[-0.5,0.5])
x =
-1.0000 1.5000
fval =
0.7500
7.4 CASE STUDY EQUILIBRIUM AND MINIMUM POTENTIAL ENERGY
Background. As in Fig. 7.10a, an unloaded spring can be attached to a wall mount.
When a horizontal force is applied, the spring stretches. The displacement is related to the
force by Hookes law, F = kx. The potential energy of the deformed state consists of the dif-
ference between the strain energy of the spring and the work done by the force:
PE(x) = 0.5kx2
− Fx
(7.11)
(a)
(b)
F
k
x
FIGURE 7.10
(a) An unloaded spring attached to a wall mount. (b) Application of a horizontal force stretches
the spring where the relationship between force and displacement is described by Hooke’s law.](https://image.slidesharecdn.com/appliednumericalmethodswithmatlabforengineersandscientiststhirdedition-230804185537-e8e53c83/85/Applied-Numerical-Methods-With-MATLAB-For-Engineers-And-Scientists-Third-Edition-217-320.jpg)

![PROBLEMS 199
PROBLEMS
7.1 Perform three iterations of the Newton-Raphson method
to determine the root of Eq. (E7.1.1). Use the parameter val-
ues from Example 7.1 along with an initial guess of t = 3 s.
7.2 Given the formula
f (x) = −x2
+ 8x − 12
(a) Determine the maximum and the corresponding value of
x for this function analytically (i.e., using differentiation).
(b) Verify that Eq. (7.10) yields the same results based on
initial guesses of x1 = 0, x2 = 2, and x3 = 6.
7.3 Consider the following function:
f (x) = 3 + 6x + 5x2
+ 3x3
+ 4x4
Locate the minimum by finding the root of the derivative of
this function. Use bisection with initial guesses of xl = −2
and xu = 1.
7.4 Given
f (x) = −1.5x6
− 2x4
+ 12x
(a) Plot the function.
(b) Use analytical methods to prove that the function is con-
cave for all values of x.
(c) Differentiate the function and then use a root-location
method to solve for the maximum f(x) and the corre-
sponding value of x.
7.5 Solve for the value of x that maximizes f(x) in Prob. 7.4
using the golden-section search. Employ initial guesses of
xl = 0 and xu = 2, and perform three iterations.
7.6 Repeat Prob. 7.5, except use parabolic interpolation.
Employ initial guesses of x1 = 0, x2 = 1, and x3 = 2, and per-
form three iterations.
7.7 Employ the following methods to find the maximum of
f (x) = 4x − 1.8x2
+ 1.2x3
− 0.3x4
(a) Golden-section search (xl = –2, xu = 4, εs = 1%).
(b) Parabolic interpolation (x1 = 1.75, x2 = 2, x3 = 2.5,
iterations = 5).
7.8 Consider the following function:
f (x) = x4
+ 2x3
+ 8x2
+ 5x
Use analytical and graphical methods to show the function
has a minimum for some value of x in the range
−2 ≤ x ≤ 1.
7.4 CASE STUDY continued
Solution. An M-file can be developed to hold the potential energy function:
function p=PE(x,ka,kb,La,Lb,F1,F2)
PEa=0.5*ka*(sqrt(x(1)^2+(La-x(2))^2)-La)^2;
PEb=0.5*kb*(sqrt(x(1)^2+(Lb+x(2))^2)-Lb)^2;
W=F1*x(1)+F2*x(2);
p=PEa+PEb-W;
The solution can be obtained with the fminsearch function:
ka=9;kb=2;La=10;Lb=10;F1=2;F2=4;
[x,f]=fminsearch(@PE,[-0.5,0.5],[],ka,kb,La,Lb,F1,F2)
x =
4.9523 1.2769
f =
-9.6422
Thus, at equilibrium, the potential energy is −9.6422 N· cm. The connecting point is
located 4.9523 cm to the right and 1.2759 cm above its original position.](https://image.slidesharecdn.com/appliednumericalmethodswithmatlabforengineersandscientiststhirdedition-230804185537-e8e53c83/85/Applied-Numerical-Methods-With-MATLAB-For-Engineers-And-Scientists-Third-Edition-219-320.jpg)


This document is intentionally blank. Applied Numerical Methods with MATLAB for Engineers and Scientists, Third Edition by Steven C. Chapra is a textbook that covers numerical methods and their application to engineering and science problems. It uses MATLAB to demonstrate the numerical techniques. The book contains chapters on modeling, roots and optimization, linear systems, curve fitting, integration and differentiation, and ordinary differential equations. It is designed to support a one-semester course in numerical methods.


![175 thuc-hanh-matlab-[dh-khoa-hoc-tu-nhien-hcm]](https://cdn.slidesharecdn.com/ss_thumbnails/175-thuc-hanh-matlab-dh-khoa-hoc-tu-nhien-hcm-160530204920-thumbnail.jpg?width=640&height=640&fit=bounds)